
EB Weekly Market Report - Monday, October 20, 2025
ChartLists/Spreadsheets
The following ChartLists/Spreadsheets were updated over the weekend:
- Strong Earnings (SECL)
- Strong Future Earnings (SFECL)
- Raised Guidance (RGCL)
- Bullish Trifecta (BTCL)
- Leading Stock (LSCL)
- Hot Stocks (HTCL)
- Key Manipulation Spreadsheet
The above ChartLists and spreadsheet have been updated on our website. The Hot Stocks ChartList (HTCL) is a fairly new ChartList at EarningsBeats.com. It was created by our very own Matt Townsend, who employs a number of momentum strategies in identifying what he believes are 20 very hot momentum stocks. His strategy is to hold onto these stocks as long as the momentum remains. You can read more about this new feature under "ChartLists" on our website.
Weekly Market Recap
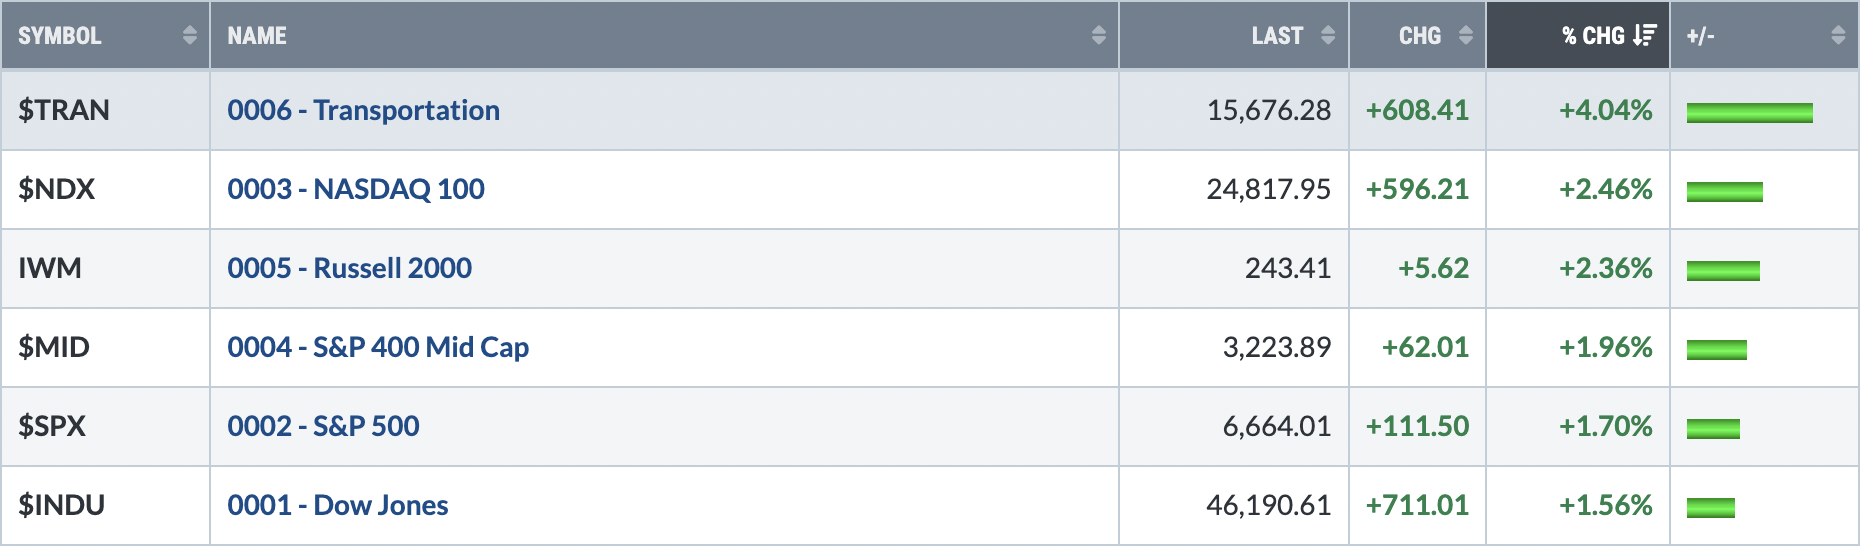
Major Indices
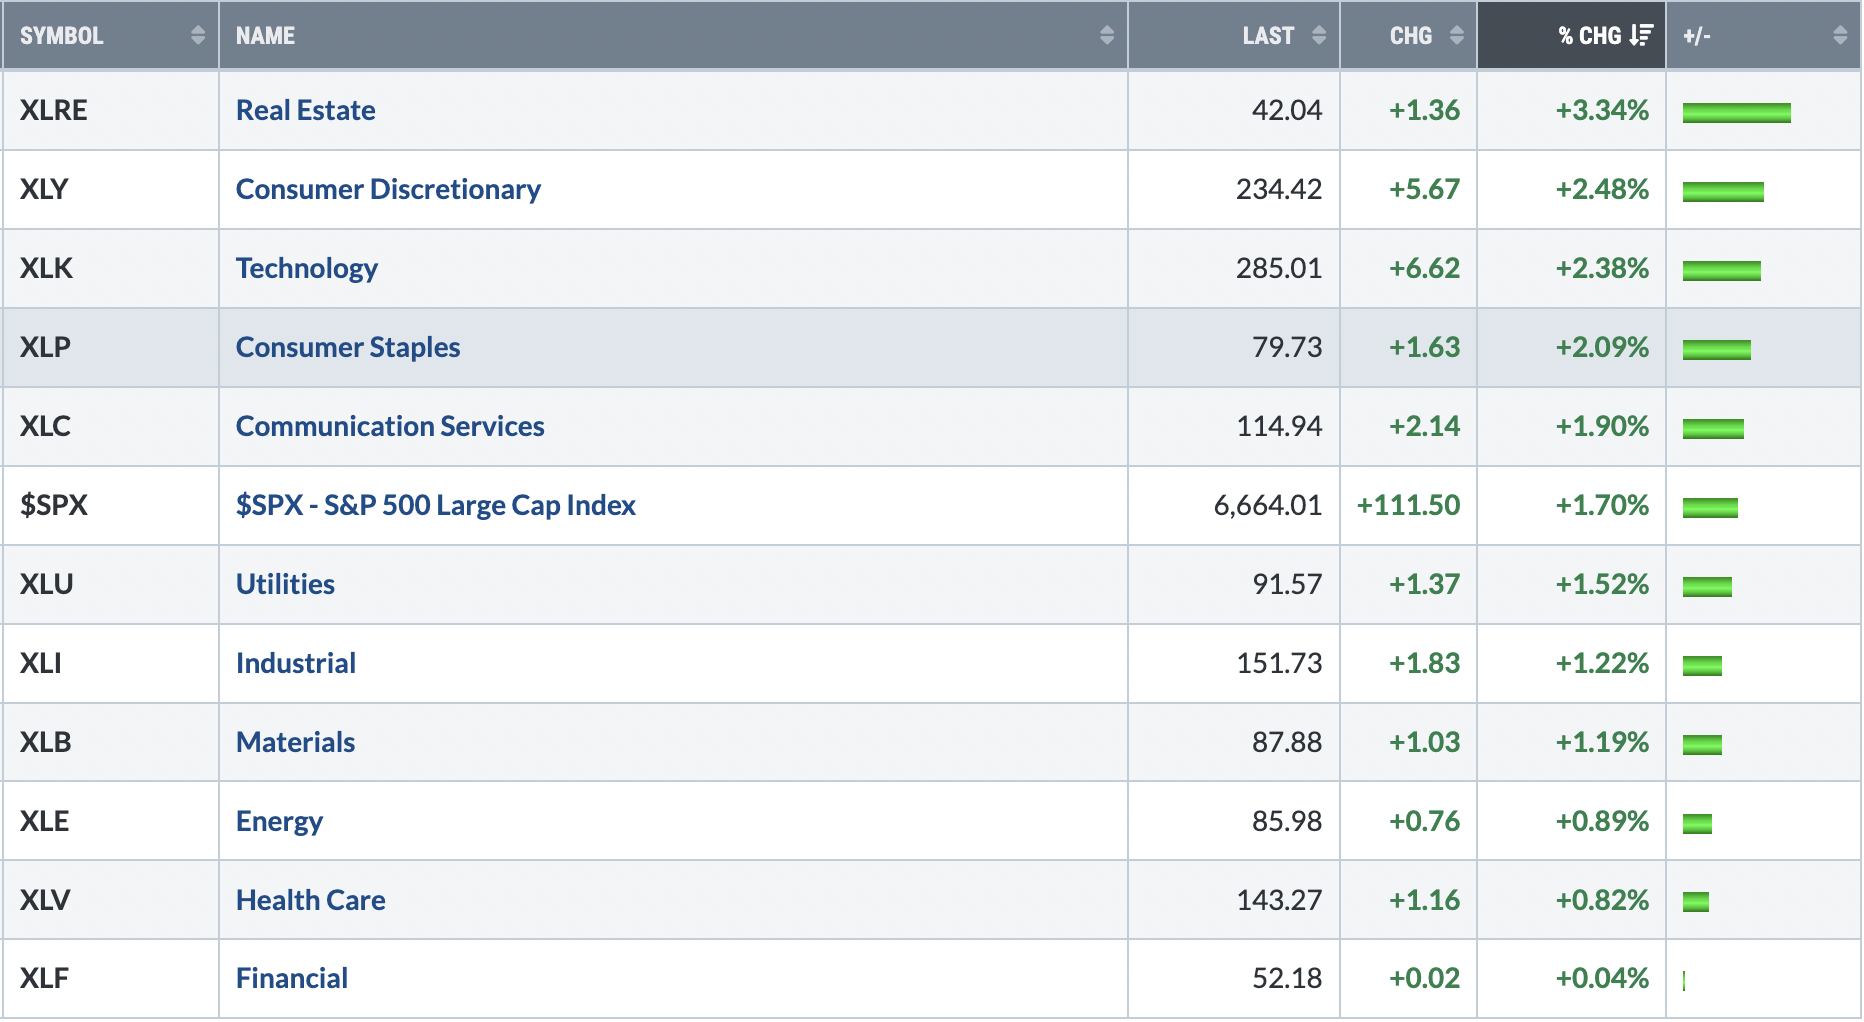
Sectors
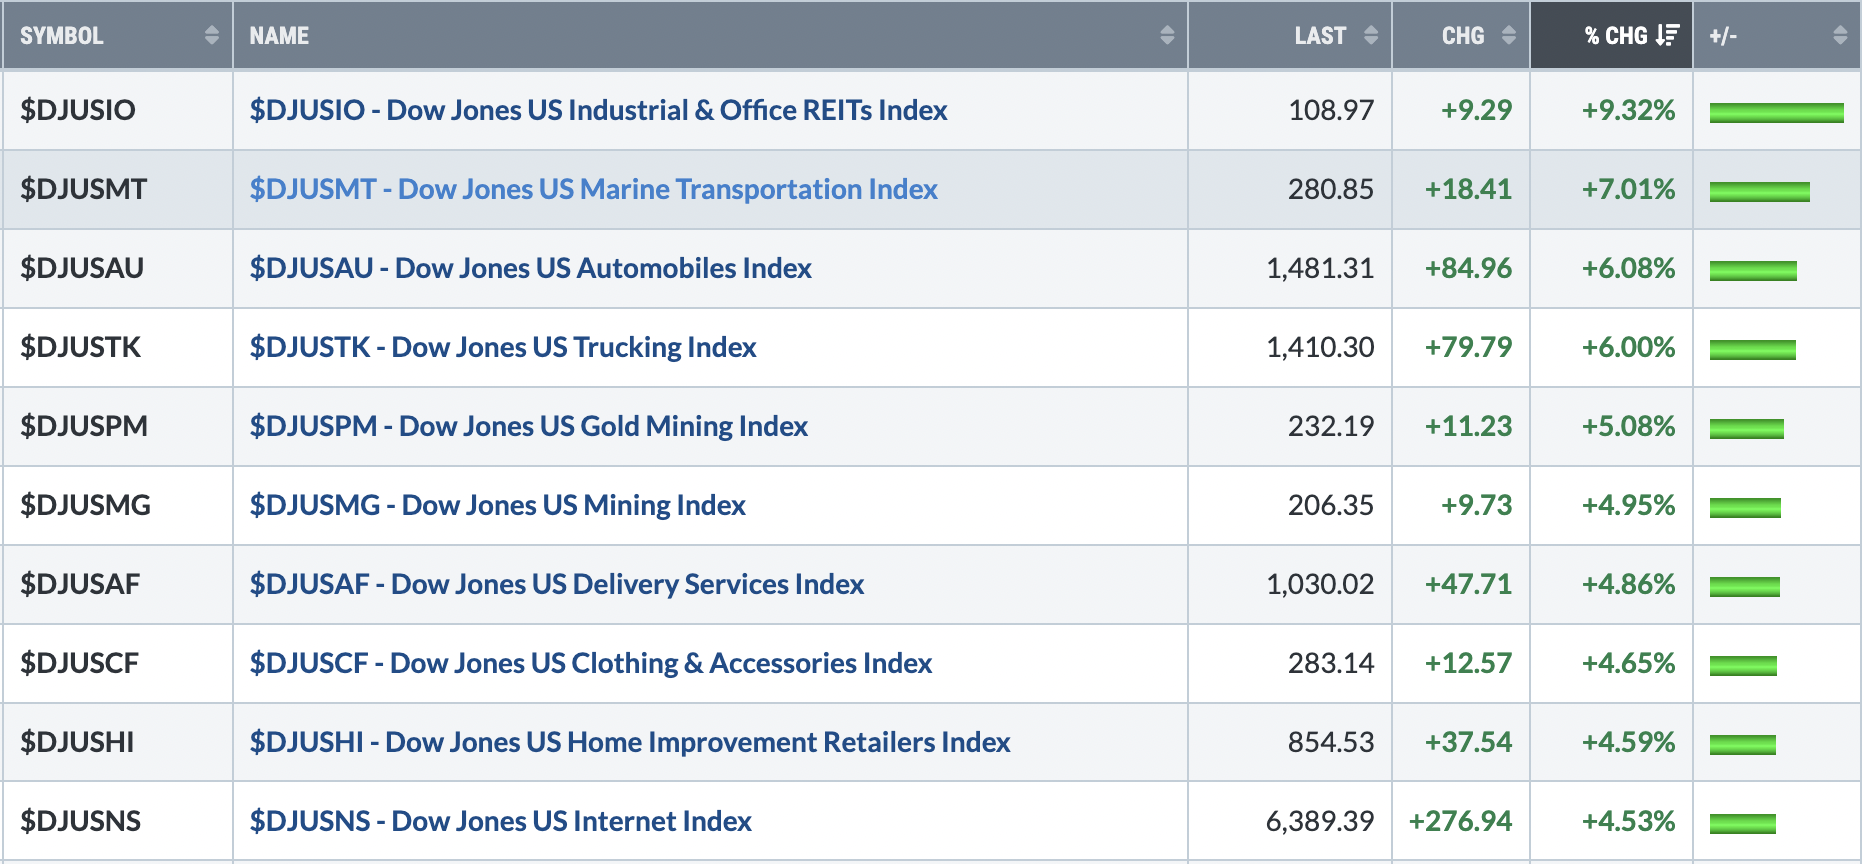
Top 10 Industries Last Week
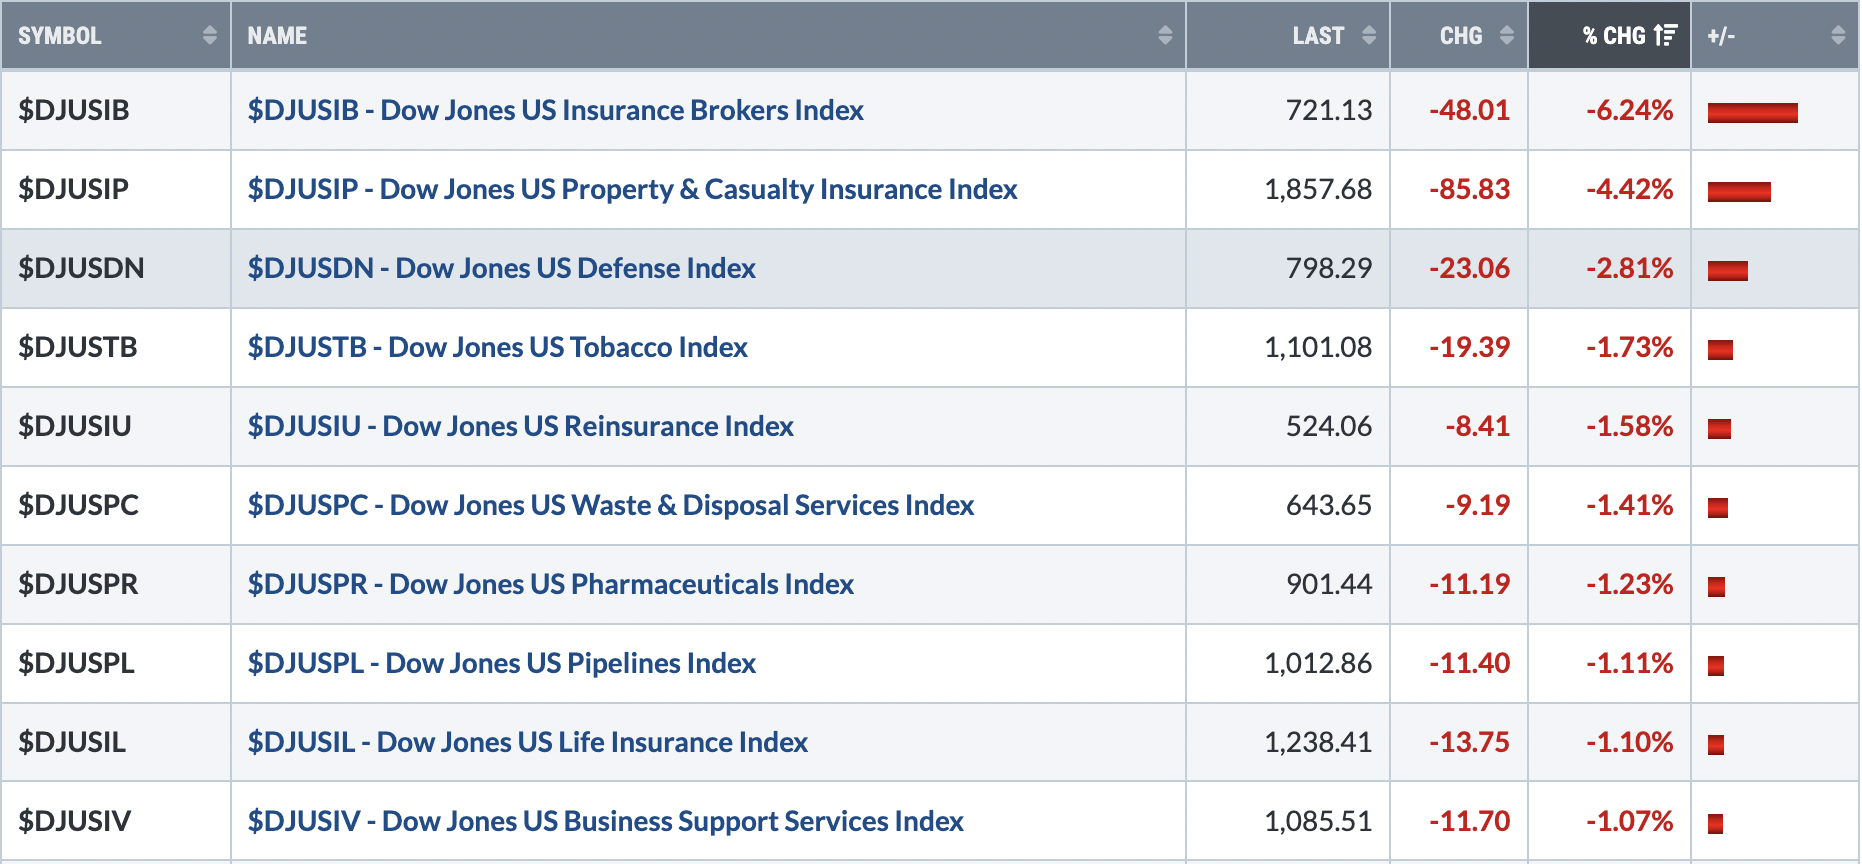
Bottom 10 Industries Last Week
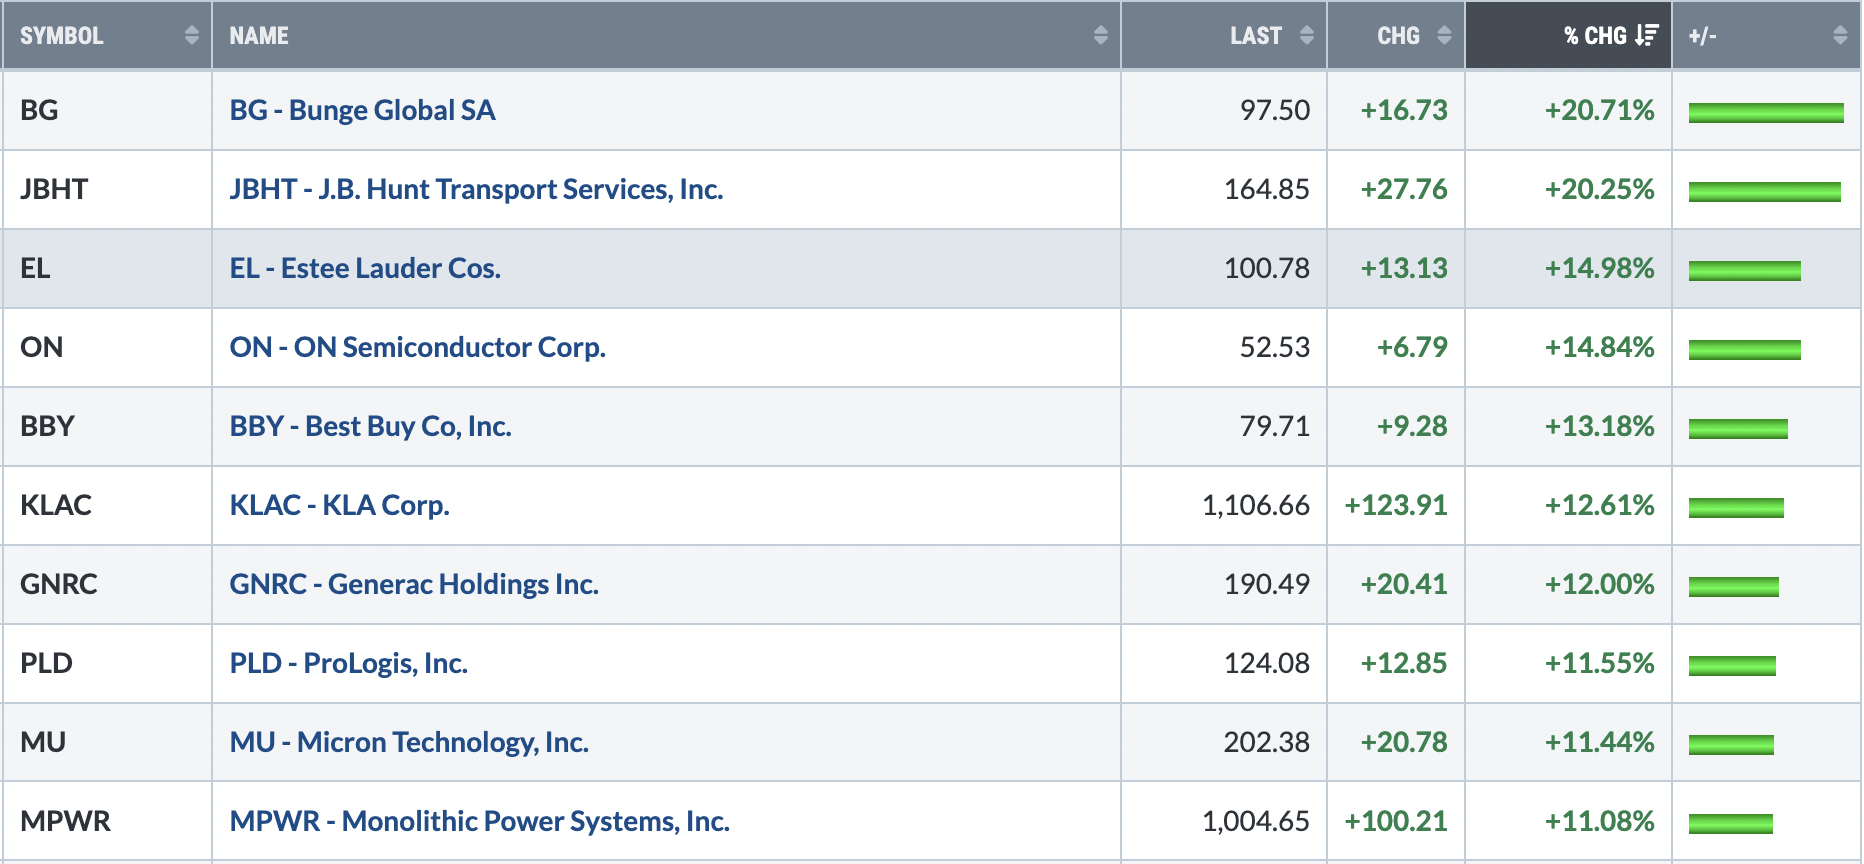
Top 10 Stocks - S&P 500/NASDAQ 100
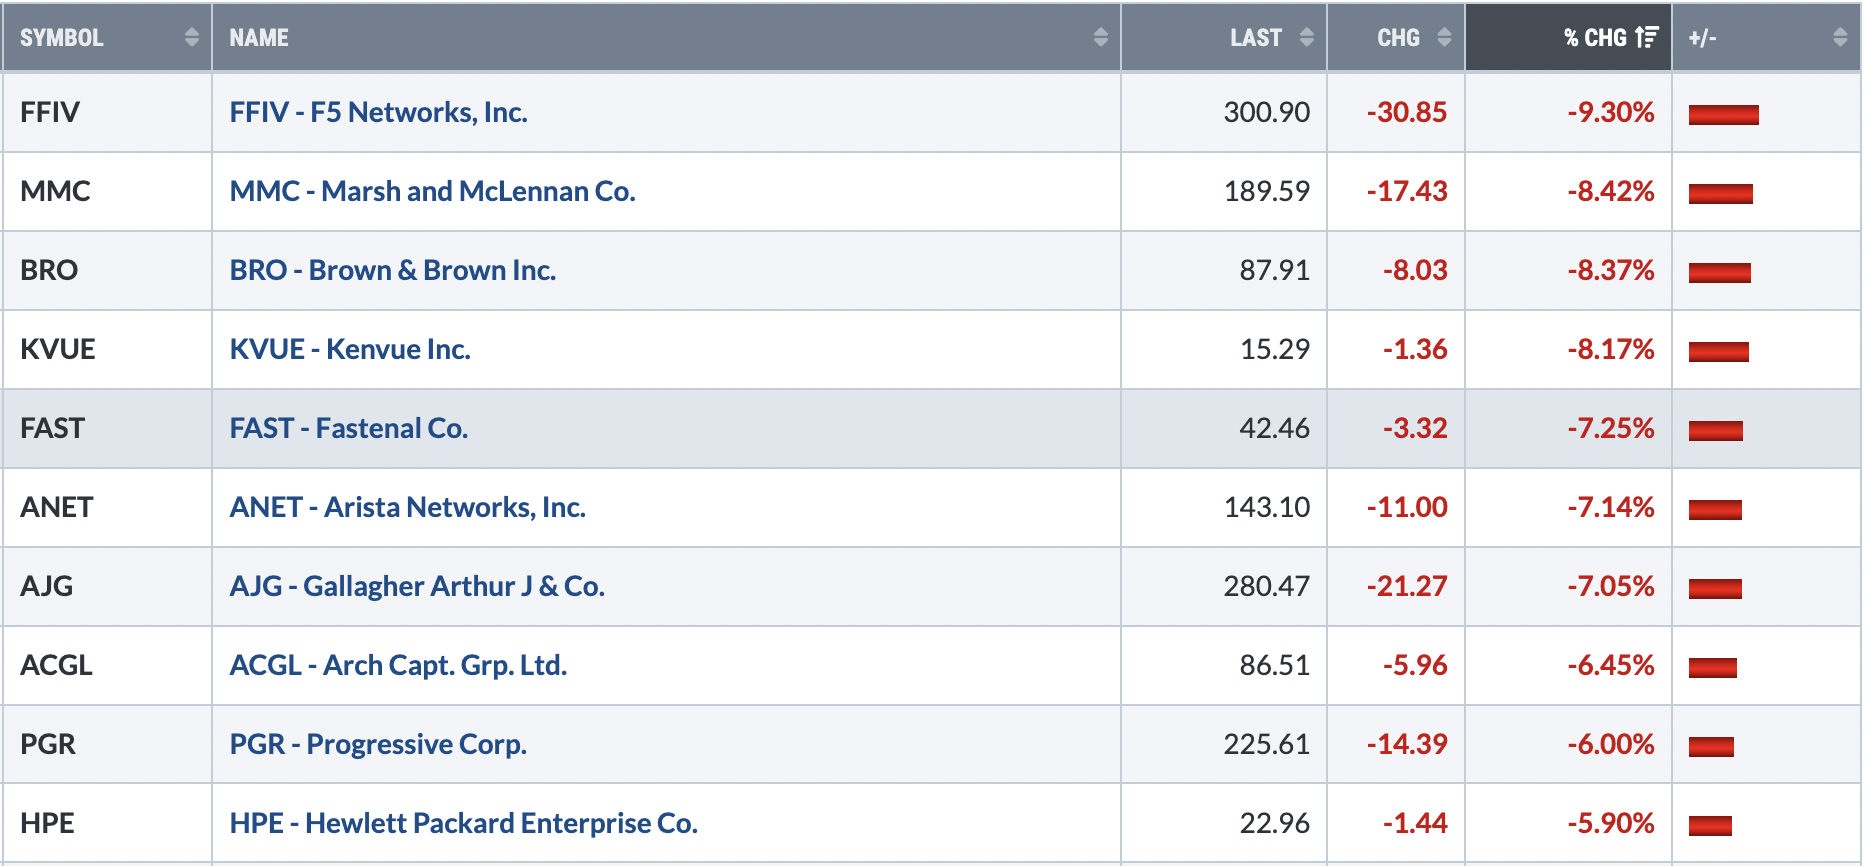
Bottom 10 Stocks - S&P 500/NASDAQ 100
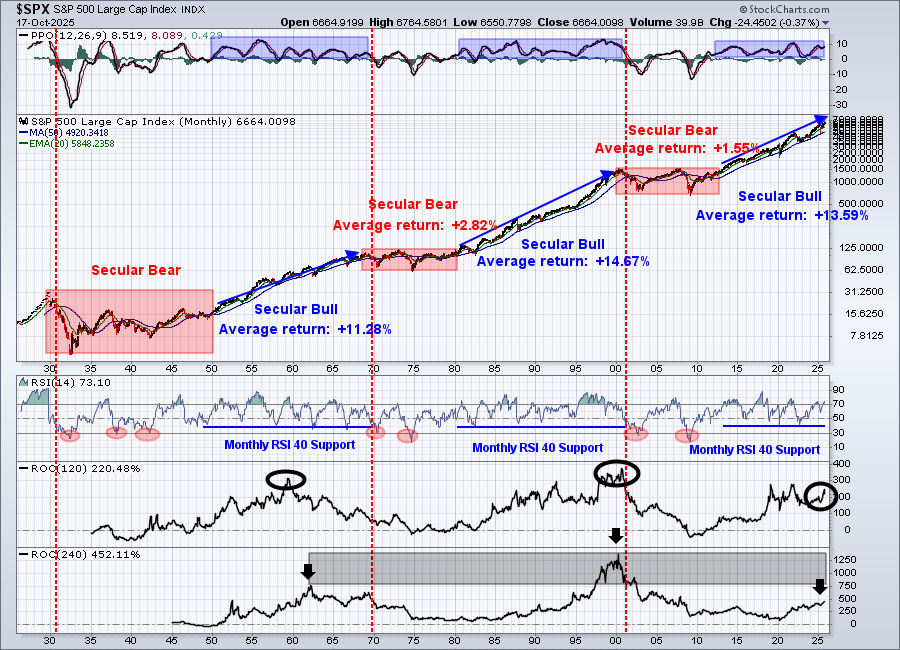
Big Picture
It didn't take long for our major indices to bounce back from the selling 10 days ago. There was a gap up on Monday morning and much of the pressure last week was on the bears. I believe the short-term remains dicey with the Friday, October 10th close remaining key support, in my view. We very well could be in the "B" phase of an ABC correction. That would mean one more low on the way to complete the "C". It also would coincide with seasonal weakness as the October 21st close through the October 27th close represents the worst period of performance on the S&P 500 since 1950. That's not opinion, that's fact. It doesn't mean that we'll see a big selloff, or even a selloff at all, it simply means that the market does have a tendency to weaken during this upcoming period.
Sustainability Ratios
Here's the latest look at our key intraday ratios as we follow where the money is traveling on an INTRADAY basis (ignoring gaps):
QQQ:SPY
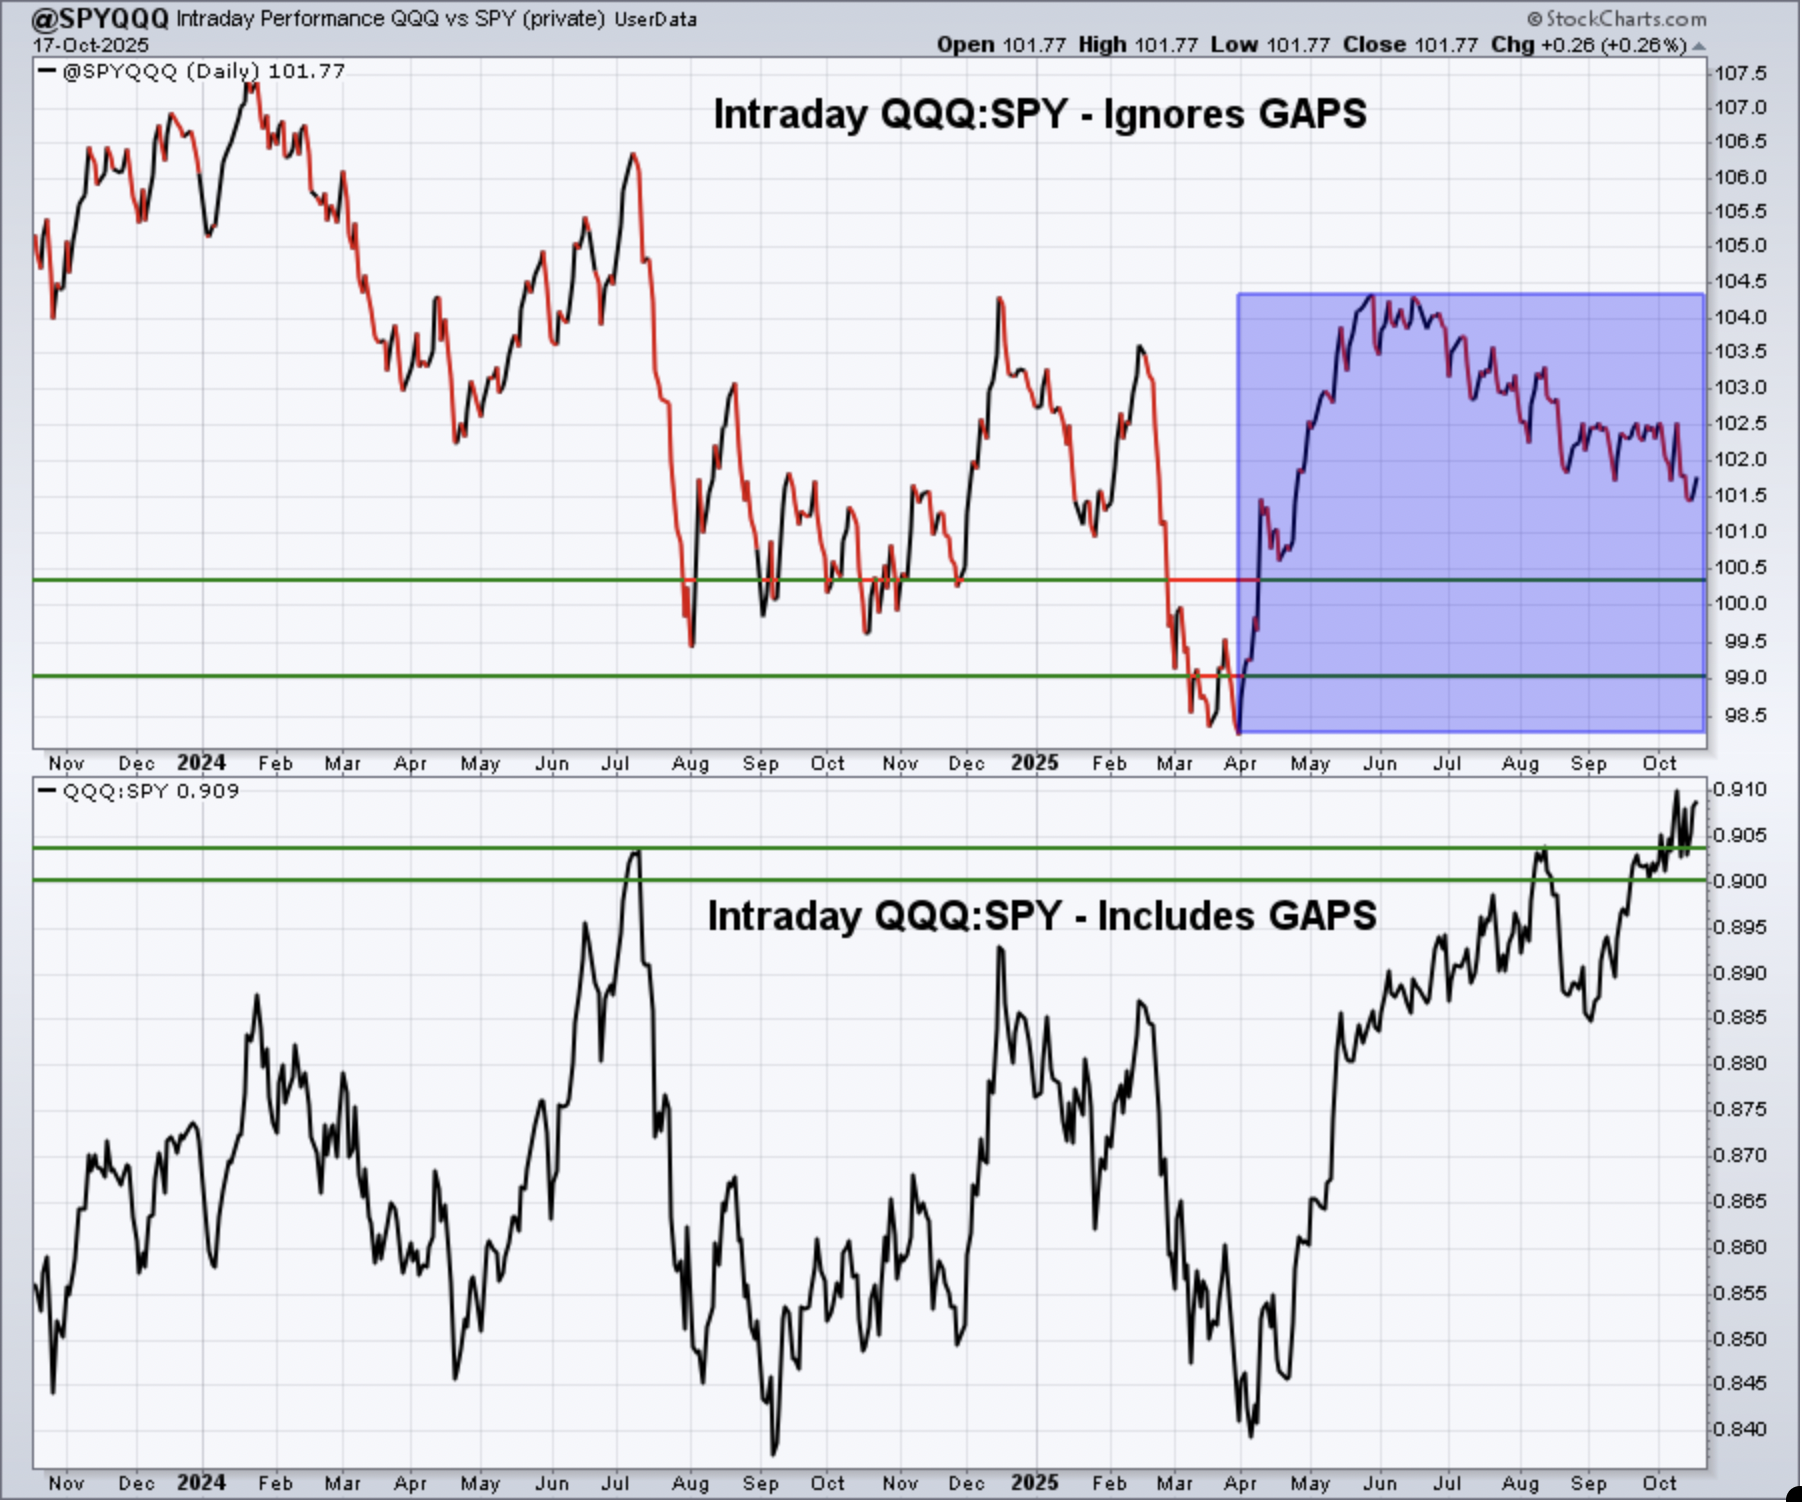
The intraday downtrend here, along with the intraday downtrend in the XLY vs. XLP ratio leads me to believe that one more leg lower is becoming more likely. It's also a signal that the recent rotation into small caps accelerates in coming weeks.
IWM:QQQ
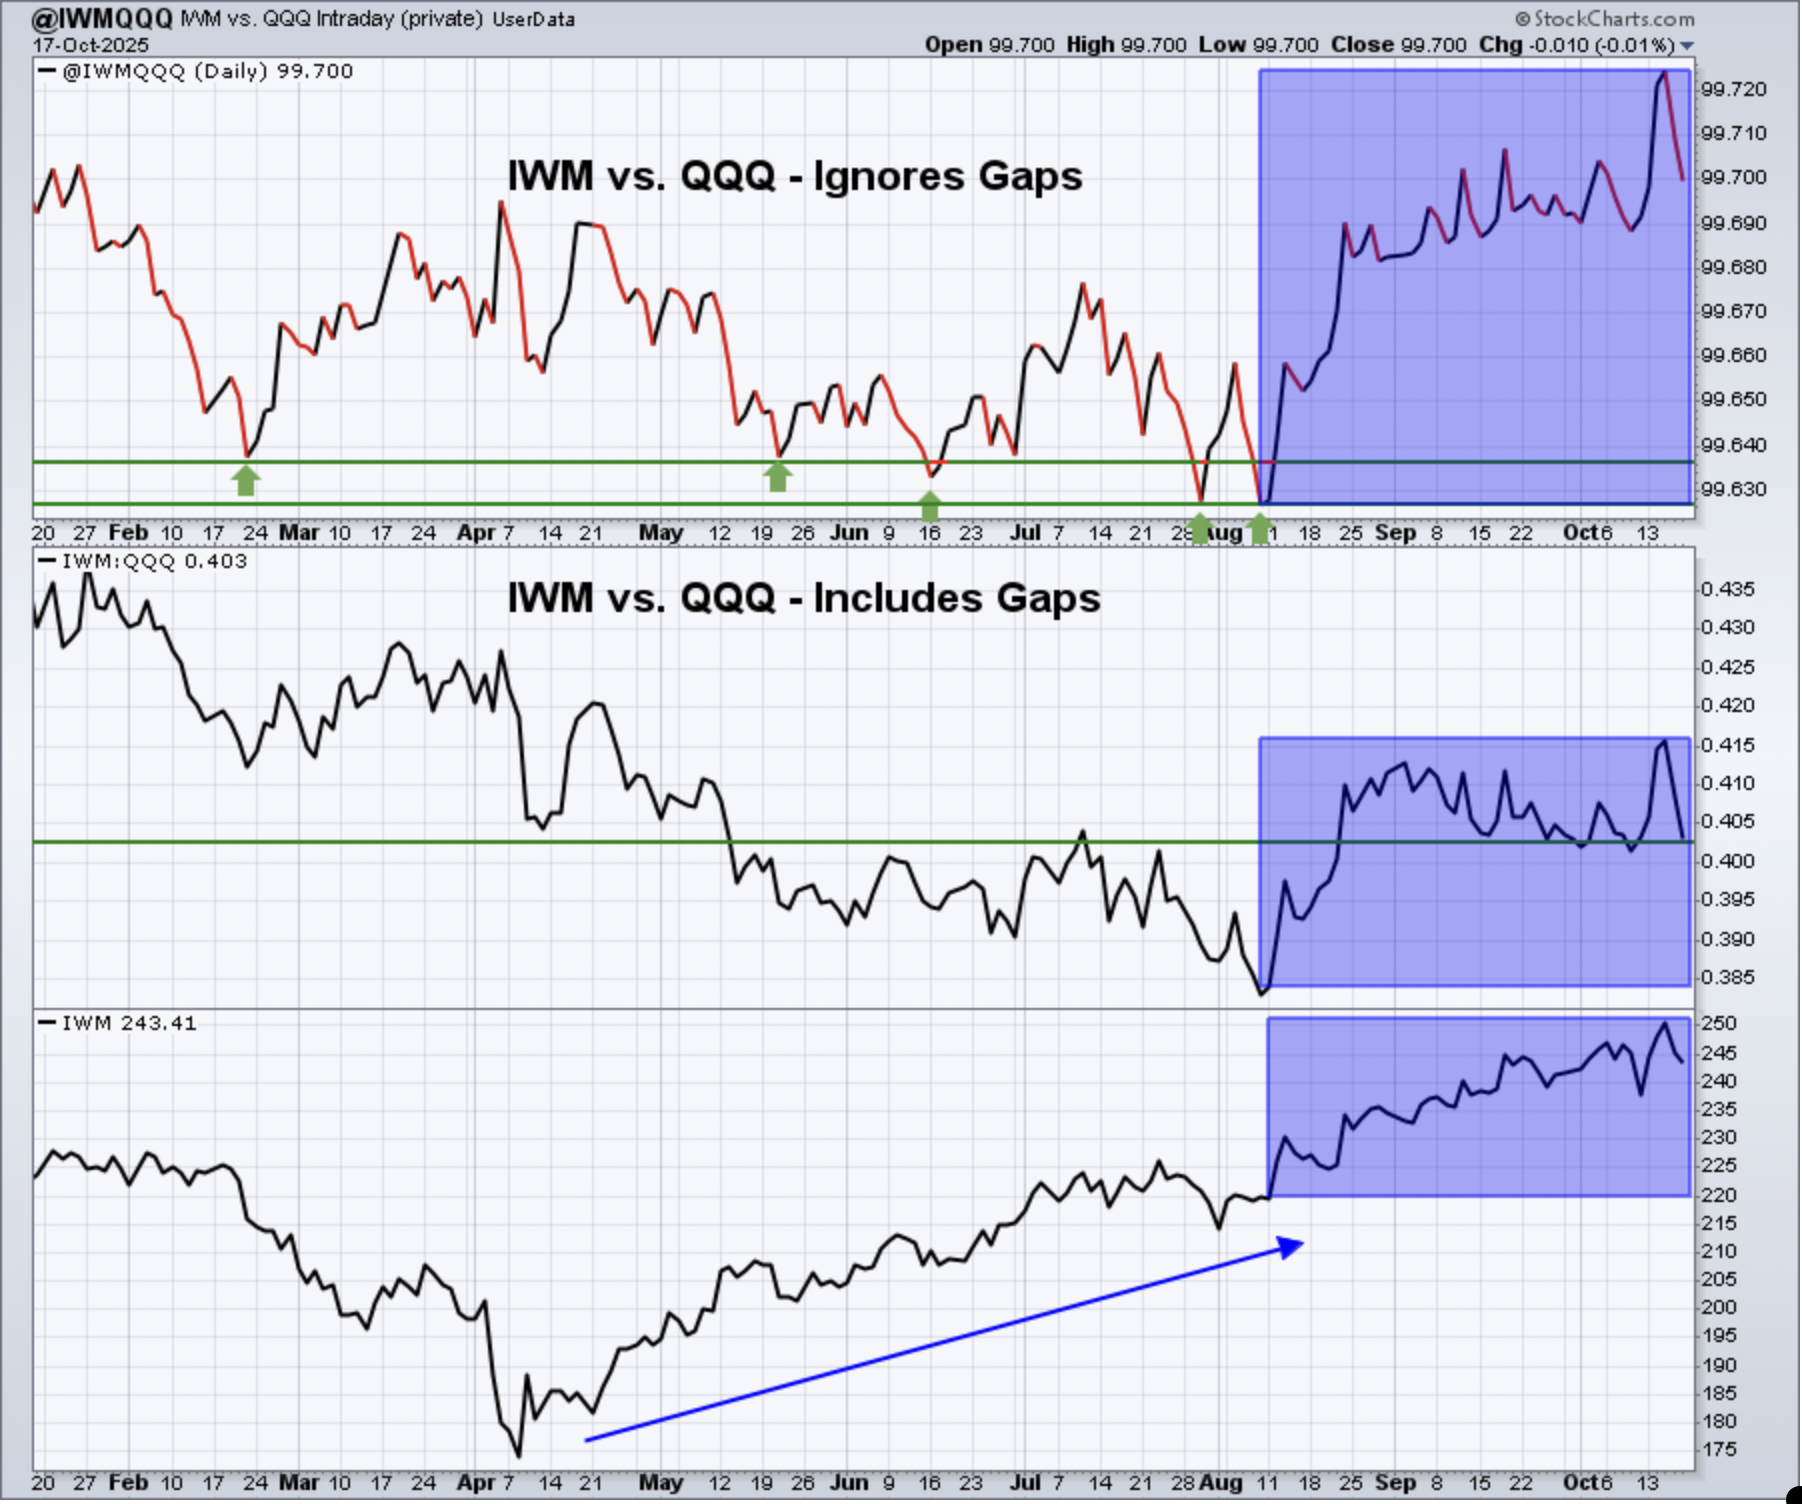
The IWM weakened a bit vs. large cap stocks after its Wednesday high last week, but the bigger picture still seems to favor small caps based on both the intraday and closing analyses above.
XLY:XLP
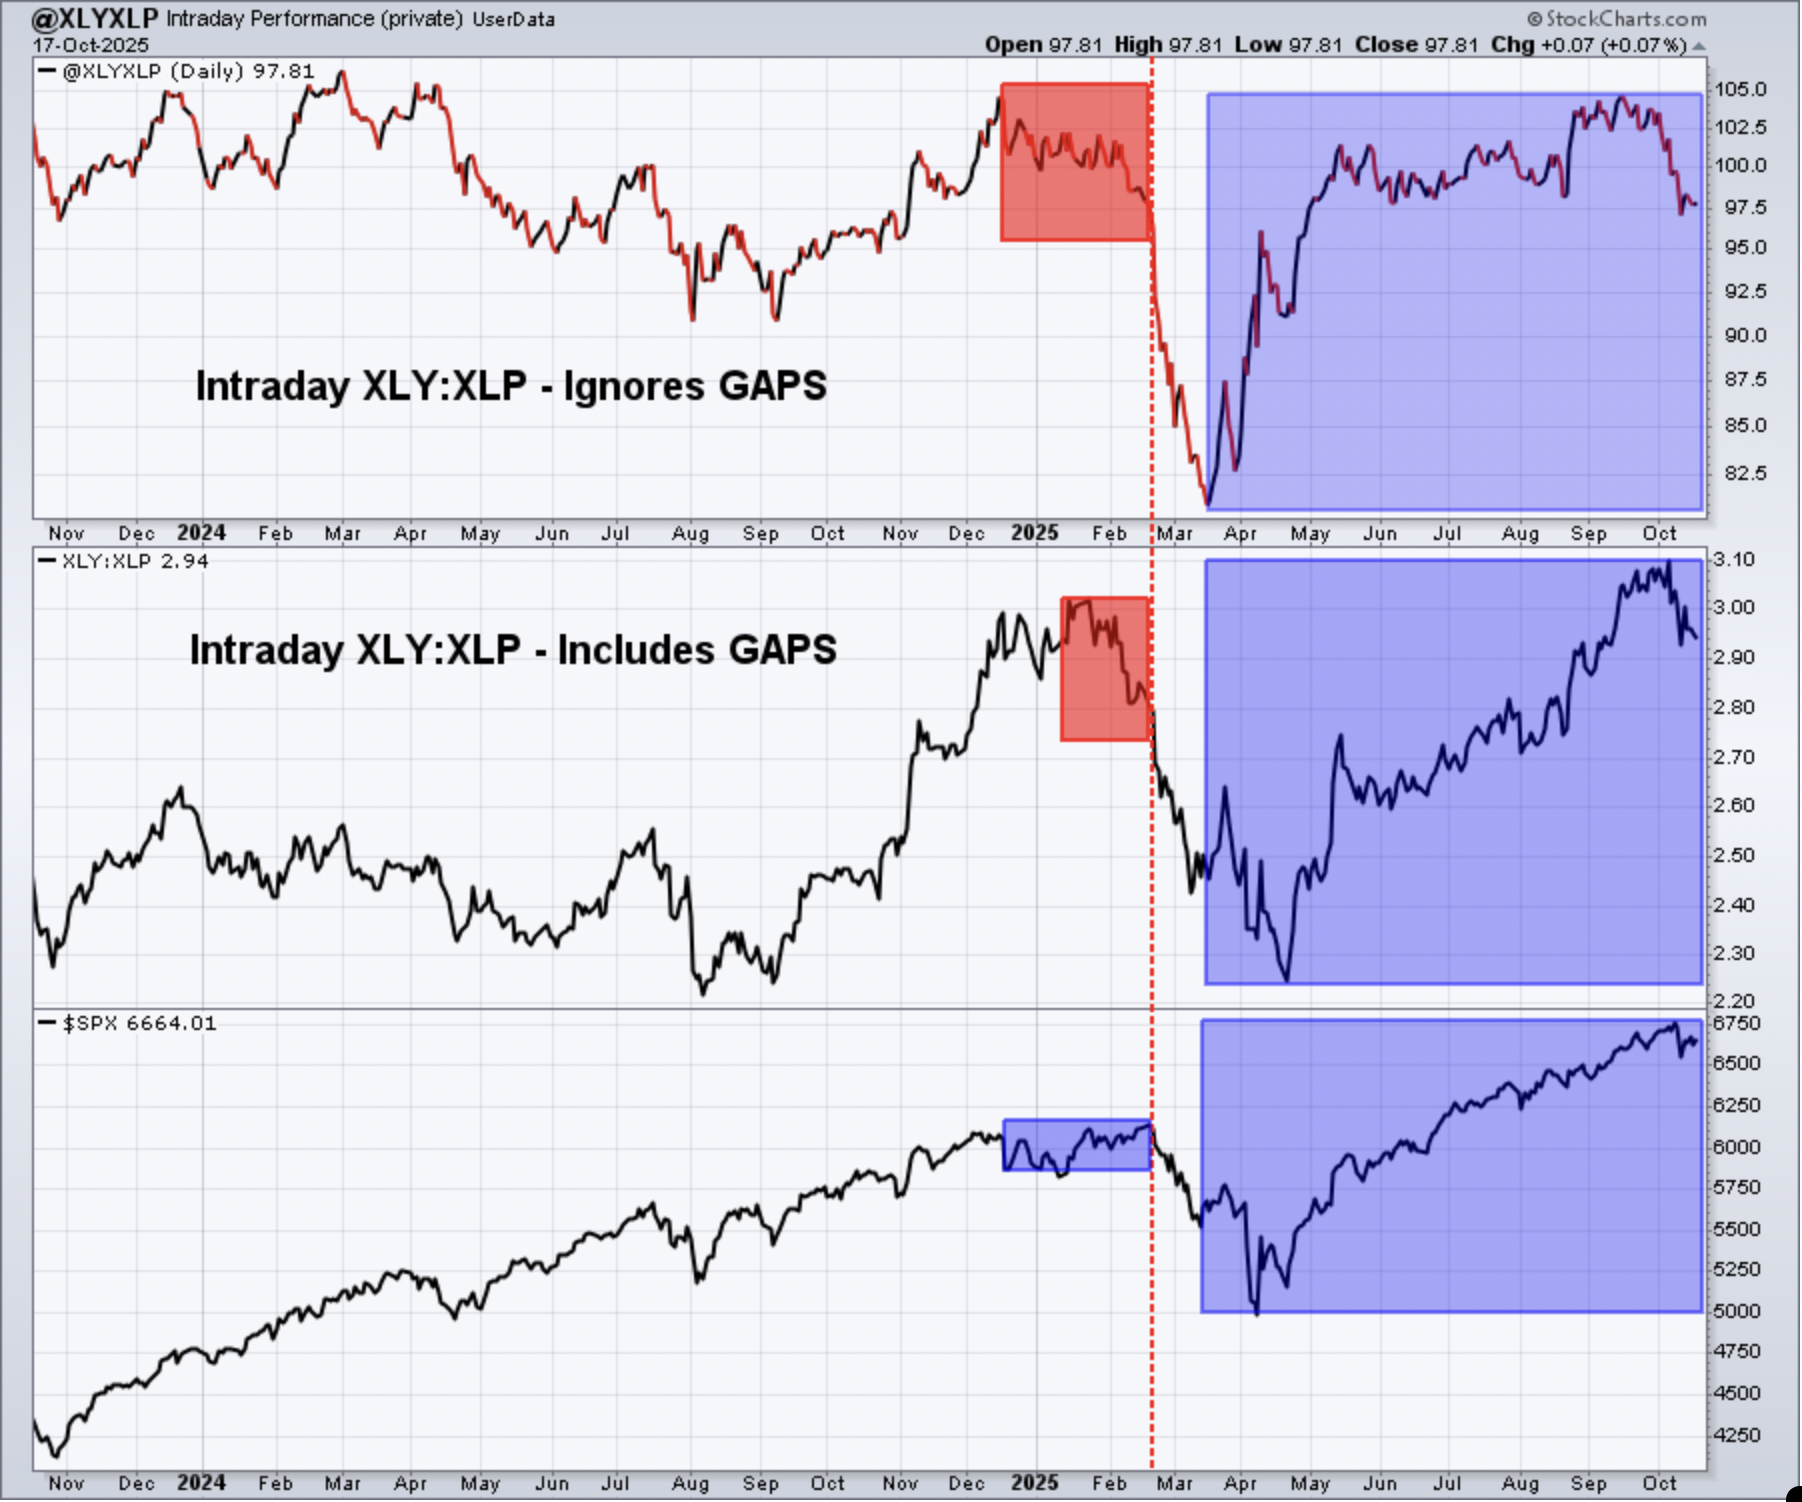
I will repeat what I said last week...
"The intraday XLY vs. XLP ratio panel at the top is definitely something to keep an eye on. It's been on the decline for a month and it's just reached a multi-month low. Typically, that's not a great signal and I do place a lot of importance on the health of consumer stocks. Nearly all of my key growth vs. value ratios, however, are strong and were strong at the most recent price high on the S&P 500. That has rarely happened at key market tops. Accordingly, I'm viewing any short-term selling as a buying opportunity for what I believe will be a strong end to 2025."
Sentiment
5-day SMA ($CPCE)
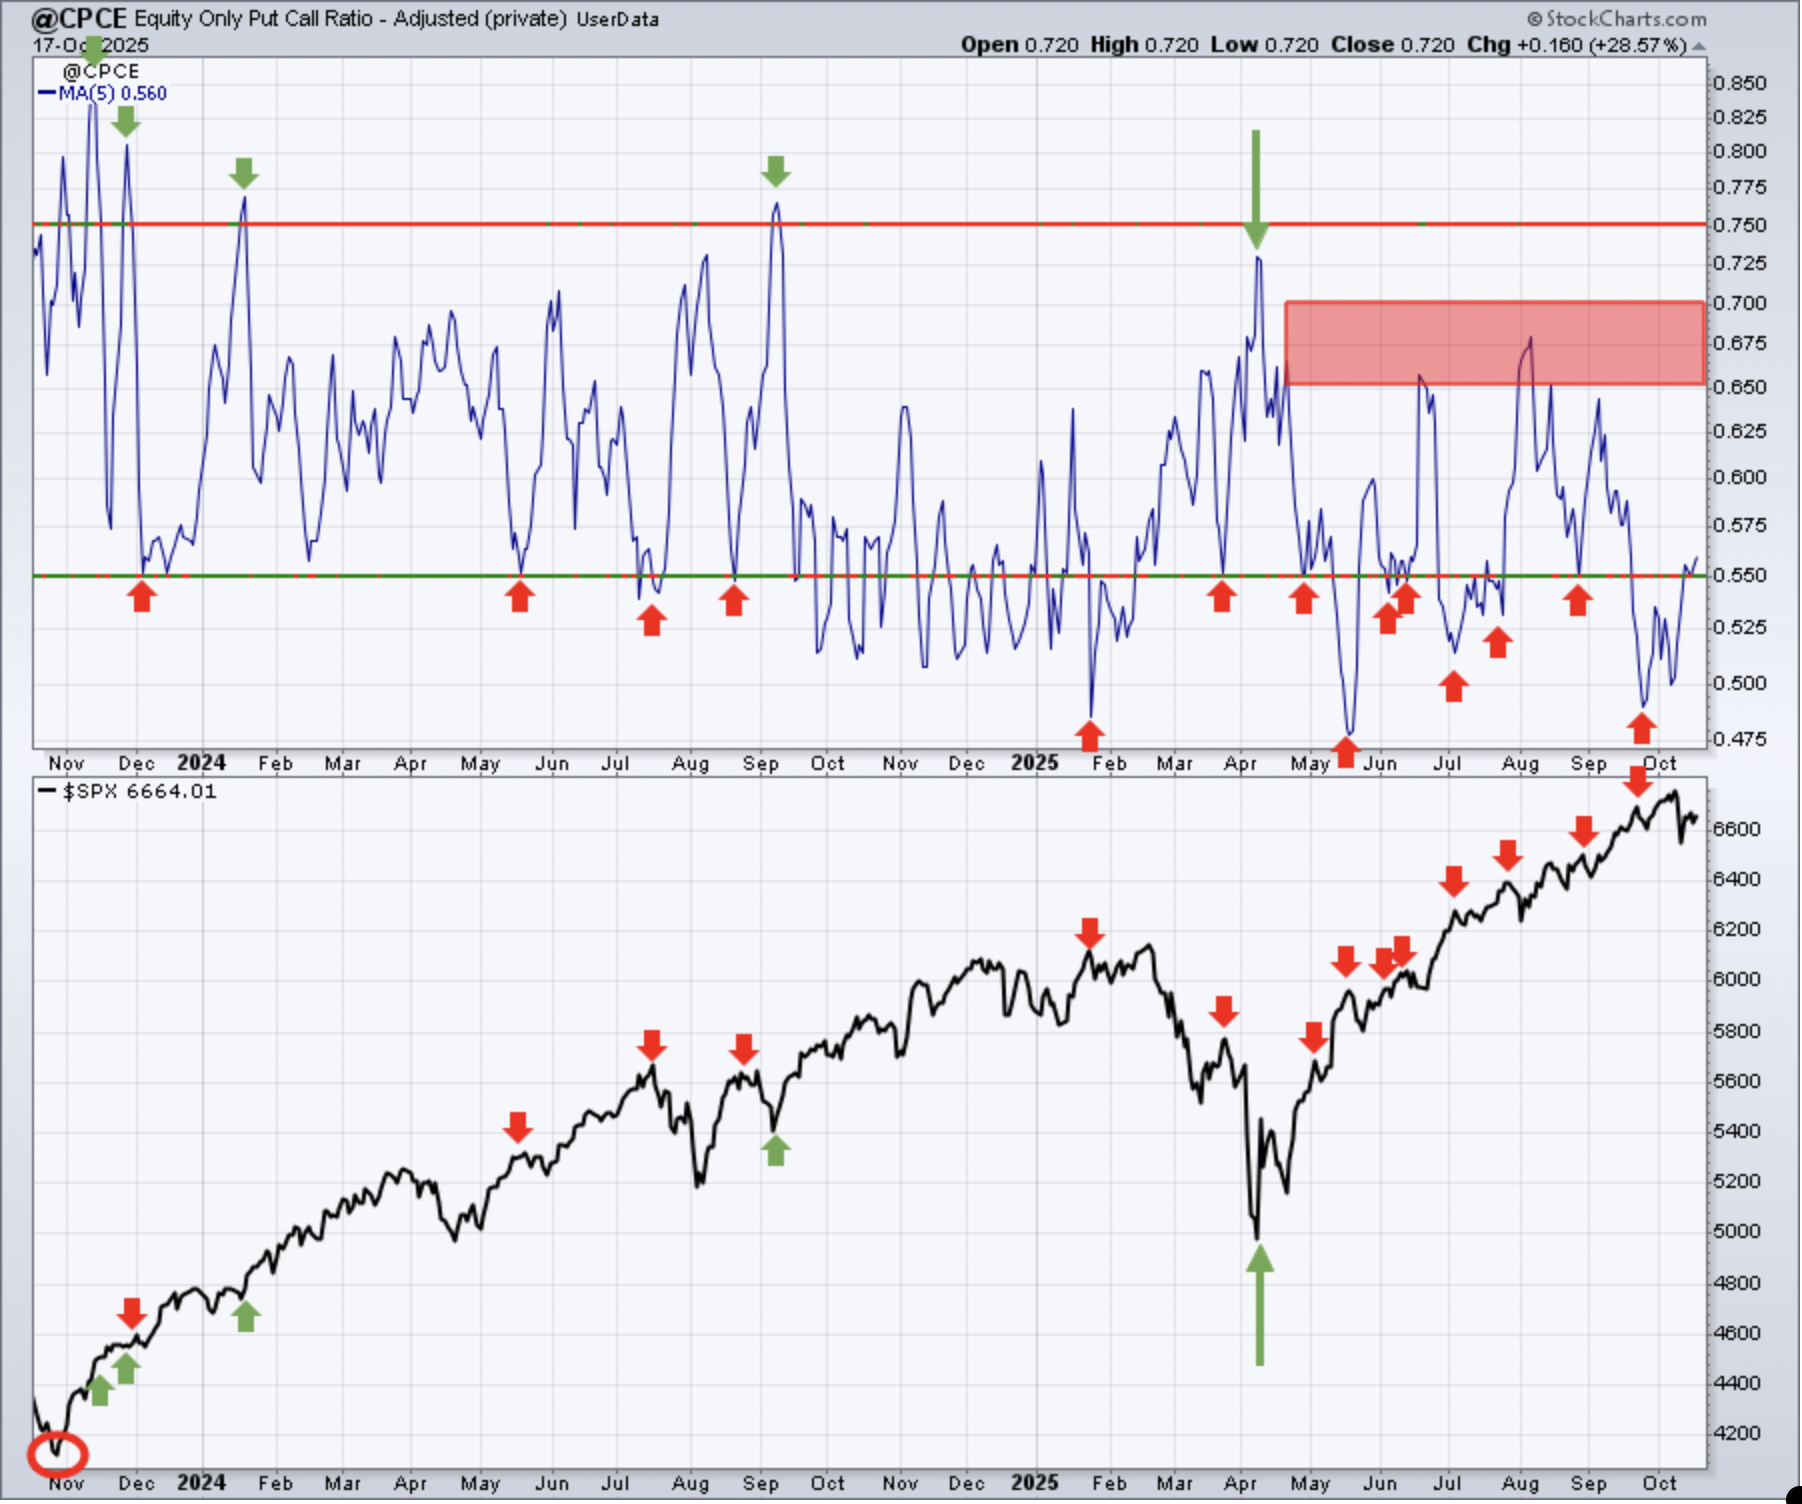
Sentiment indicators are contrarian indicators. When they show extreme bullishness, we need to be a bit cautious and when they show extreme pessimism, it could be time to become much more aggressive. Major market bottoms are carved out when pessimism is at its absolute highest level.
Keep in mind that the above 5-day SMA reading of the CPCE is our "speed boat" sentiment indicator that changes quite frequently. This 5-day SMA has moved back above 0.55 and into "neutral" territory. I've included a red-shaded area in the 0.65-0.70 area, where we've seen recent tops in the 5-day CPCE. Should the selling escalate and we move into the "C" phase of an ABC correction, an increase in the 5-day SMA of the CPCE to this 0.65-0.70 range could mark a significant market bottom.
253-day SMA ($CPCE)
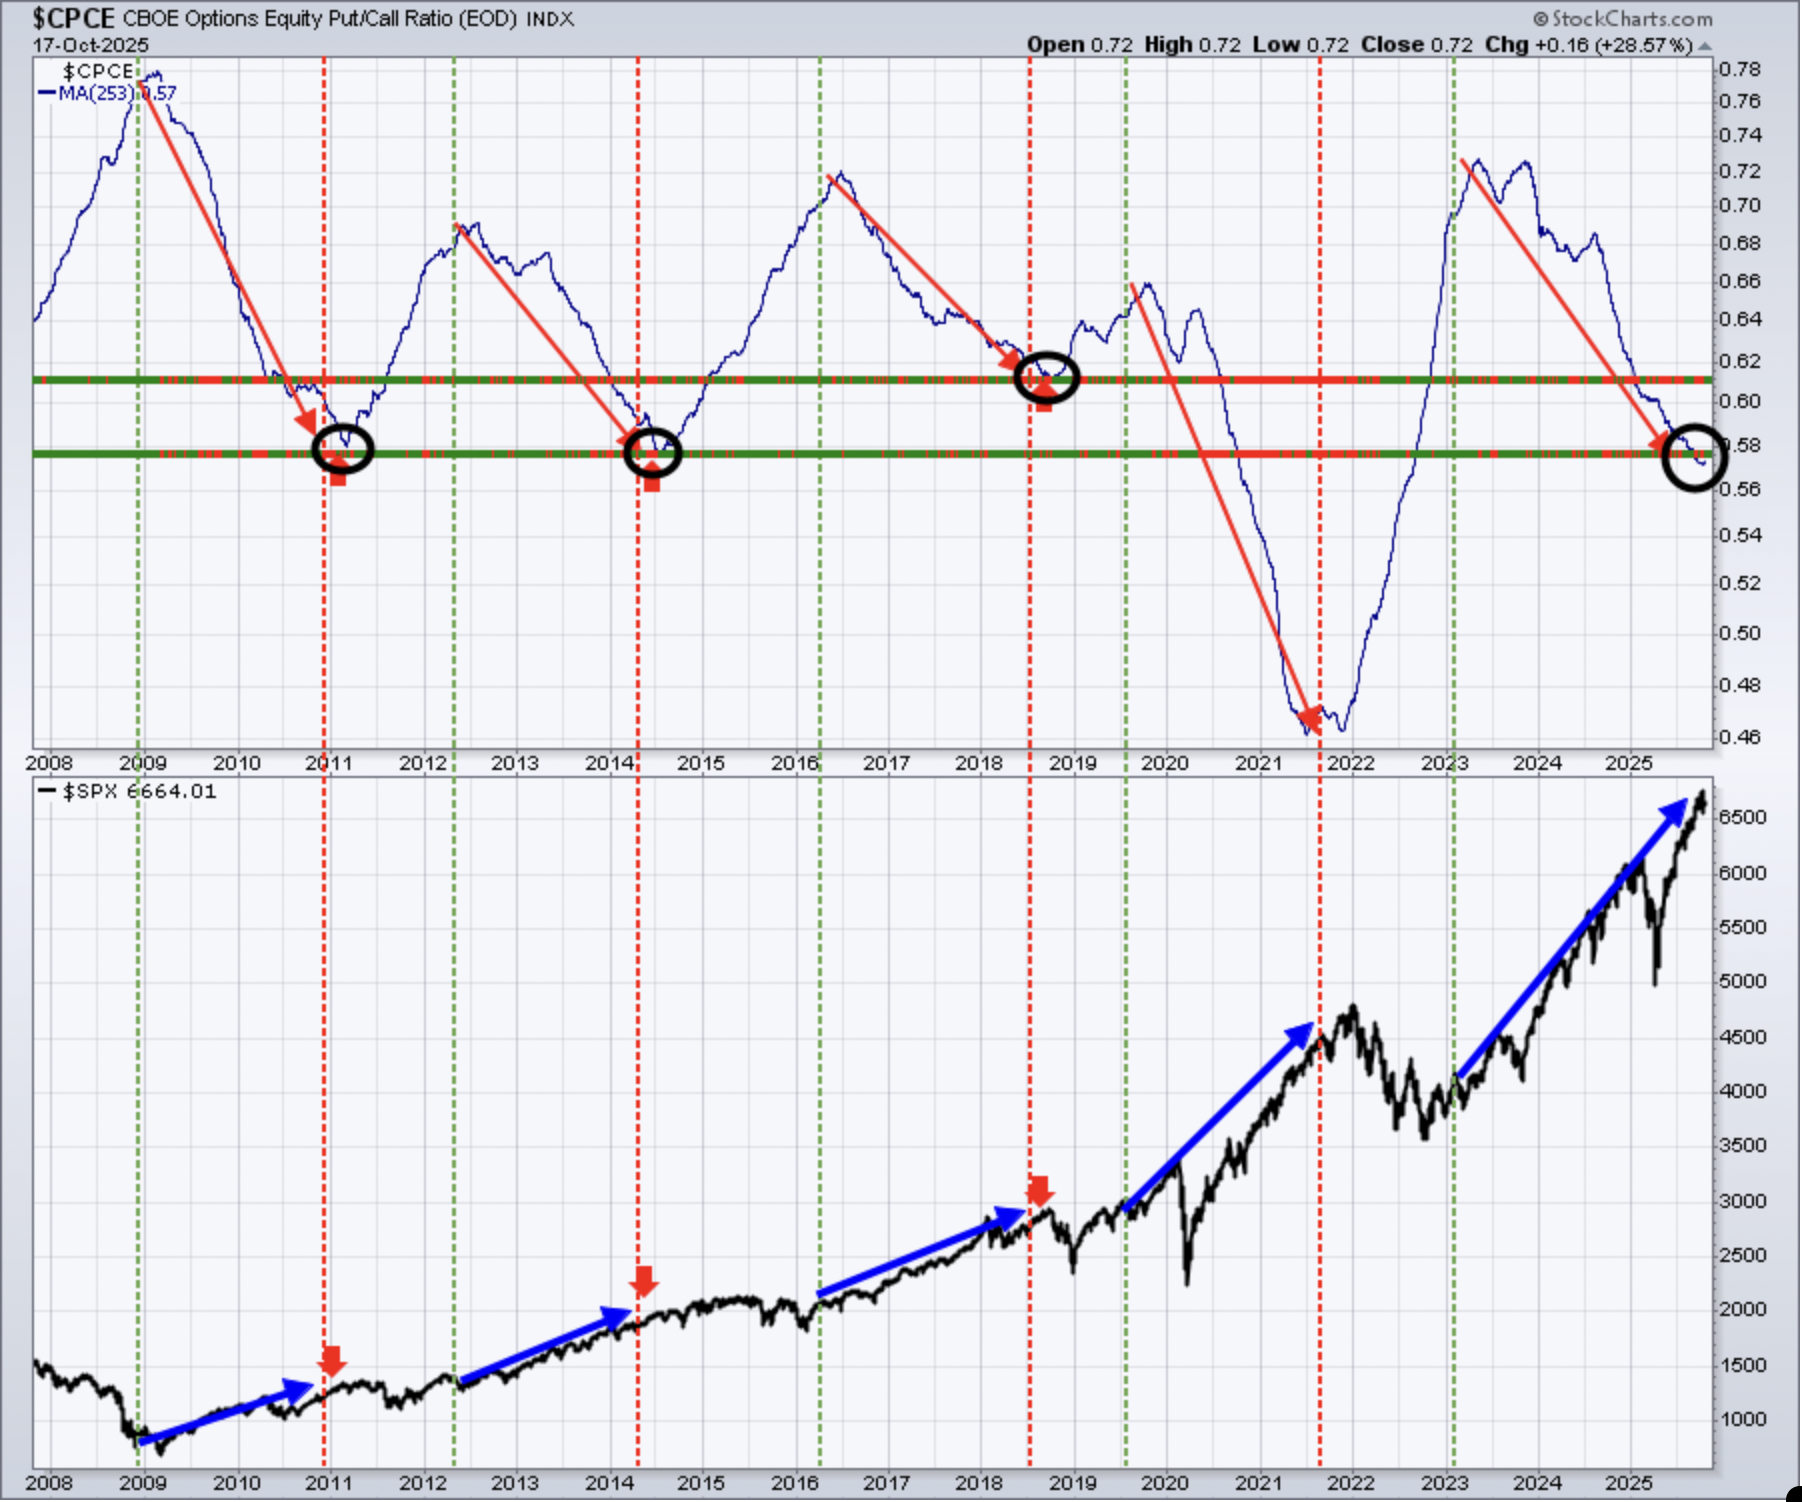
This longer-term 253-day SMA of the CPCE is our "ocean-liner" signal, unlike our short-term speedboat indicator. This one usually provides us a very solid long-term signal as the overall market environment moves from one of pessimism to complacency and vice versa. No changes here. The overall downtrend appears to be intact and this is a bullish signal into year end, in my opinion.
Long-Term Trade Setup
Since beginning this Weekly Market Report in September 2023, I've discussed the long-term trade candidates below that I really like. Generally, these stocks have excellent long-term track records, and many pay nice dividends that mostly grow every year. Only in specific cases (exceptions) would I consider a long-term entry into a stock that has a poor or limited long-term track record and/or pays no dividends. I try to review the long-term picture once a month or so. Below is a quick recap of how these stocks looked two weeks ago and as Q3 earnings season really kicks into gear:
- JPM – very strong advance heading into earnings next week
- BA – recent pullback to test rising 20-month EMA
- FFIV – steady push higher has been relentless
- MA – mostly consolidating in 2025, but remains comfortably above 20-month EMA
- GS – very strong uptrend, nearly tripling over last 20 months
- FDX – pushing back above its 20-month EMA, encouraging
- AAPL – monthly RSI test of 50 provided excellent buying opportunity
- CHRW – trending up since breakout above 110
- JBHT – monthly RSI in 40s, typically solid entry point for the long-term
- STX - buyers everywhere since the long-term breakout in May
- HSY – trending up now above 20-month EMA, needs to break above 200
- DIS – still needs breakout above 125, while looking for 20-month EMA support
- MSCI – lengthy sideways consolidation spanning most of past 2-3 years
- SBUX - another in a lengthy consolidation period, needs to hold 70 on selling
- KRE – breakout above 68-70 would likely spur much more buying, looks good
- ED – multiple successful tests of rising 20-month EMA
- AJG – looking to renew its long-term uptrend after 20-month EMA test
- NSC – breakout and all-time high now measures to 380
- RHI – appears headed to major price support test in 28-30 area
- ADM – trending higher, a push above 65 completely reverses downtrend
- BG – keeps testing its 20-month EMA from underneath, needs to clear
- CVS – move up to near 80 this month very positive development
- IPG – support in 22.00-22.50 range has held thus far
- HRL - moving below 25 not a good look, needs reversal now
- DE – love this 20-month EMA test after breaking out to all-time high
Keep in mind that our Weekly Market Reports favor those who are more interested in the long-term market picture. Therefore, the list of stocks above are stocks that we believe are safer (but nothing is ever 100% safe) to own with the long-term in mind. Nearly everything else we do at EarningsBeats.com favors short-term momentum trading, so I wanted to explain what we're doing with this list and why it's different.
Also, please keep in mind that I'm not a Registered Investment Advisor (and neither is EarningsBeats.com nor any of its employees) and am only providing (mostly) what I believe to be solid dividend-paying stocks for the long term. Companies periodically go through adjustments, new competition, restructuring, management changes, etc. that can have detrimental long-term impacts. Neither the stock price nor the dividend is ever guaranteed. I simply point out interesting stock candidates for longer-term investors. Do your own due diligence and please consult with your financial advisor before making any purchases or sales of securities.
Looking Ahead
Upcoming Earnings
The following list of companies is NOT a list of all companies scheduled to report quarterly earnings, however, just key reports, so please be sure to check for earnings dates of any companies that you own. Any company in BOLD represents a stock in one of our portfolios and the amount in parenthesis represents the market capitalization of each company listed:
- Monday: None
- Tuesday: NFLX ($503 billion), GE (318 billion), KO ($291 billion), TXN ($160 billion)
- Wednesday: TSLA ($1.4 trillion), IBM ($256 billion), LRCX ($180 billion), GEV ($164 billion)
- Thursday: TMUS ($255 billion), INTC ($161 billion), UNP ($133 billion), HON ($129 billion)
- Friday: PG ($350 billion), SNY ($123 billion), HCA ($98 billion), GD ($89 billion)
Key Economic Reports
- Monday: September leading indicators
- Tuesday: None
- Wednesday: None
- Thursday: Initial jobless claims, September existing home sales
- Friday: September consumer price index, October PMI services, October PMI manufacturing, October consumer sentiment, September new home sales
Given the current government shutdown, the above reports will not be released unless the shutdown ends.
Historical Data
I'm a true stock market historian. I am absolutely PASSIONATE about studying stock market history to provide us more clues about likely stock market direction and potential sectors/industries/stocks to trade. While I don't use history as a primary indicator, I'm always very aware of it as a secondary indicator. I love it when history lines up with my technical signals, providing me with much more confidence to make particular trades.
Below you'll find the next two weeks of historical data and tendencies across the three key indices that I follow most closely. The percentage for each calendar day represents the annualized return for that day. An example of how this is calculated is reflected next to the first day under the S&P 500 and in parenthesis:
S&P 500 (since 1950)
- Oct 20: +85.59% (Ex: cumulative gains = +17.93% over 53 trading days since 1950. +17.93% x 253/53 = +66.86%)
- Oct 21: +60.06%
- Oct 22: -89.07%
- Oct 23: -10.24%
- Oct 24: -27.03%
- Oct 25: -42.15%
- Oct 26: -60.52%
- Oct 27: -26.14%
- Oct 28: +125.55%
- Oct 29: +76.78%
- Oct 30: +57.64%
- Oct 31: +9.53%
- Nov 1: +47.70%
- Nov 2: +79.69%
NASDAQ (since 1971)
- Oct 20: +0.19%
- Oct 21: +146.14%
- Oct 22: -55.84%
- Oct 23: -47.94%
- Oct 24: -54.84%
- Oct 25: -35.55%
- Oct 26: -115.08%
- Oct 27: -73.58%
- Oct 28: +161.74%
- Oct 29: +67.54%
- Oct 30: +28.86%
- Oct 31: +76.76%
- Nov 1: +46.72%
- Nov 2: +101.17%
Russell 2000 (since 1987)
- Oct 20: +59.74%
- Oct 21: +33.82%
- Oct 22: -42.76%
- Oct 23: -46.99%
- Oct 24: -58.20%
- Oct 25: +1.75%
- Oct 26: -13.96%
- Oct 27: -132.36%
- Oct 28: +194.87%
- Oct 29: +64.49%
- Oct 30: +6.98%
- Oct 31: +128.10%
- Nov 1: +7.94%
- Nov 2: +133.34%
The S&P 500 data dates back to 1950, while the NASDAQ and Russell 2000 information date back to 1971 and 1987, respectively.
Final Thoughts
U.S. stocks rebounded pretty nicely, especially given how the prior week had ended so poorly. I was looking for the prior week Friday selling to continue into this past week, but it never really materialized. There was a gap higher on Monday morning and stocks mostly treaded water throughout the week. The government shutdown continues as market participants monitor developments. We have one more week of earnings from many conglomerates, before key growth companies take the earnings stage the following week. Netflix (NFLX) and Tesla (TSLA) will report this week and likely impact the direction of stocks.
Here are a few things I'm thinking about as we move deeper into earnings season:
Interest Rates. Don't look now, but on Thursday, the 10-year treasury yield ($TNX) fell below and closed below 4.00% for the first time since April and only the second time in the past year. This is NOT the behavior we should expect IF inflation remained a problem. The story of this chart is to completely ignore any inflation rhetoric and concentrate much more on the state of the economy. Thus far, growth stocks continue to hold up, which could mean NIRVANA for U.S. stocks later this year as the fed funds rate plunges.
Earnings. Most earnings last week came in better than expected. Reactions to those earnings were a different story for many stocks, however. In particular, bank stocks ($DJUSBK) struggled to make any headway after what appeared to be solid results.
Banks. Well Fargo (WFC, +7.29%) and Bank of America (BAC, +5.41%) were notable winners among banks after reporting quarterly results, but others didn't fare so well. For instance, both PNC Financial (PNC, -1.58%) and JP Morgan (JPM, -1.11%) lost ground after their quarterly reports. Regional banks (KRE, -1.86%) had a very strong start to the week, but tumbled on Wednesday and Thursday, costing the group a chance to really kick things into gear prior to a boatload of regional banks' earnings reports out the next couple weeks.
Technical Conditions. I mentioned last week that I wouldn't be surprised to see some sort of A-B-C consolidation period for our major indices. Nothing happened last week to change my mind. I still think a real possibility exists for stocks to take out key closing support from Friday, October 10th. If that happens, we'd likely be starting another leg lower and printing the "C" in the ABC correction.
Seasonality. The worst week of the year historically starts on Tuesday, October 21st at the close and extends until the following Monday, October 27th at the close. The good news, however, is that we typically see excellent performance from U.S. stocks at the conclusion of this upcoming seasonal bearish period.
Happy trading!
Tom