
EB Weekly Market Report - Monday, November 3, 2025
ChartLists/Spreadsheets
The following ChartLists/Spreadsheets were updated over the weekend:
- Strong Earnings (SECL)
- Strong Future Earnings (SFECL)
- Raised Guidance (RGCL)
- Bullish Trifecta (BTCL)
- Leading Stock (LSCL)
- Seasonality - November (SEASCL)
- Hot Stocks (HTCL) - same 20 stocks so no new ChartList this week
- Key Manipulation Spreadsheet
The above ChartLists and spreadsheet have been updated on our website, except for the Seasonality ChartList, which should be completed later today. The Hot Stocks ChartList (HTCL) is a fairly new ChartList at EarningsBeats.com. It was created by our very own Matt Townsend, who employs a number of momentum strategies in identifying what he believes are 20 very hot momentum stocks. His strategy is to hold onto these stocks as long as the momentum remains. You can read more about this relatively new feature under "ChartLists" on our website.
Weekly Market Recap
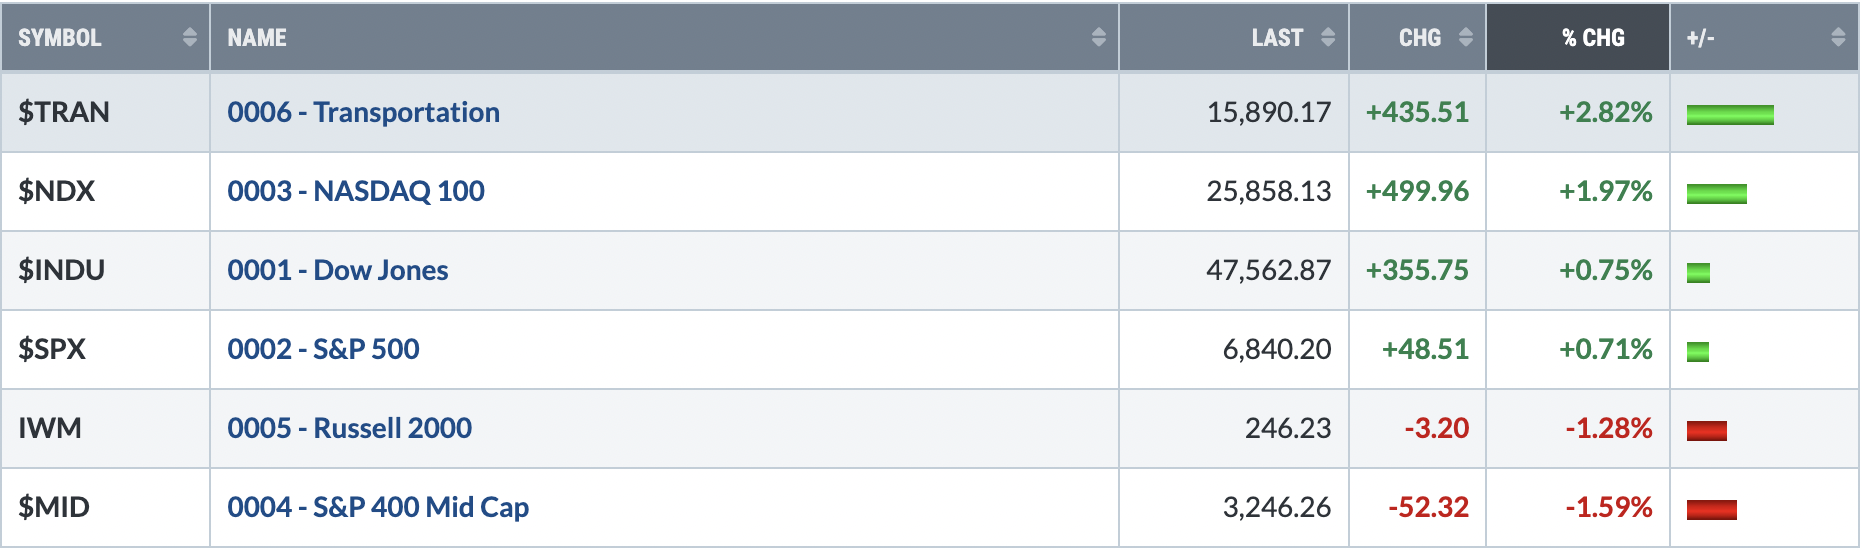
Major Indices
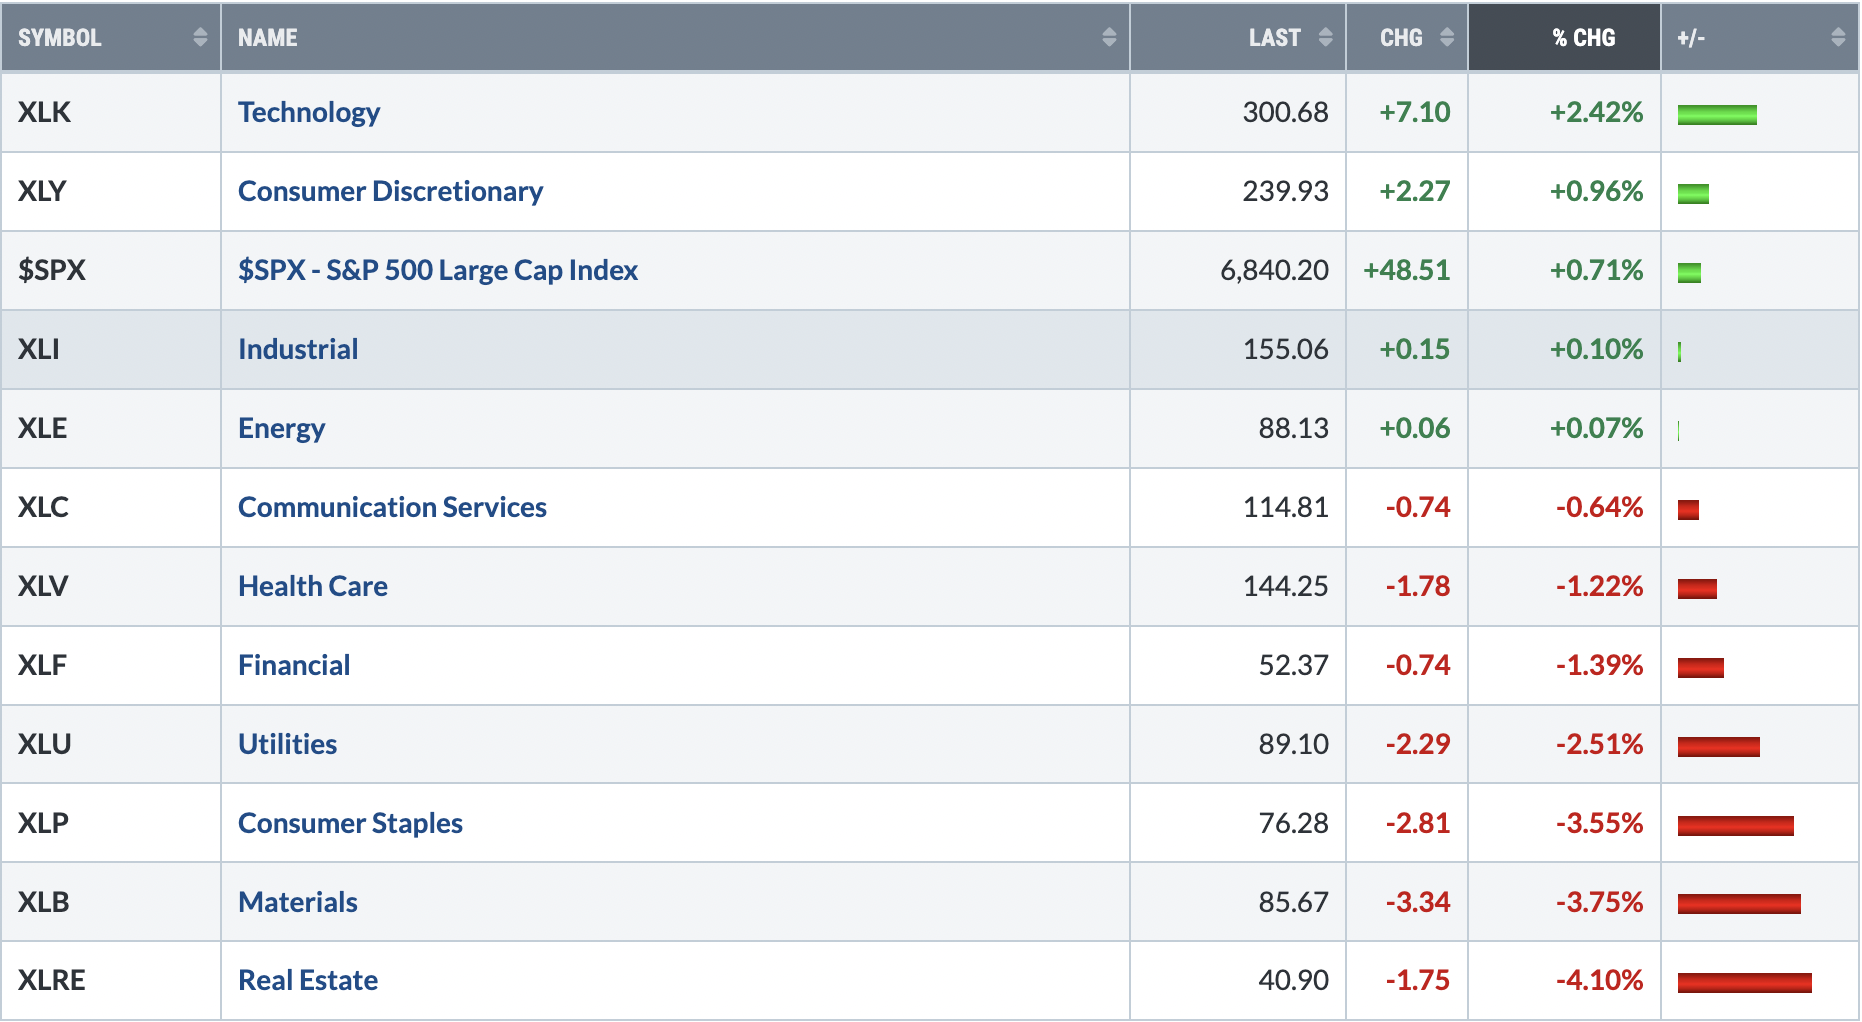
Sectors
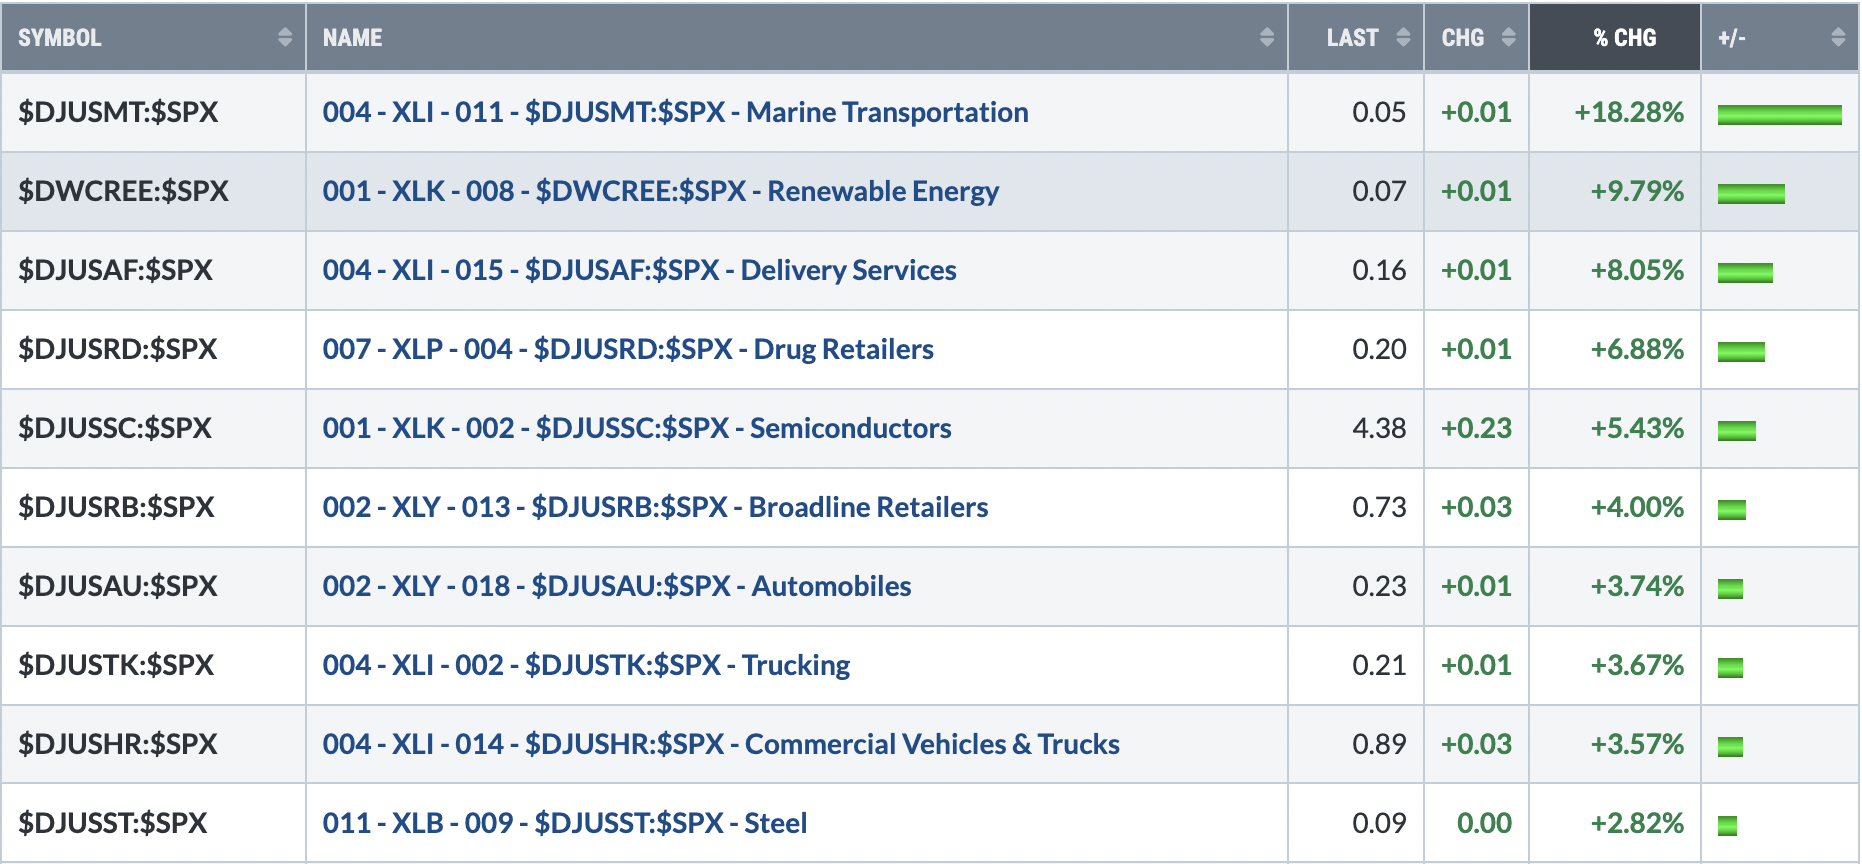
Top 10 Industries Last Week
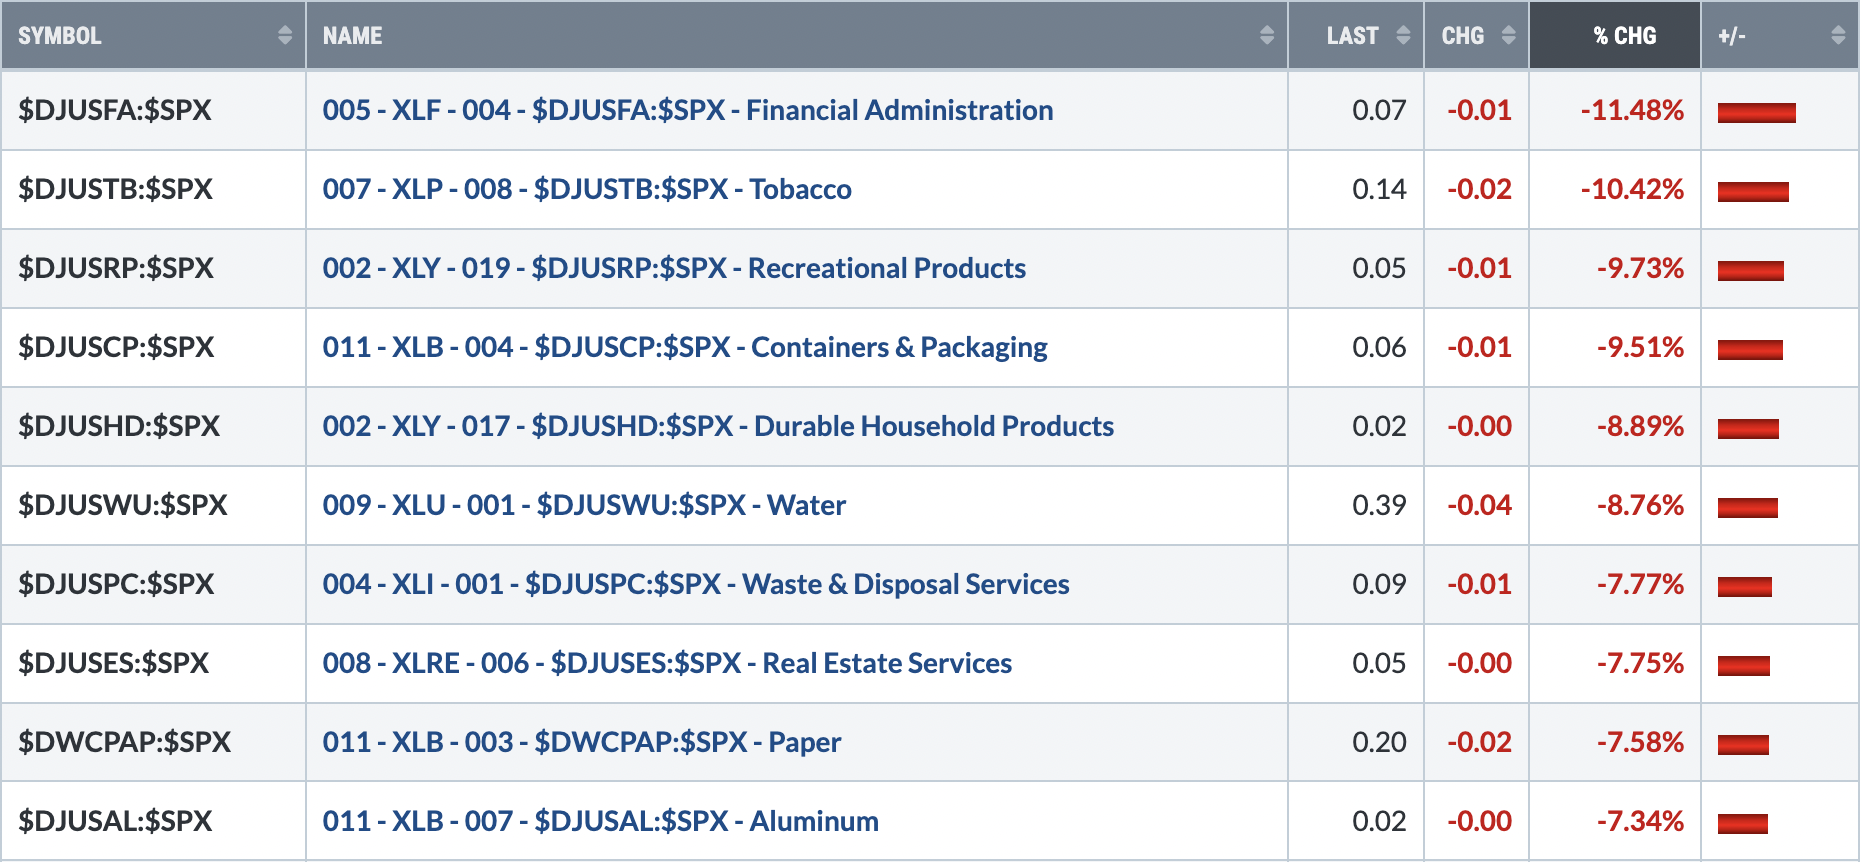
Bottom 10 Industries Last Week
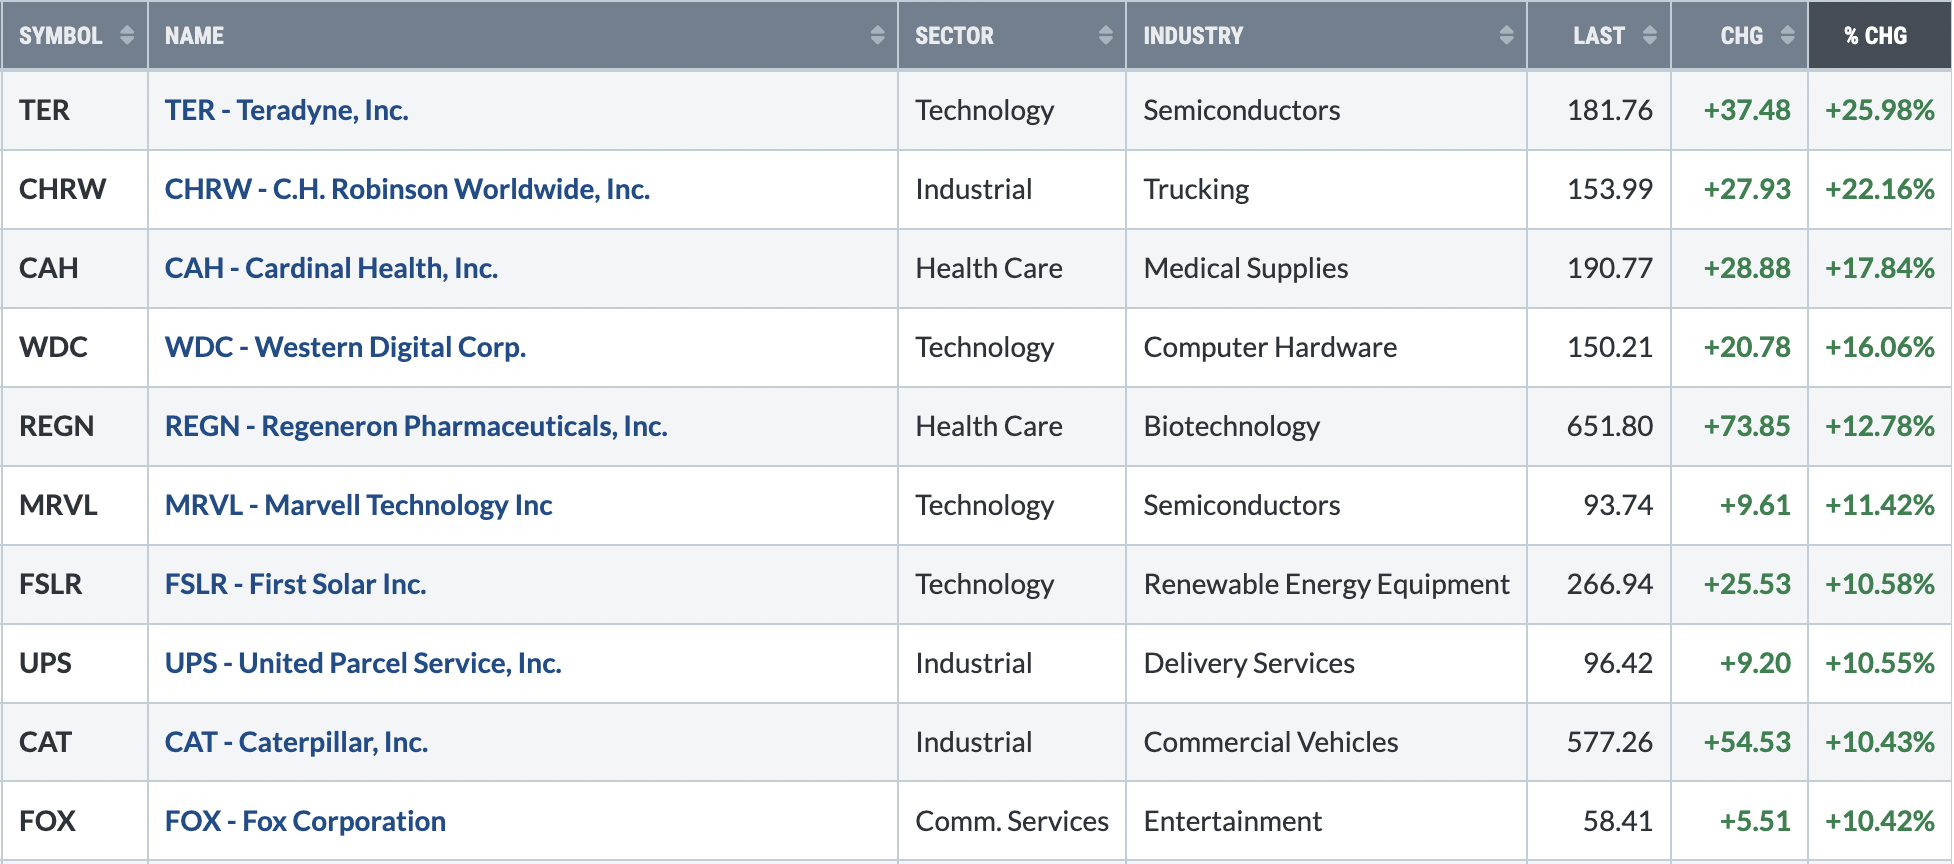
Top 10 Stocks - S&P 500/NASDAQ 100
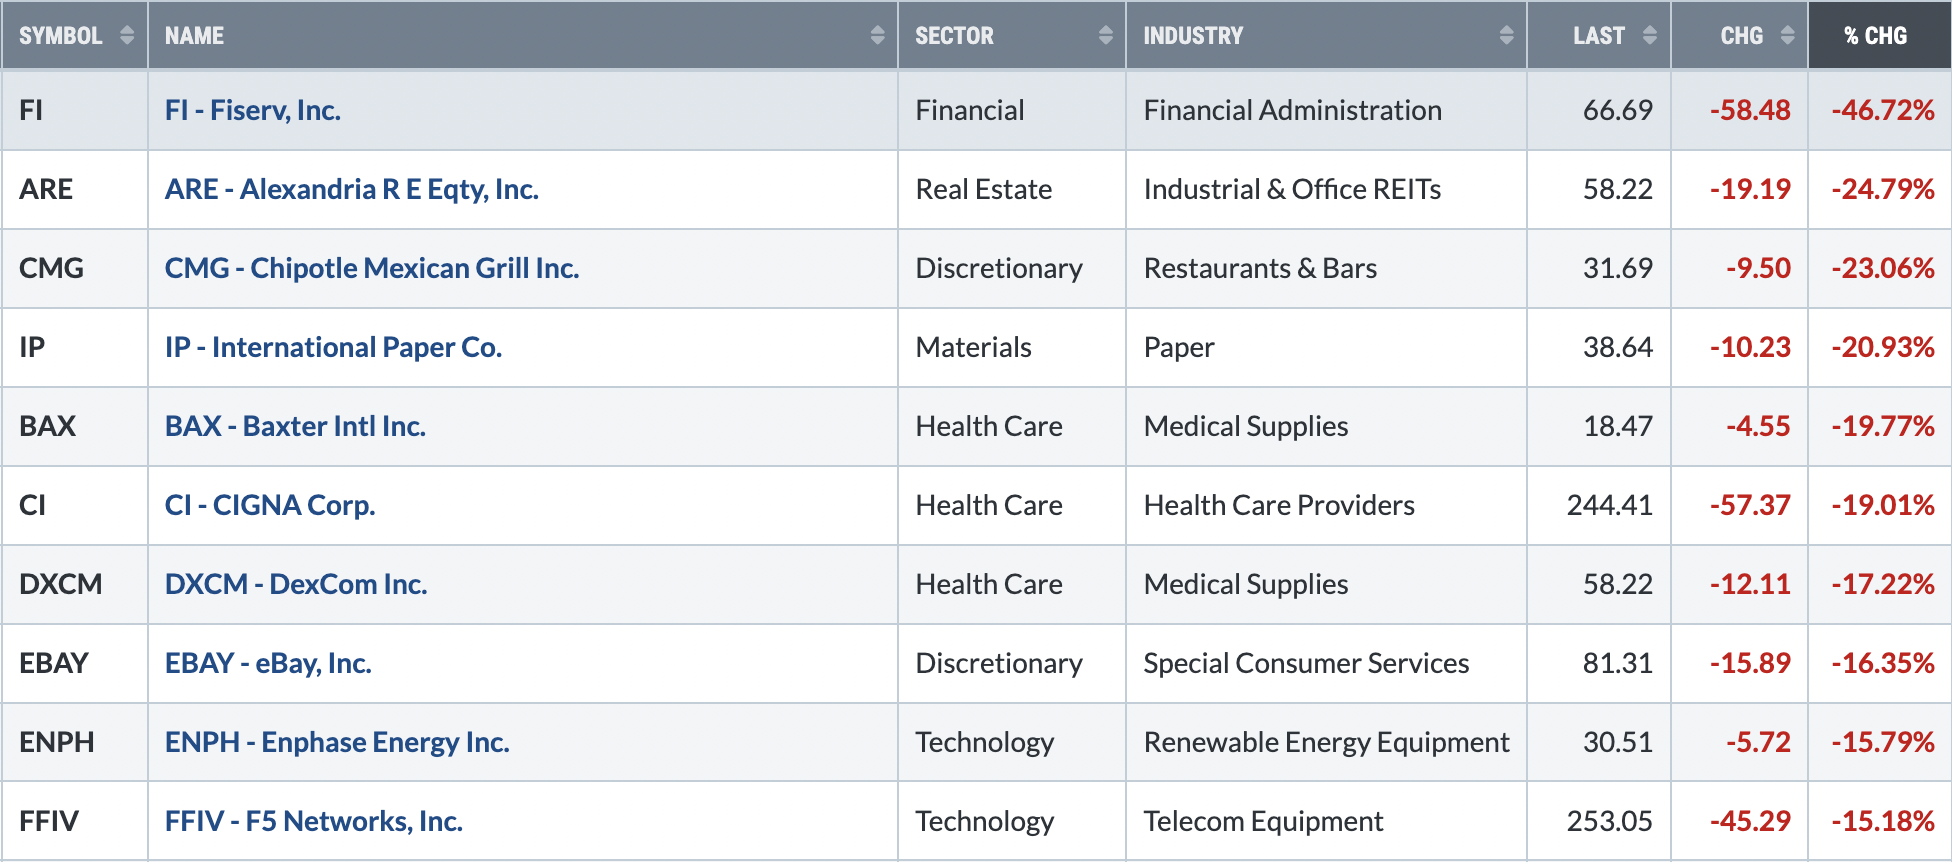
Bottom 10 Stocks - S&P 500/NASDAQ 100
Big Picture
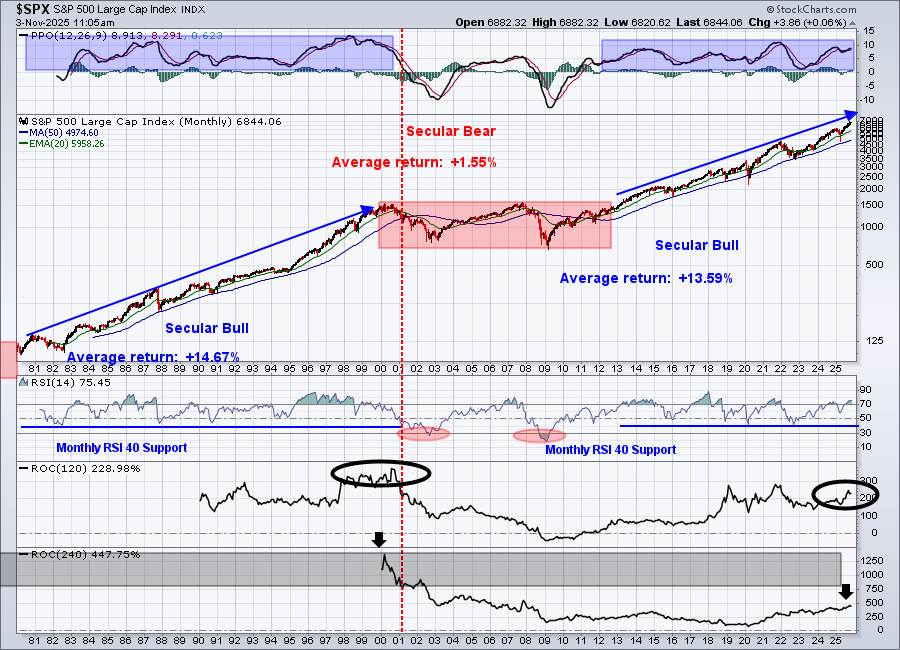
There's been so much noise in 2025, but you'd never know it from this long-term monthly chart. That's its simplicity and beauty. It helps us to ignore all the media negativity and short-term market maker manipulation and focus on the trend, which remains higher.
Sustainability Ratios
Here's the latest look at our key intraday ratios as we follow where the money is traveling on an INTRADAY basis (ignoring gaps):
QQQ:SPY
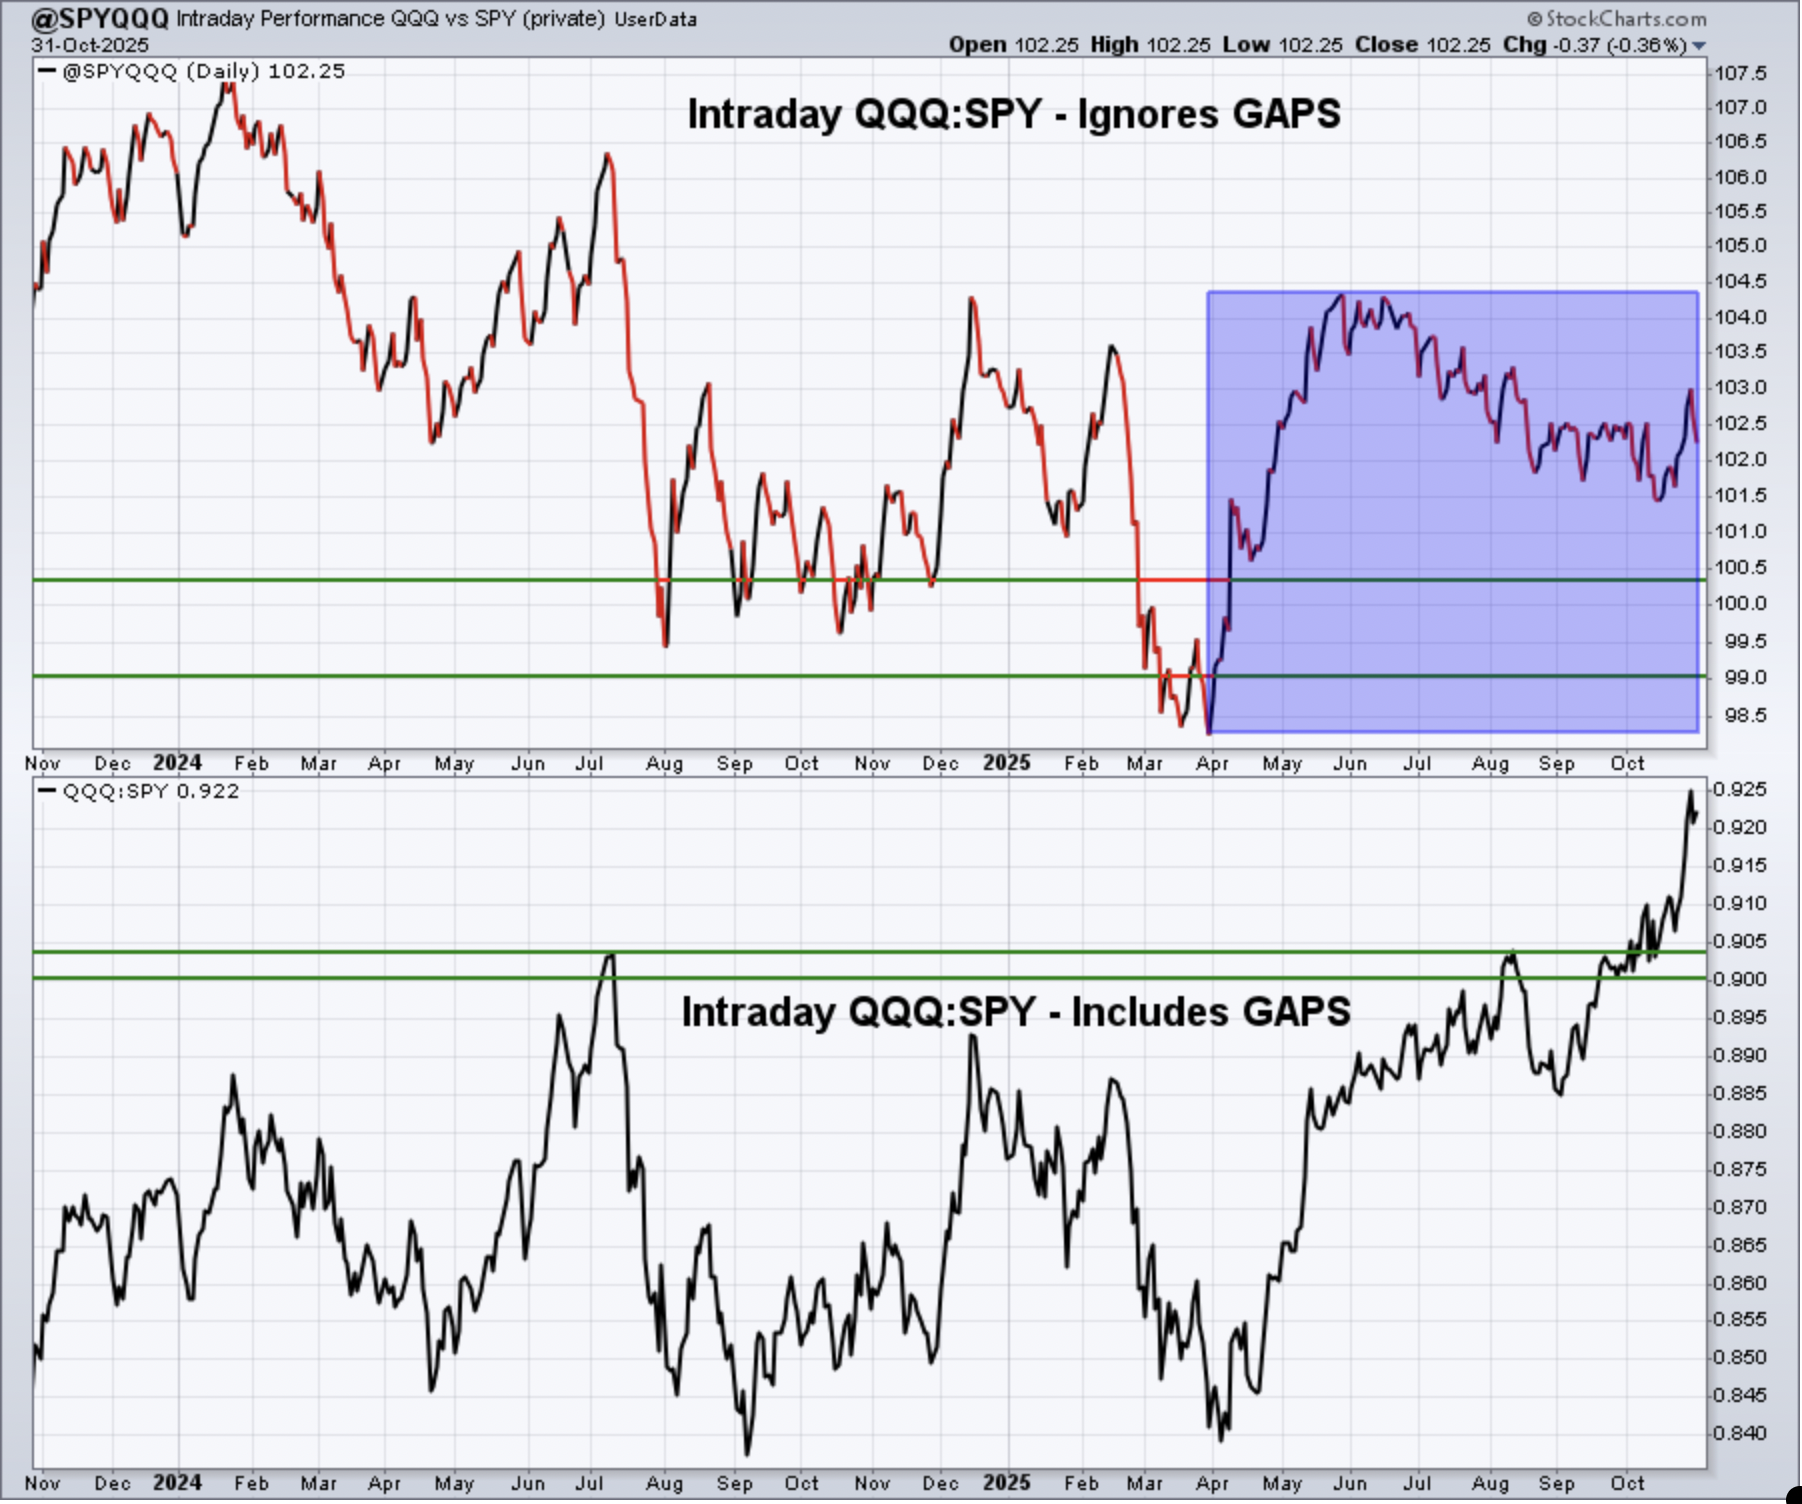
It's always difficult to bet against a market that's rising with rising sustainability ratios. That's the case right now as the bottom half of the chart above shows this ratio screaming higher to new highs.
IWM:QQQ
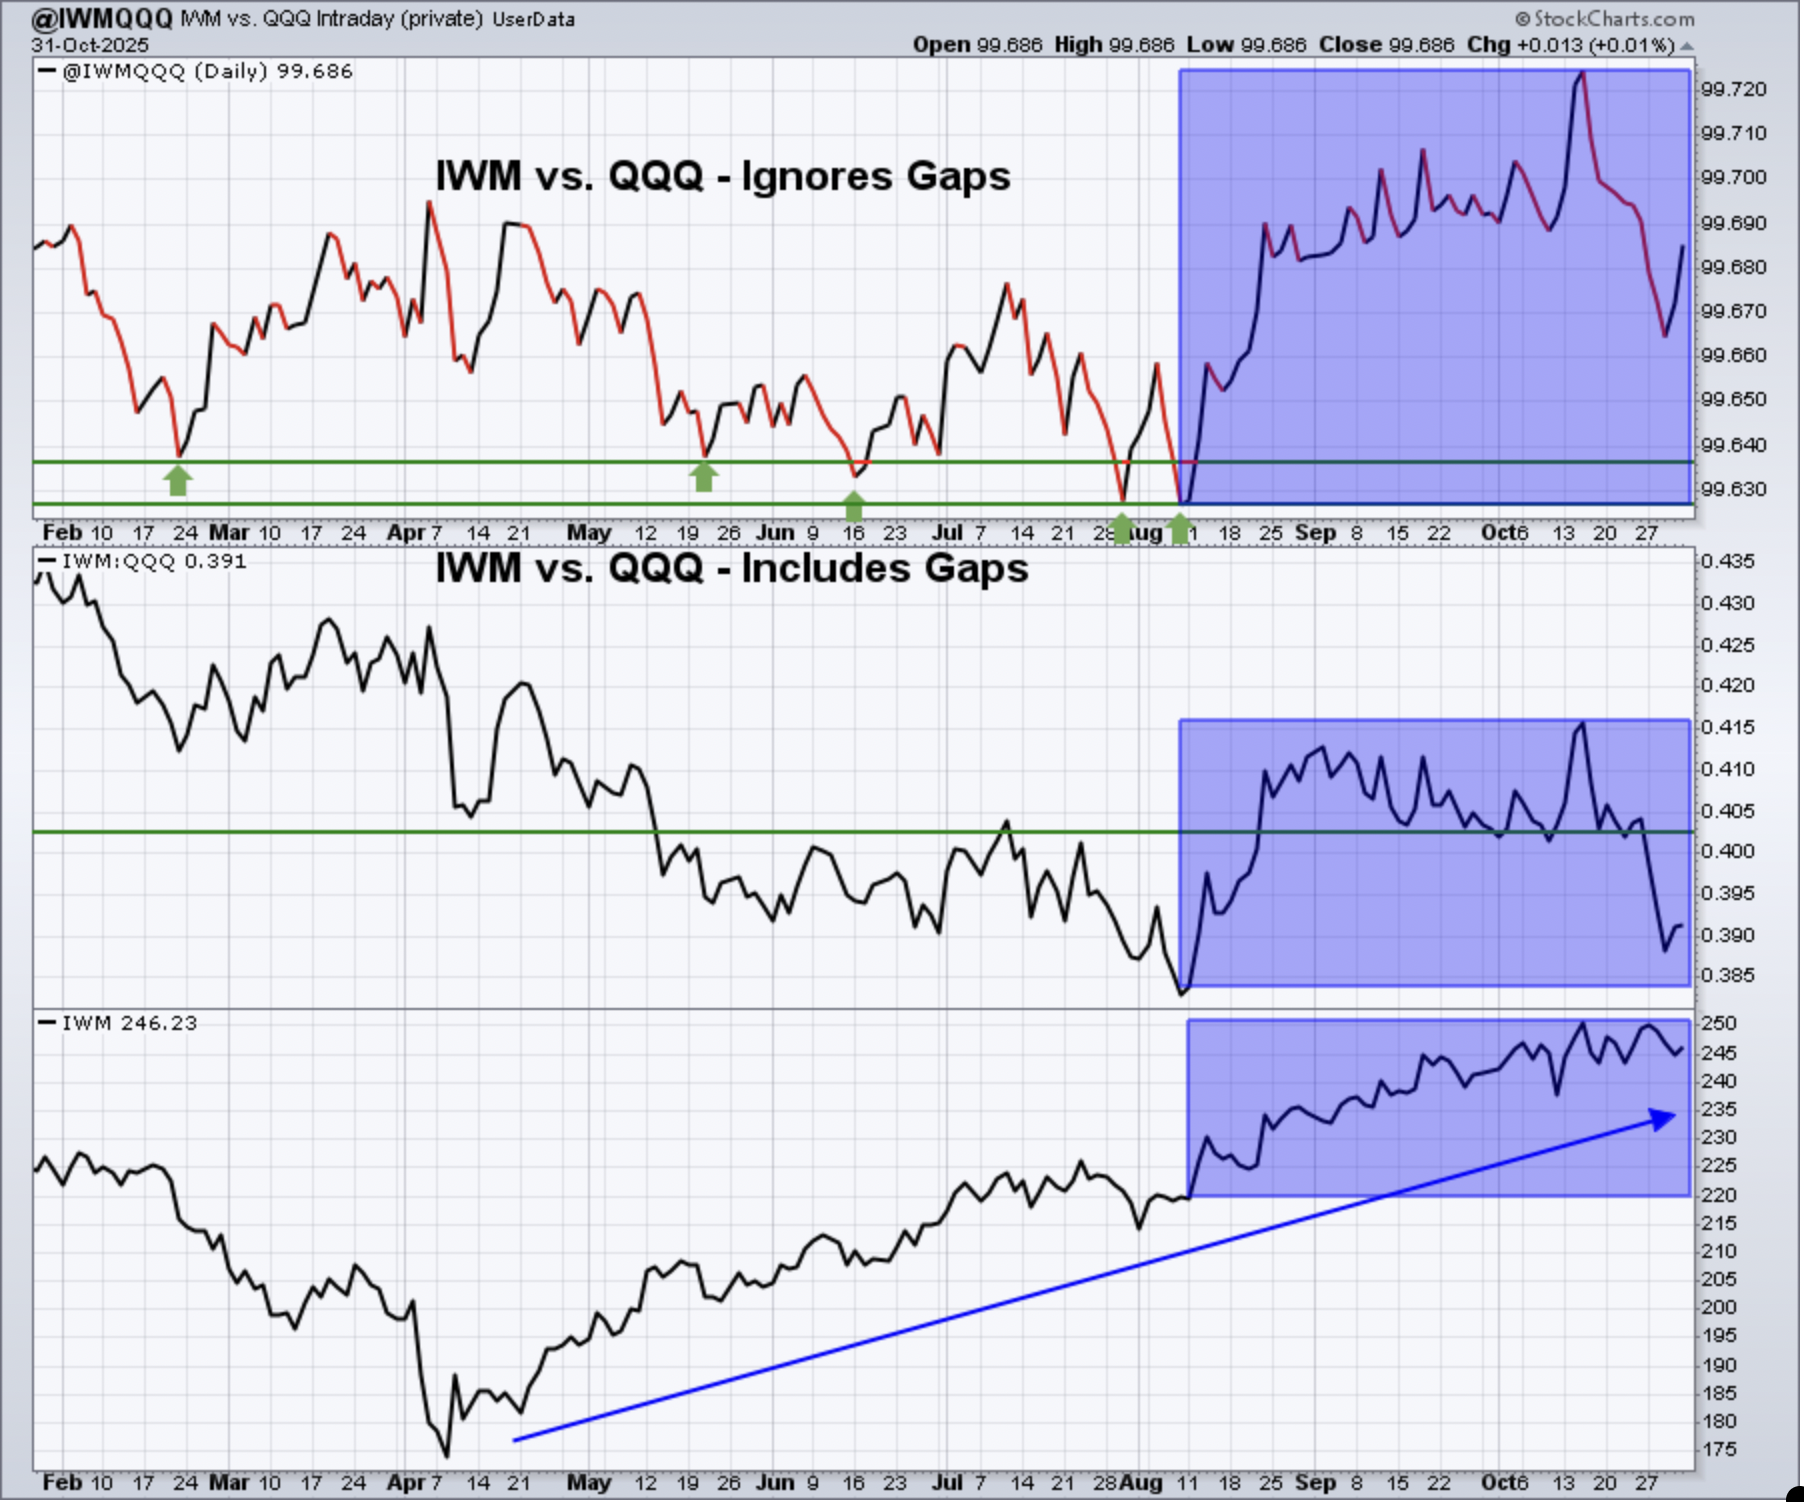
There continue to be gaps higher - primarily in the growth-focused NASDAQ 100 index. Those gaps are also affecting the IWM vs. QQQ when we include those gaps. If we ignore the gaps and concentrate solely on intraday rotation, the IWM is performing fairly well. We saw a drop early in the week, but the intraday action supported small caps later in the week.
XLY:XLP
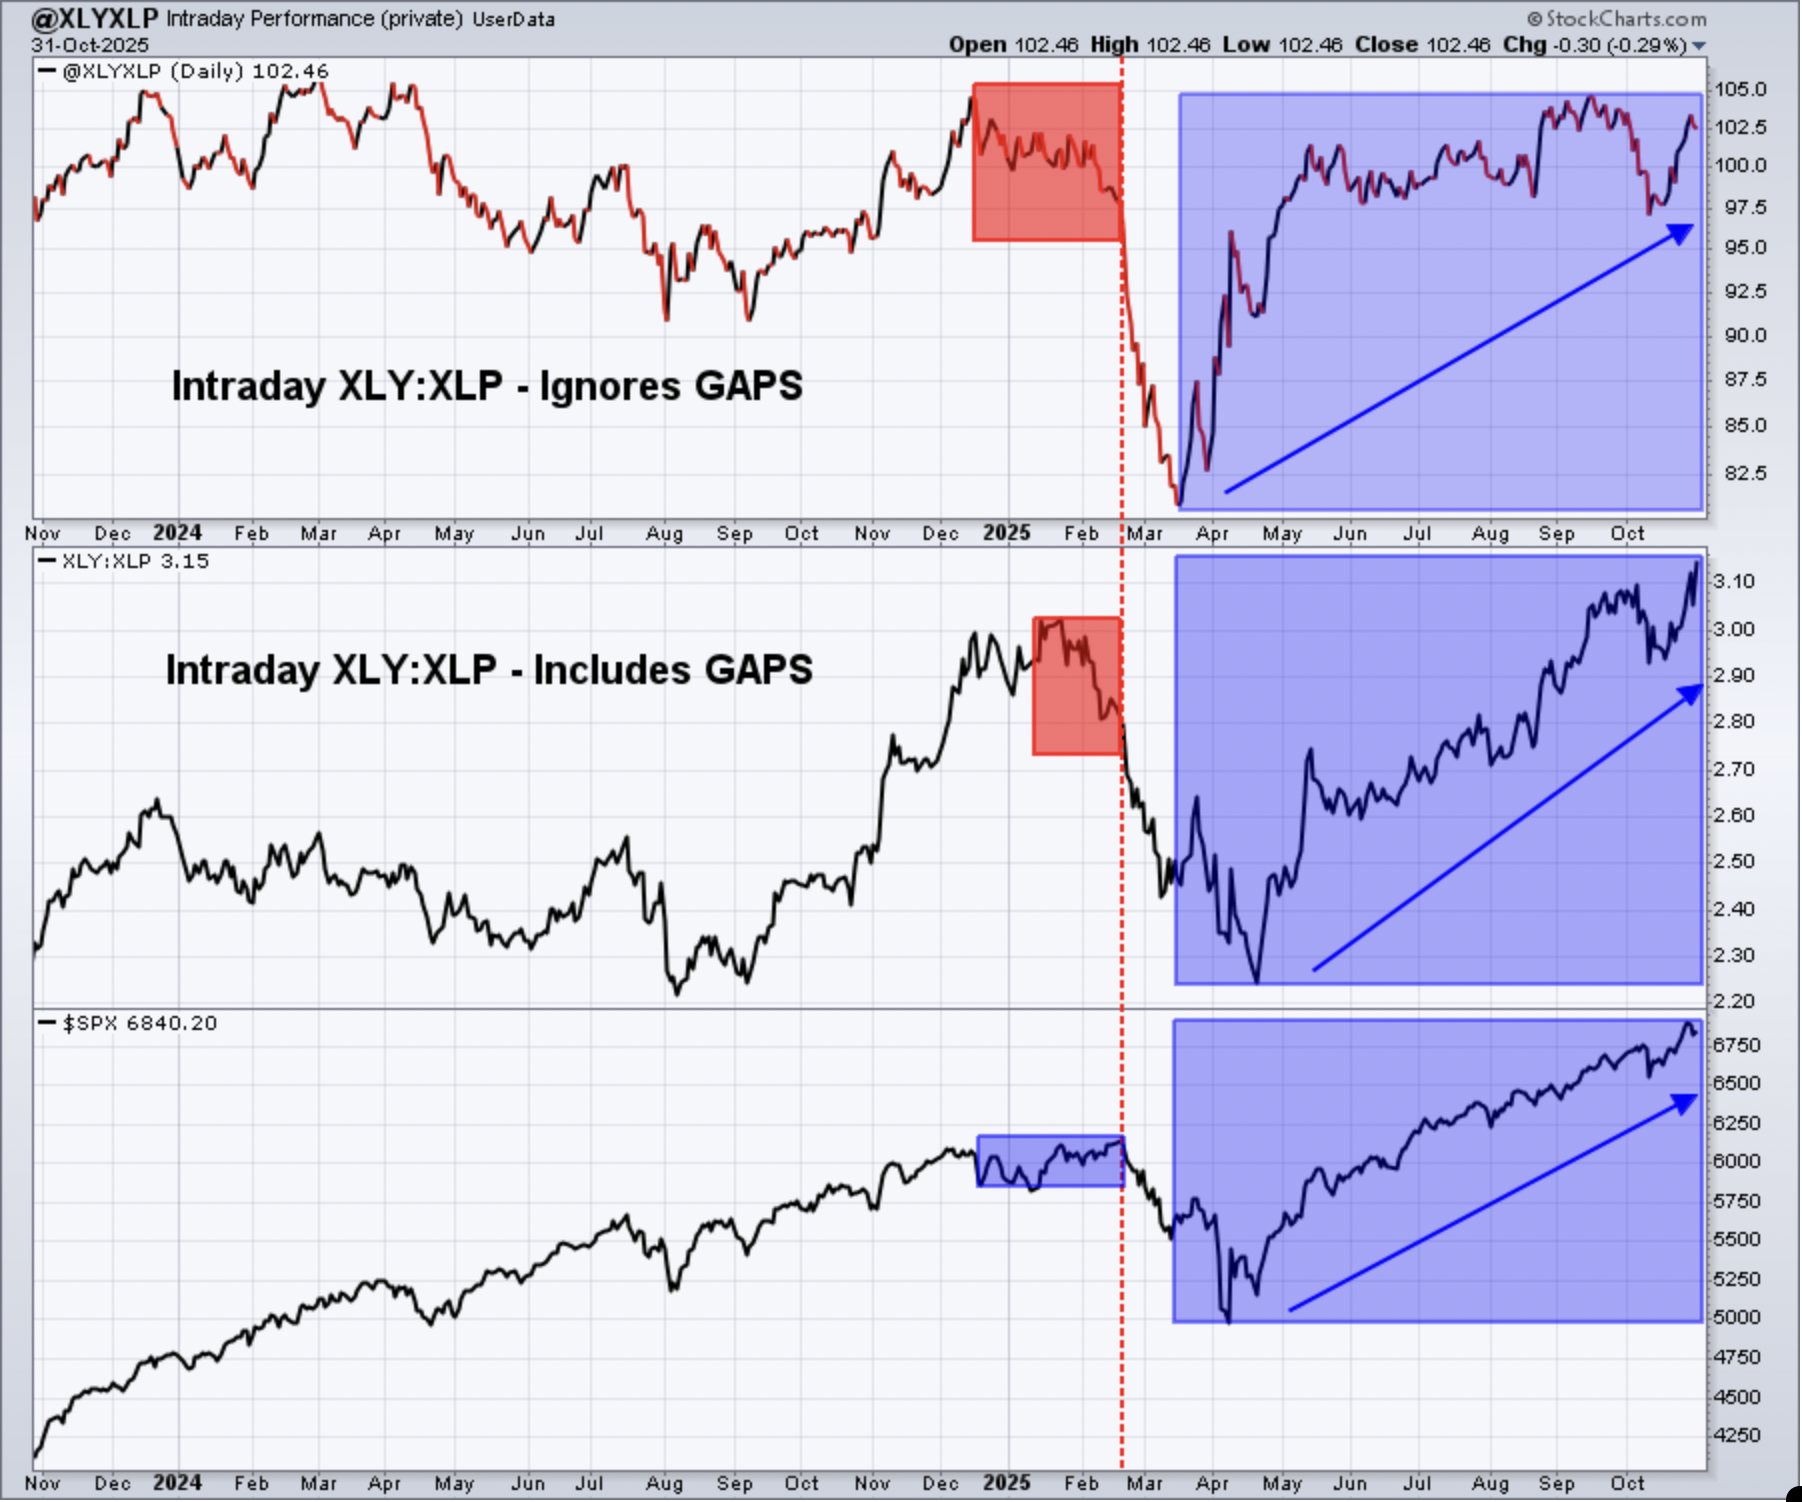
It was a very strong week in consumer discretionary (XLY) vs. its staples counterpart (XLP). Nothing gives me a better, more bullish feeling about U.S. equities than watching money rotate into discretionary areas and supporting an advance in the S&P 500.
Sentiment
5-day SMA ($CPCE)
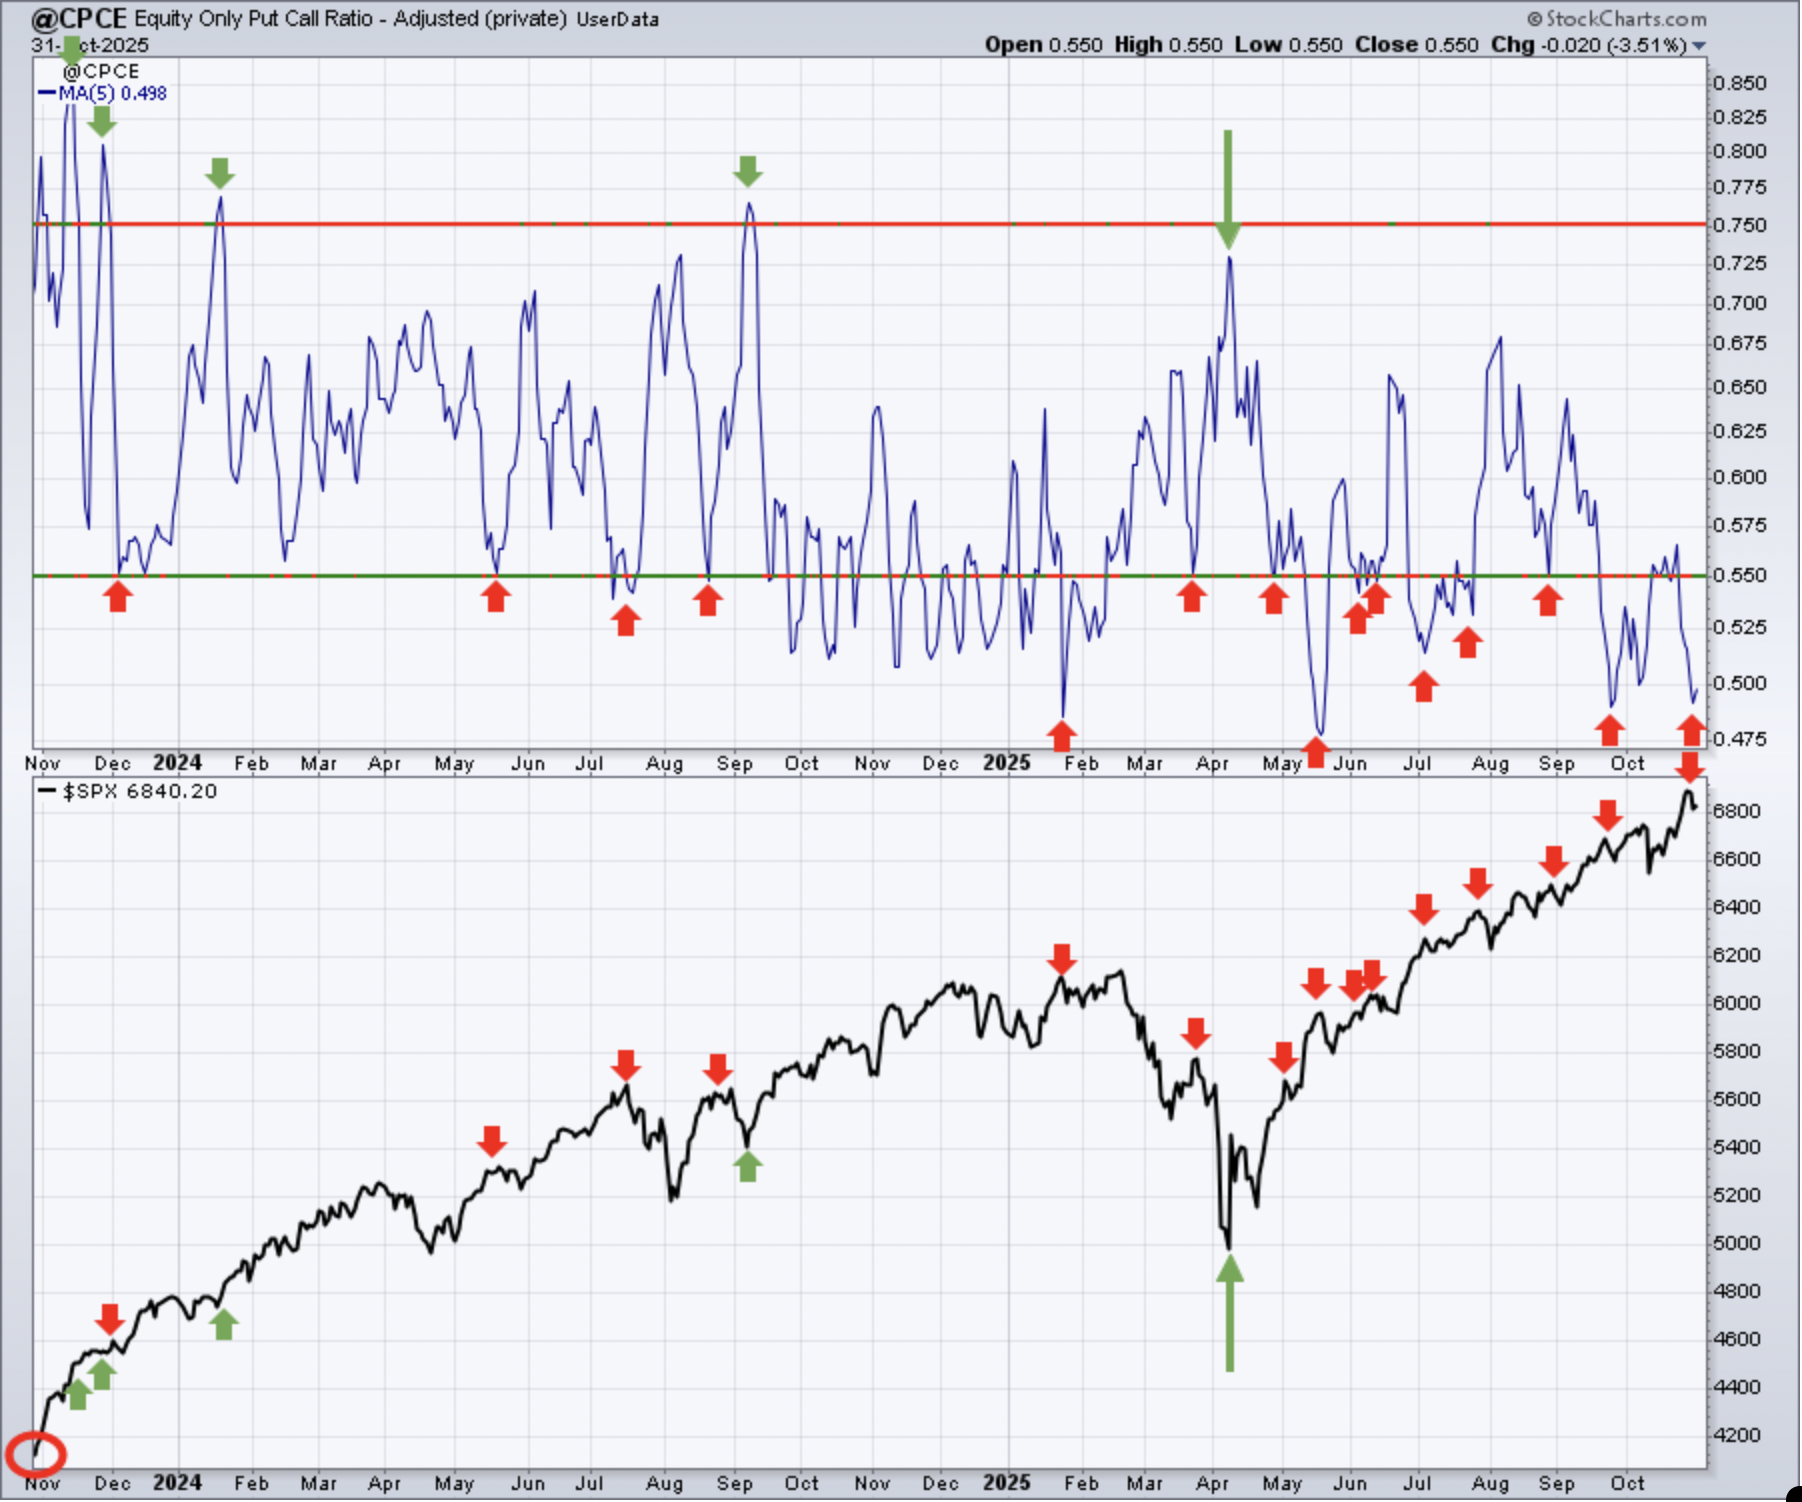
Sentiment indicators are contrarian indicators. When they show extreme bullishness, we need to be a bit cautious and when they show extreme pessimism, it could be time to become much more aggressive. Major market bottoms are carved out when pessimism is at its absolute highest level.
Keep in mind that the above 5-day SMA reading of the CPCE is our "speed boat" sentiment indicator that changes quite frequently. Complacency remains an issue, but it's a secondary issue. The only time I'd consider using sentiment as an equivalent to price action is when pessimism is extreme and we're seeing capitulation. We have the exact opposite of that right now and complacency isn't particularly great at calling market tops. It's a signal that we COULD be topping, but I'd want to see a lot of corroborating signals to support sentiment.
253-day SMA ($CPCE)
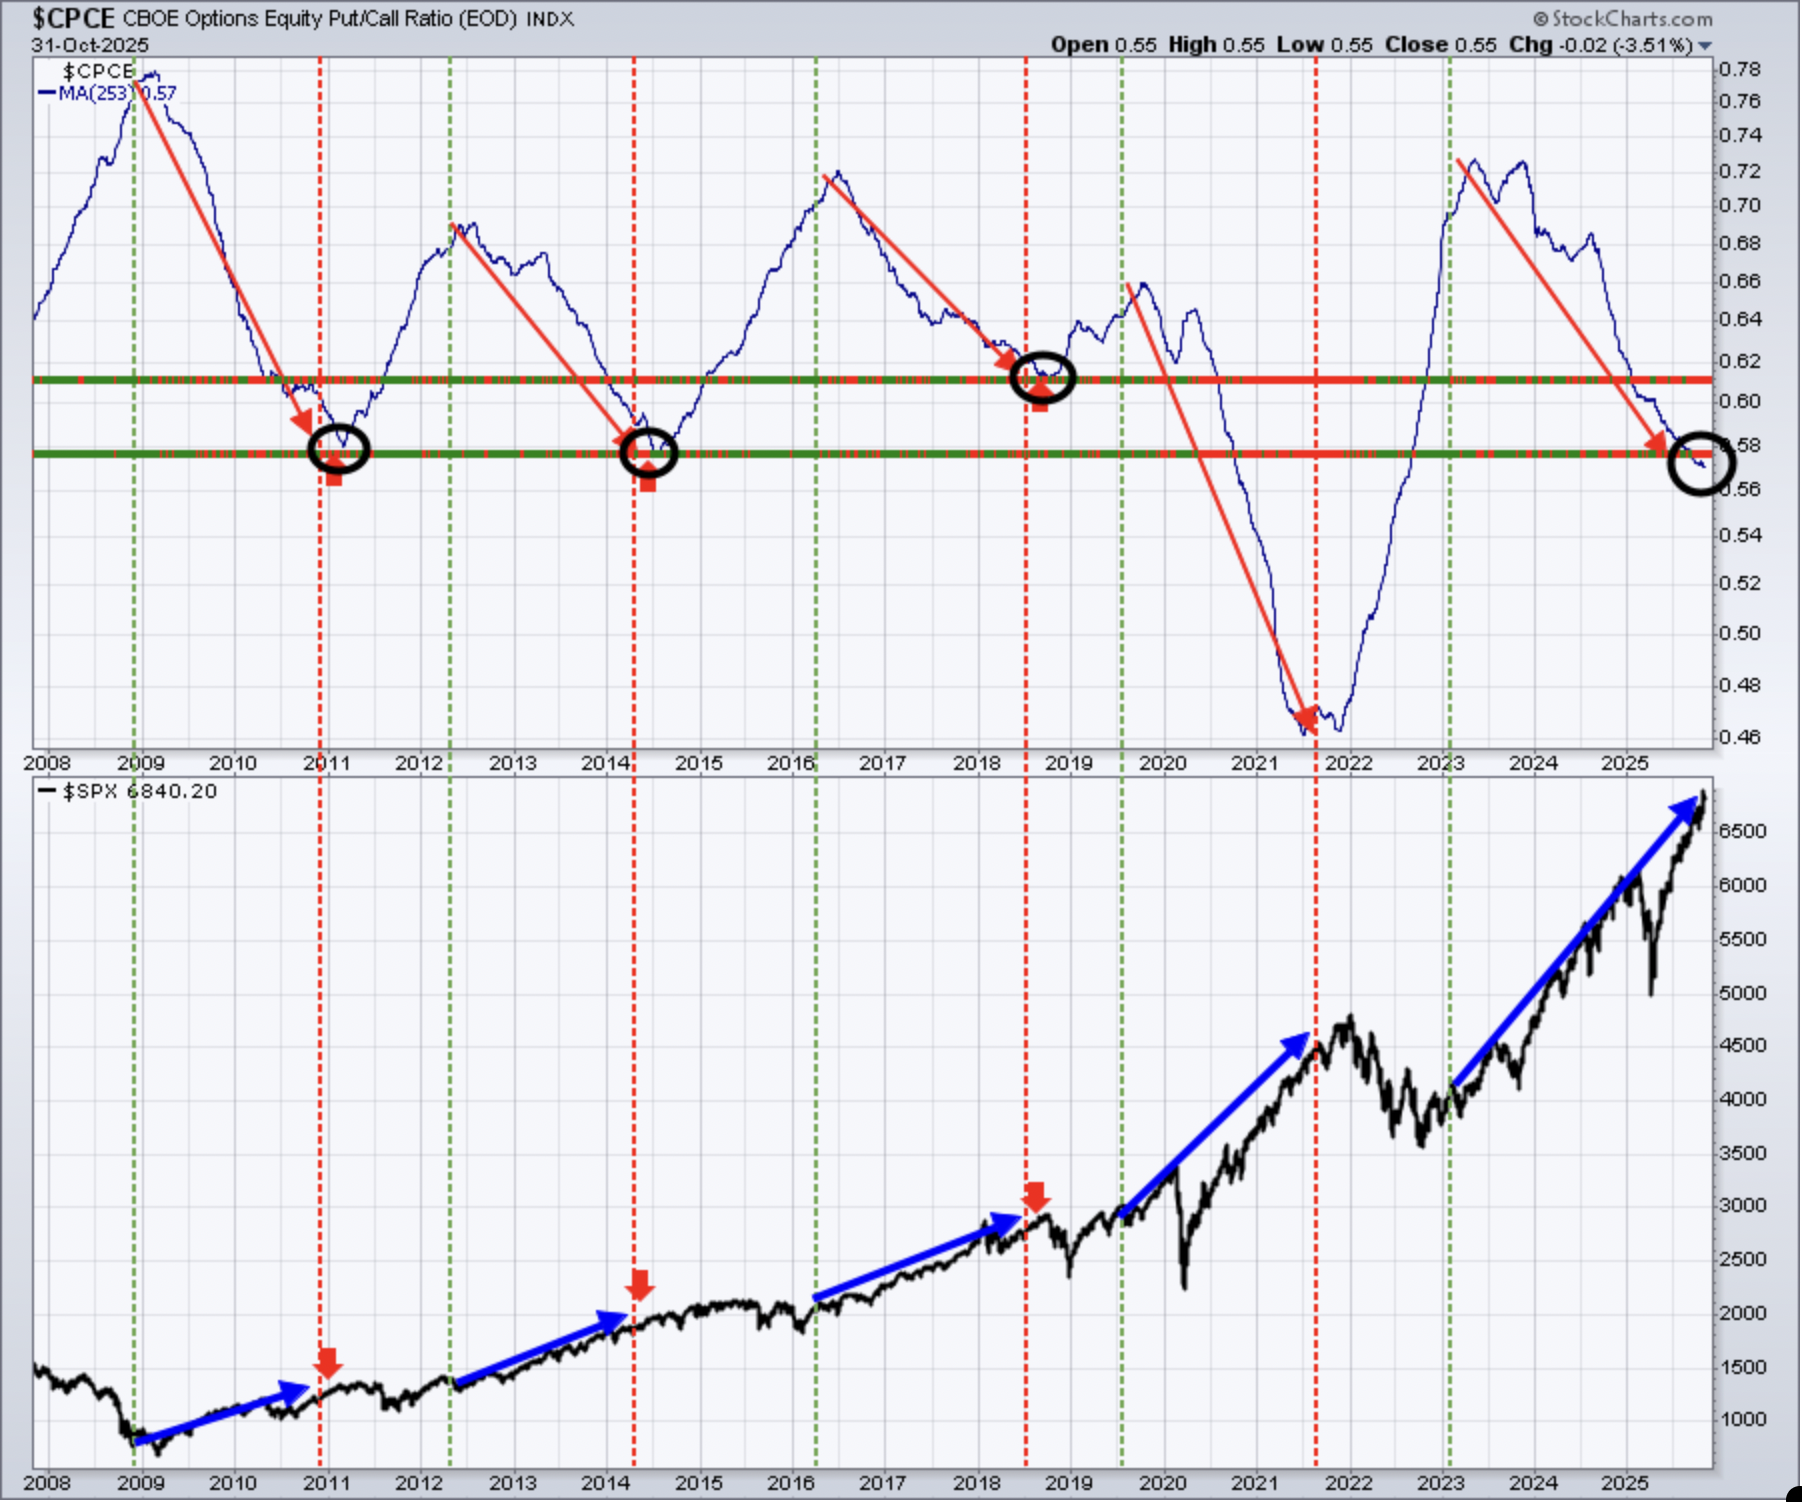
This longer-term 253-day SMA of the CPCE is our "ocean-liner" signal, unlike our short-term speedboat indicator. This one usually provides us a very solid long-term signal as the overall market environment moves from one of pessimism to complacency and vice versa. No changes here. The overall downtrend appears to be intact and this is a bullish signal into year end, in my opinion.
Long-Term Trade Setup
Since beginning this Weekly Market Report in September 2023, I've discussed the long-term trade candidates below that I really like. Generally, these stocks have excellent long-term track records, and many pay nice dividends that mostly grow every year. Only in specific cases (exceptions) would I consider a long-term entry into a stock that has a poor or limited long-term track record and/or pays no dividends. I try to review the long-term picture once a month or so. Below is a quick recap of how these stocks looked as of Friday - after many of them reported their latest quarterly results:
- JPM – challenging all-time highs after quarterly results were released
- BA – rolling over and losing 20-week EMA support not a great look
- FFIV – after months of great action, we've now seen 3 weeks of awful performance
- MA – testing 50-week SMA
- GS – very strong uptrend, nearly tripling over last 20 months
- FDX – appears to now be uptrending on weekly chart
- AAPL – setting new all-time highs last week
- CHRW – has nearly doubled off its April low
- JBHT – moving back through 155 price resistance was a big deal technically
- STX - very hot stock, has now more than quadrupled off its April low
- HSY – was unable to clear 200, then broke 20-week EMA support, want to see it hold 160
- DIS – 125 resistance remains the key
- MSCI – nice week last week, but still has significant resistance in 625-650 range
- SBUX - another in a lengthy consolidation period, needs to hold 70 on selling
- KRE – October reversal leaves the group perilously close to 57.50 support
- ED – 95 is the support I'm watching on the weekly chart
- AJG – after years of uninterrupted strength, AJG now finds itself in a downtrend
- NSC – railroads have been weak, but NSC's uptrend remains intact, watch 270 support
- RHI – one of the worst stocks of 2025, losing support near 28 is bearish
- ADM – recovery still intact, 20-week EMA, now rising at 56, is key support
- BG – has recovered 50% off February low and is currently trending higher
- CVS – traded in October at a near 3-year high
- IPG – consolidation continuing with support in 22.00-22.50 range
- HRL - losing 25 was bad technically and downtrend is worsening
- DE – bouncing slightly off 20-month EMA test
Keep in mind that our Weekly Market Reports favor those who are more interested in the long-term market picture. Therefore, the list of stocks above are stocks that we believe are safer (but nothing is ever 100% safe) to own with the long-term in mind. Nearly everything else we do at EarningsBeats.com favors short-term momentum trading, so I wanted to explain what we're doing with this list and why it's different.
Also, please keep in mind that I'm not a Registered Investment Advisor (and neither is EarningsBeats.com nor any of its employees) and am only providing (mostly) what I believe to be solid dividend-paying stocks for the long term. Companies periodically go through adjustments, new competition, restructuring, management changes, etc. that can have detrimental long-term impacts. Neither the stock price nor the dividend is ever guaranteed. I simply point out interesting stock candidates for longer-term investors. Do your own due diligence and please consult with your financial advisor before making any purchases or sales of securities.
Looking Ahead
Upcoming Earnings
The following list of companies is NOT a list of all companies scheduled to report quarterly earnings, however, just key reports, so please be sure to check for earnings dates of any companies that you own. Any company in BOLD represents a stock in one of our portfolios and the amount in parenthesis represents the market capitalization of each company listed:
- Monday: PLTR ($462 billion), VRTX ($108 billion)
- Tuesday: AMD ($414 billion), SHOP ($226 billion), UBER ($201 billion), ANET ($199 billion)
- Wednesday: MCD ($216 billion), APP ($210 billion), QCOM ($191 billion), HOOD ($123 billion), DASH ($109 billion)
- Thursday: ABNB ($79 billion), VST ($64 billion), DDOG ($55 billion)
- Friday: None
Key Economic Reports
- Monday: October manufacturing PMI, October ISM manufacturing PMI, September construction spending
- Tuesday: September factory orders, September JOLTS
- Wednesday: October ADP employment report, October ISM services
- Thursday: Initial jobless claims, Q3 productivity, September wholesale inventories
- Friday: October nonfarm payrolls, November consumer sentiment
Given the current government shutdown, the above reports will not be released unless the shutdown ends.
Historical Data
I'm a true stock market historian. I am absolutely PASSIONATE about studying stock market history to provide us more clues about likely stock market direction and potential sectors/industries/stocks to trade. While I don't use history as a primary indicator, I'm always very aware of it as a secondary indicator. I love it when history lines up with my technical signals, providing me with much more confidence to make particular trades.
Below you'll find the next two weeks of historical data and tendencies across the three key indices that I follow most closely. The percentage for each calendar day represents the annualized return for that day. An example of how this is calculated is reflected next to the first day under the S&P 500 and in parenthesis:
S&P 500 (since 1950)
- Nov 3: +98.11% (Ex: cumulative gains = +19.39% over 50 trading days since 1950. +19.39% x 253/50 = +98.11%)
- Nov 4: +50.55%
- Nov 5: +77.71%
- Nov 6: -11.74%
- Nov 7: -7.35%
- Nov 8: +22.15%
- Nov 9: -10.78%
- Nov 10: +35.74%
- Nov 11: +49.14%
- Nov 12: -19.68%
- Nov 13: +26.48%
- Nov 14: +4.96%
- Nov 15: -13.59%
- Nov 16: +12.22%
NASDAQ (since 1971)
- Nov 3: +97.89%
- Nov 4: +103.87%
- Nov 5: +108.87%
- Nov 6: +43.46%
- Nov 7: -31.20%
- Nov 8: -4.82%
- Nov 9: -62.87%
- Nov 10: +10.01%
- Nov 11: +69.00%
- Nov 12: -4.12%
- Nov 13: +70.26%
- Nov 14: -2.83%
- Nov 15: -29.39%
- Nov 16: -28.72%
Russell 2000 (since 1987)
- Nov 3: +170.75%
- Nov 4: +58.62%
- Nov 5: +83.55%
- Nov 6: +76.93%
- Nov 7: -68.96%
- Nov 8: +26.02%
- Nov 9: -54.42%
- Nov 10: +71.71%
- Nov 11: +23.03%
- Nov 12: -115.04%
- Nov 13: +122.02%
- Nov 14: -15.86%
- Nov 15: -13.20%
- Nov 16: -17.55%
The S&P 500 data dates back to 1950, while the NASDAQ and Russell 2000 information date back to 1971 and 1987, respectively.
Final Thoughts
Last week was mostly a week of gap ups. For the week, the SPY (ETF that tracks the S&P 500) had cumulation gains at the opening bell of 10.90, but gained less than 5 bucks for the entire week. So there wasn't much intraday buying to further lift stocks. Rather, it all came very early in the day.
Likewise, the QQQ (ETF that tracks the NASDAQ 100) jumped a cumulative 16.82 at the 5 opening bells last week, but gained just 12 bucks for the week. By contrast, the IWM (ETF that tracks the small cap Russell 2000) jumped a mere .04 at the opening bell last week and lost 3 bucks for the week. I'm not sure if this provides us anything substantive in calling the market direction, but it does tell me that Wall Street has accumulated its shares and is forcing everyone else to pay mostly higher prices after gap ups. Unfortunately, this is how the stock market works.
Here are a few things I'm thinking about as we tackle a big week of earnings ahead:
Government Shutdown. It's now been over a month. At some point, the shutdown will matter to the economy. The longer this drags on, the more Wall Street could begin to focus on it. The result likely would be negative, not positive.
Earnings. While many of the biggest names have now reported (NVDA is an exception and they report in a little more than two weeks), there's a very influential group of stocks reporting this week, including Palantir (PLTR) and Advanced Micro Devices (AMD).
Interest Rates. The 10-year treasury yield ($TNX) was on the rise last week and tested its 20-day EMA from underneath. It's flat this morning and resting squarely on the 50-day SMA at 4.10%. Which way does it go from here?
Commodities. After gold ($GOLD) finished its prior two weeks above $4000 per ounce, it closed on Friday just under that psychological mark. The uptrend here does remain in play, so pullback can be considered for entry into gold names. Silver ($SILVER) looks similar. Crude oil prices ($WTIC) are downtrending, though, and look like they might revisit, and possibly even break beneath, support around $57 per barrel. Energy stocks (XLE) are likely to struggle until an uptrend is felt in crude.
Seasonality. It's November and this month is seasonally kind to industrials (XLI) and financials (XLF). I would not say this is a 100% certainty, in terms of relative performance in November 2025, I'm simply stating historical fact. Feel free to use this information in your investing/trading strategies or ignore it.
Happy trading!
Tom