
EB Weekly Market Report - Monday, November 17, 2025
ChartLists/Spreadsheets
The following ChartLists/Spreadsheets were updated over the weekend:
- Strong Earnings (SECL)
- Strong Future Earnings (SFECL)
- Raised Guidance (RGCL)
- Strong AD (SADCL)
- Bullish Trifecta (BTCL)
- Short Squeeze (SSCL)
- Leading Stock (LSCL)
- Hot Stocks (HTCL)
- Key Manipulation Spreadsheet
The above ChartLists and spreadsheet have been updated. You can read more about our ChartLists on our website.
Weekly Market Recap
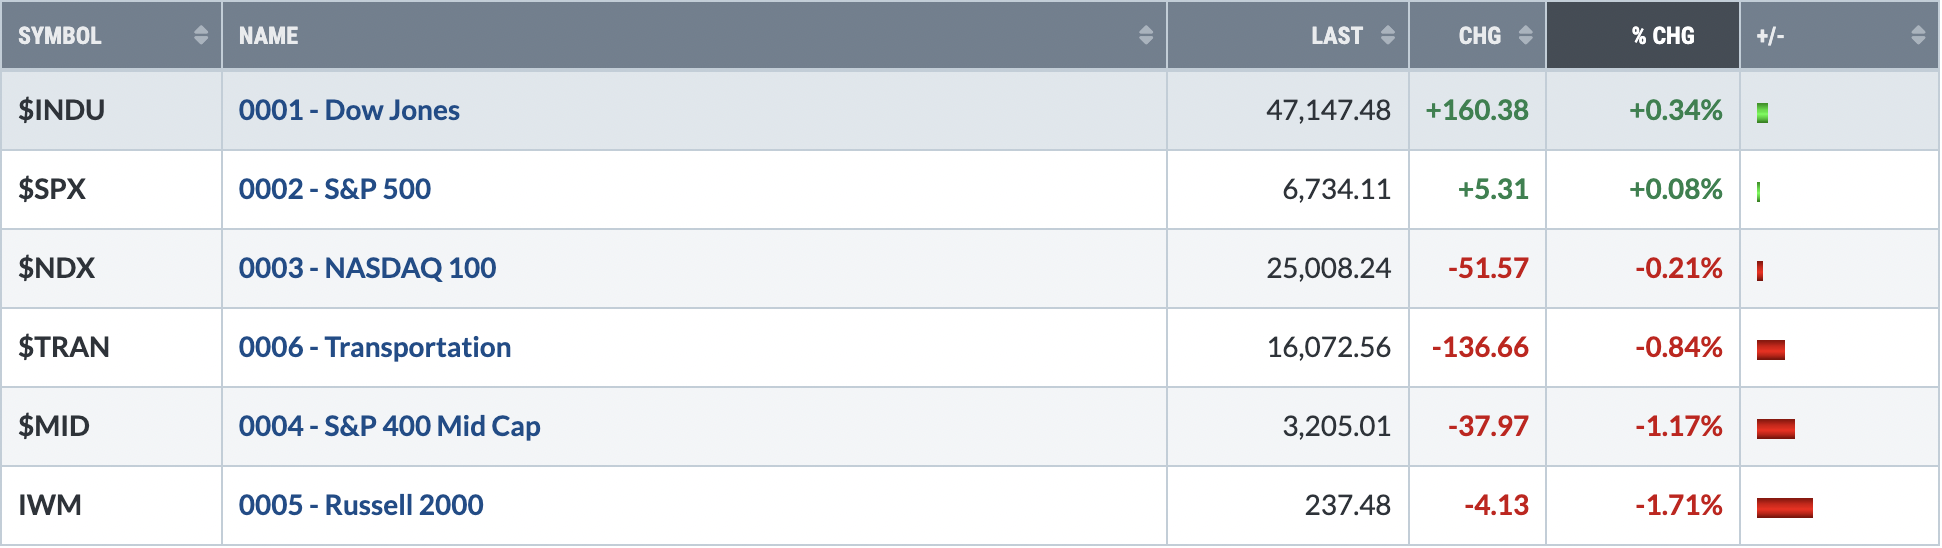
Major Indices
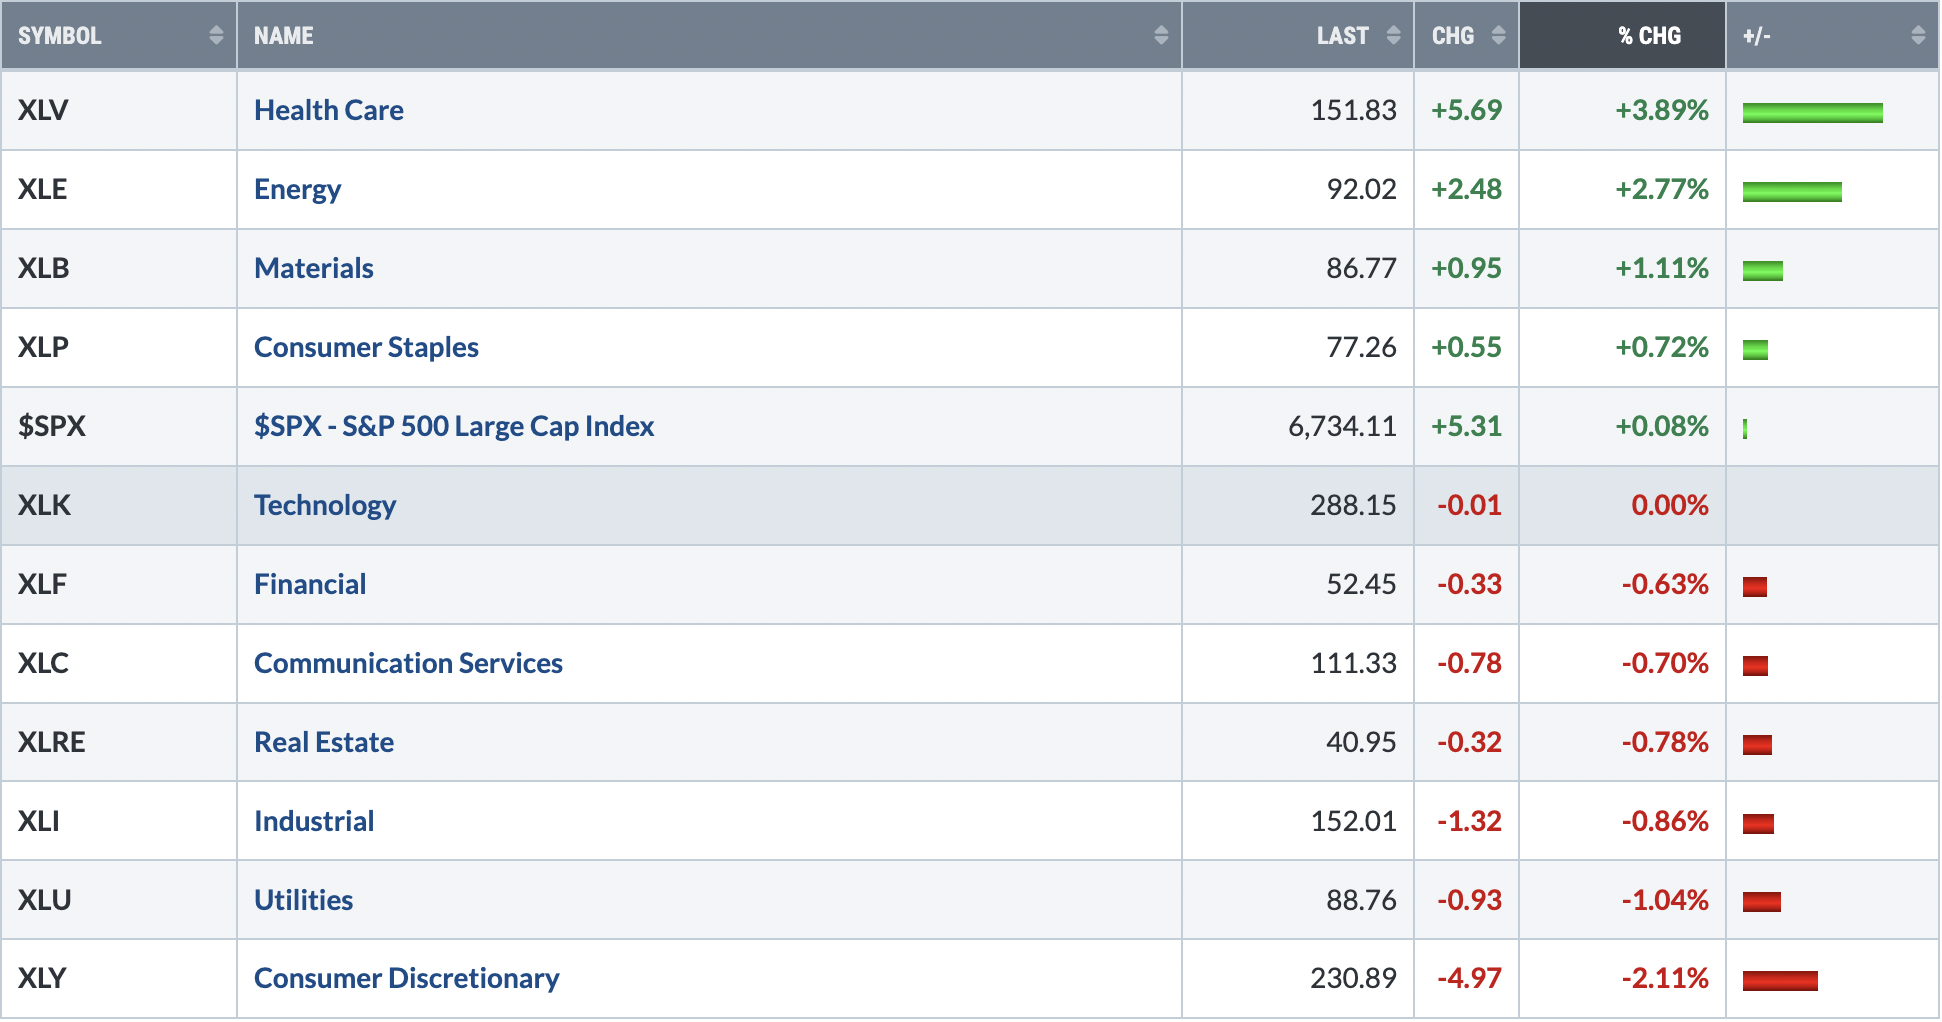
Sectors
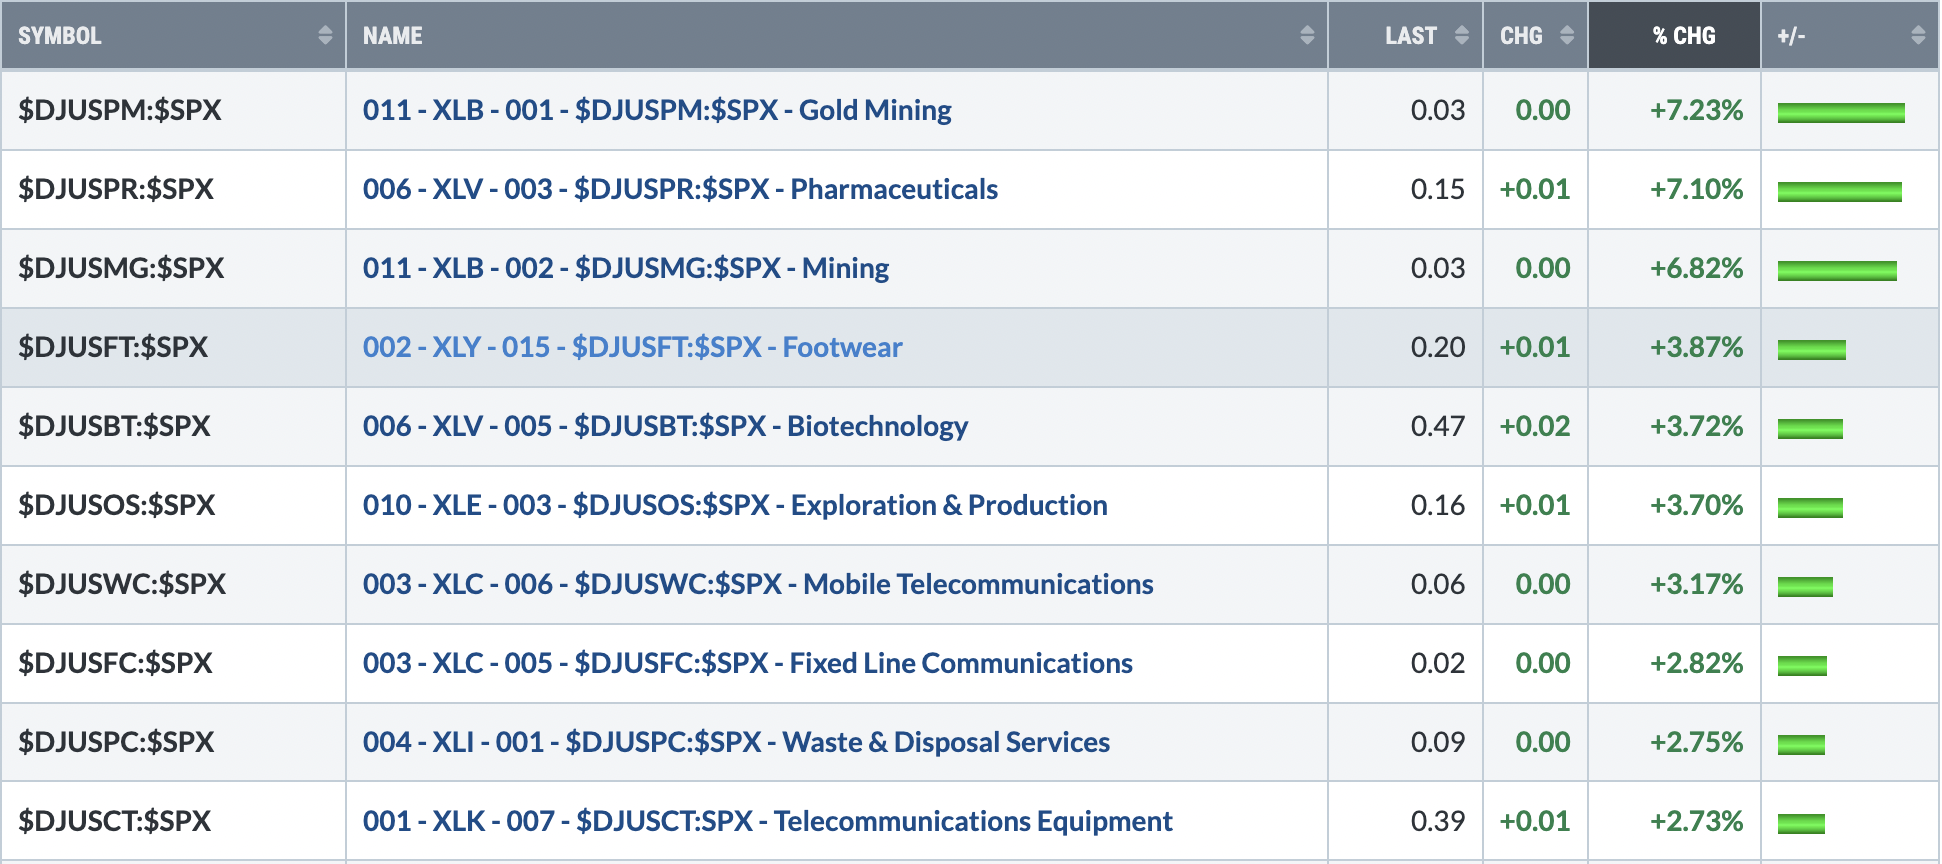
Top 10 Industries Last Week
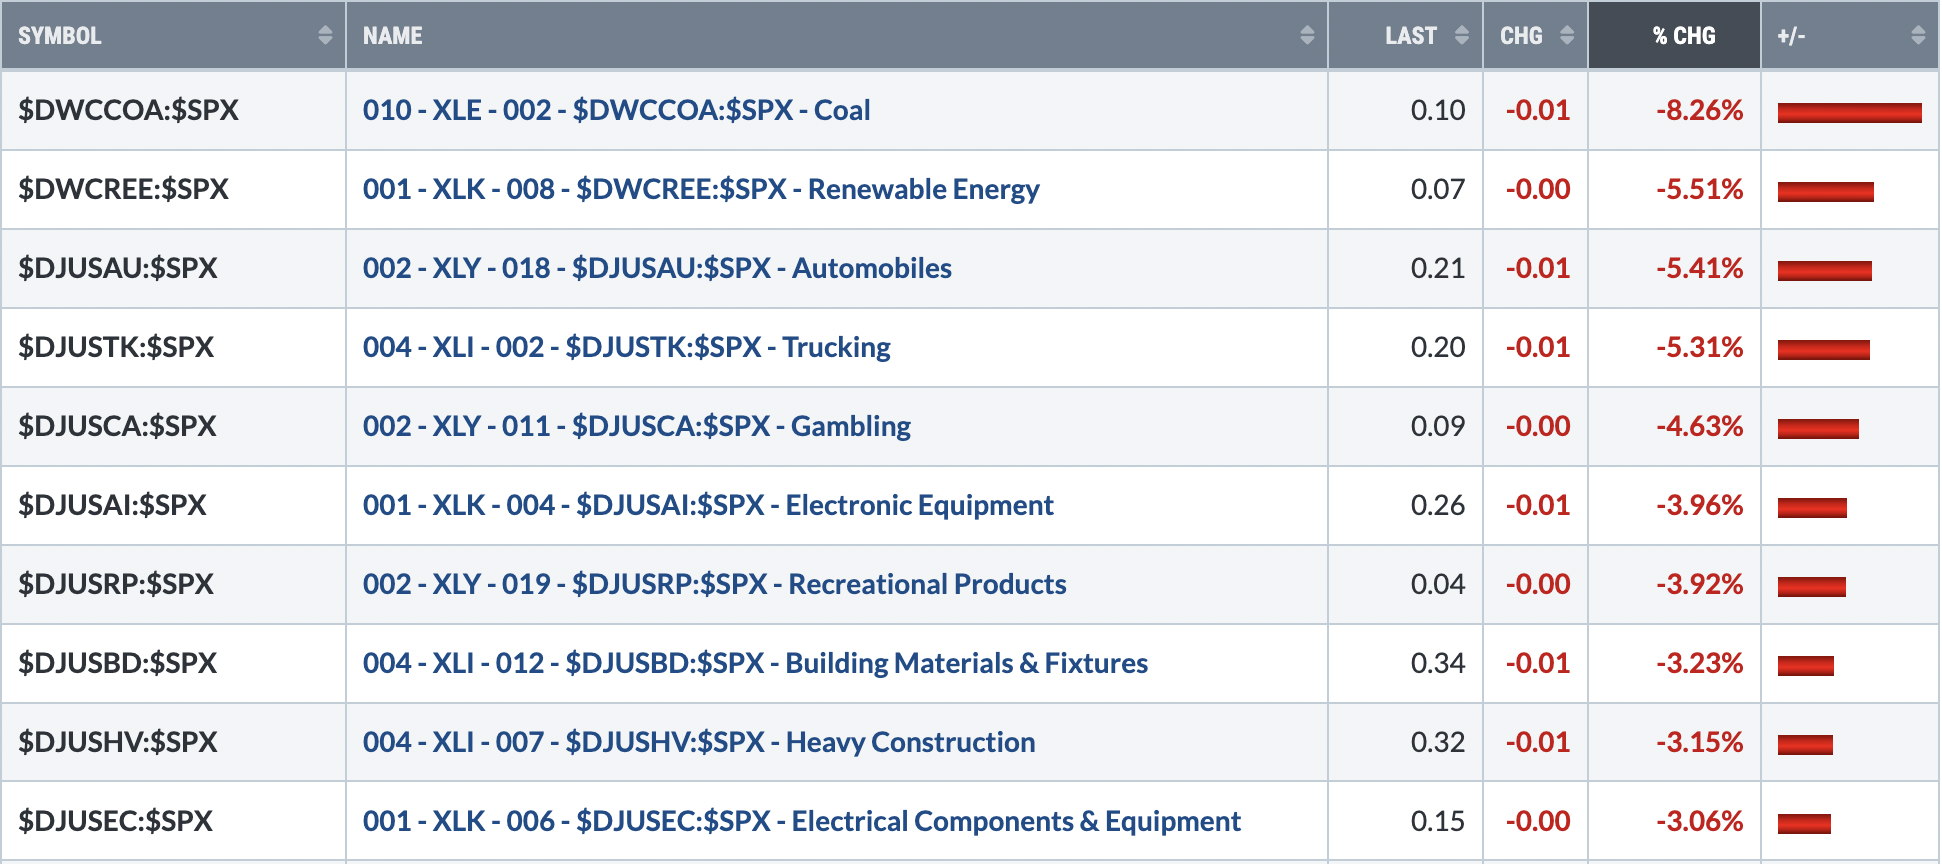
Bottom 10 Industries Last Week
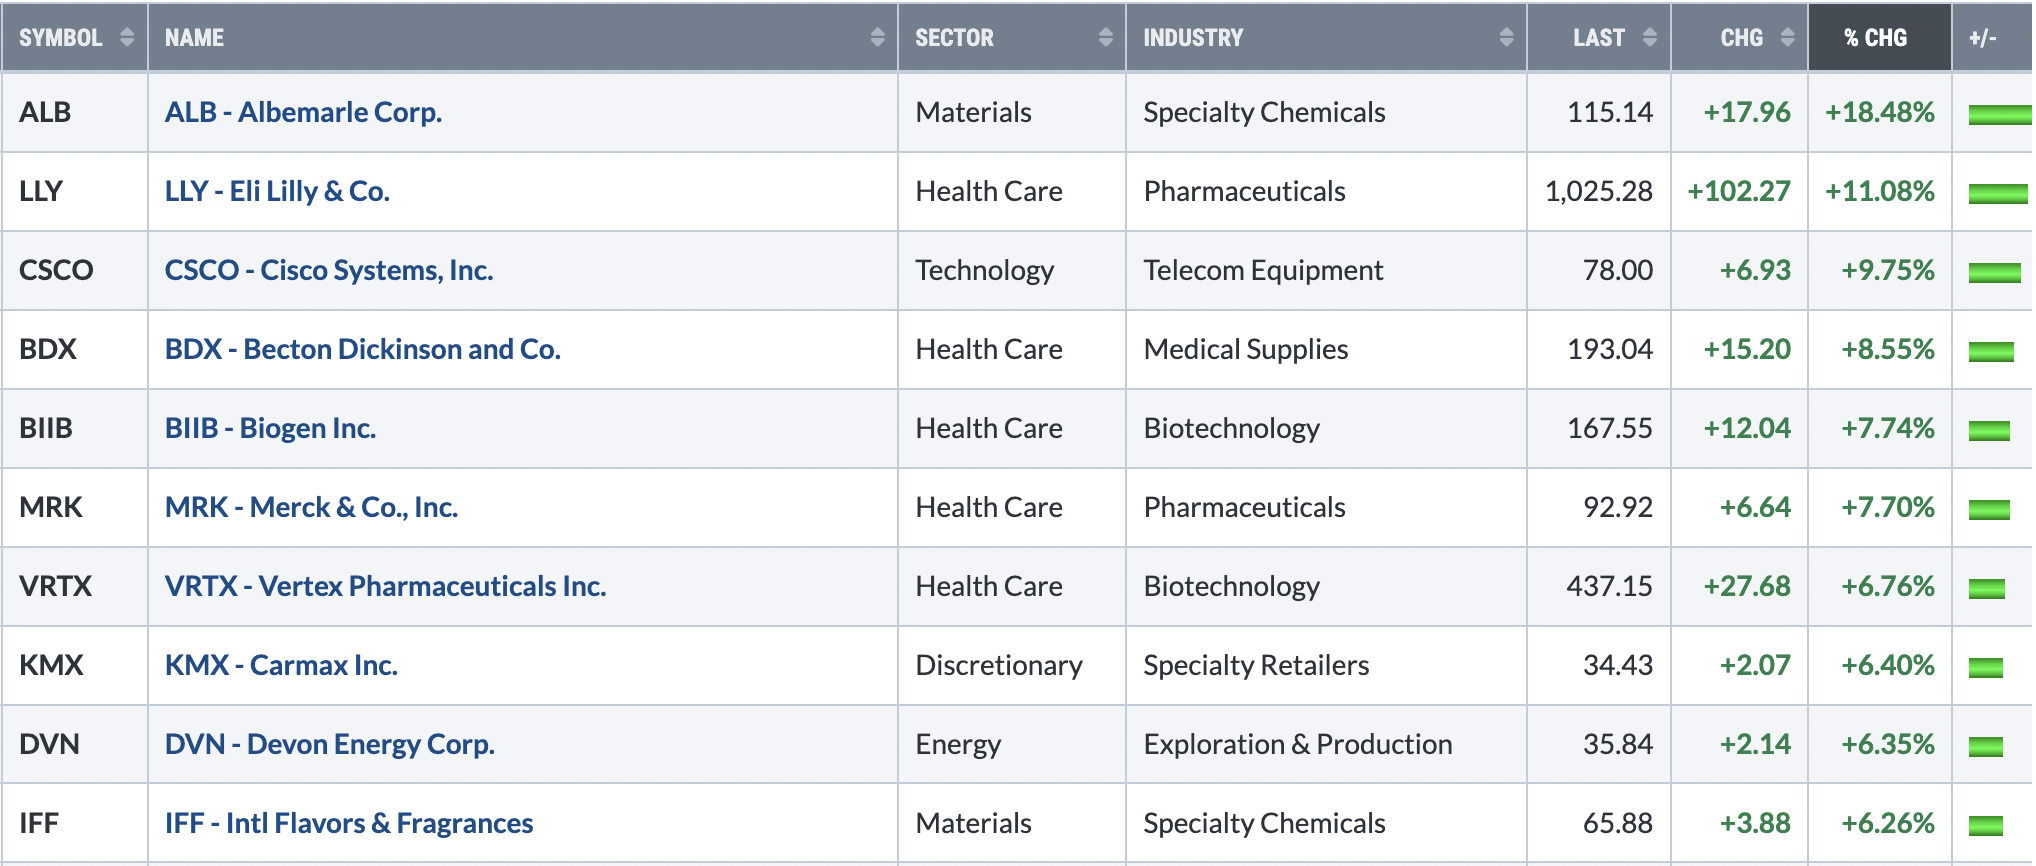
Top 10 Stocks - S&P 500/NASDAQ 100
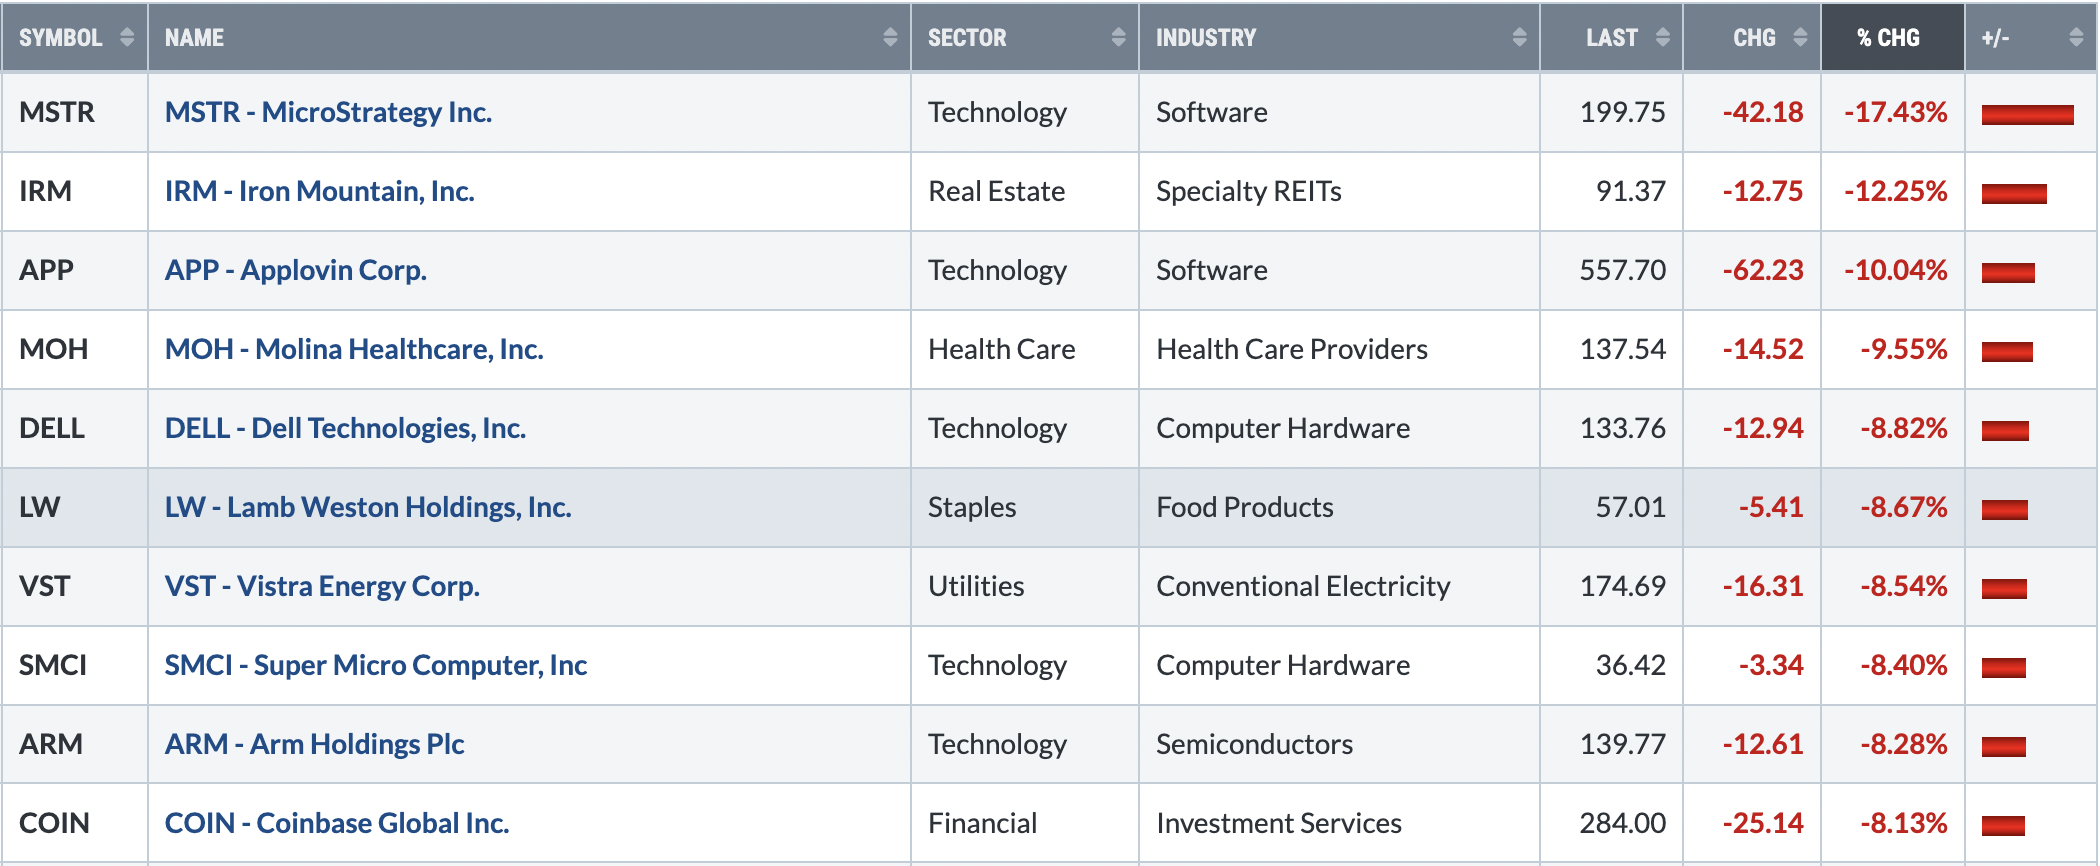
Bottom 10 Stocks - S&P 500/NASDAQ 100
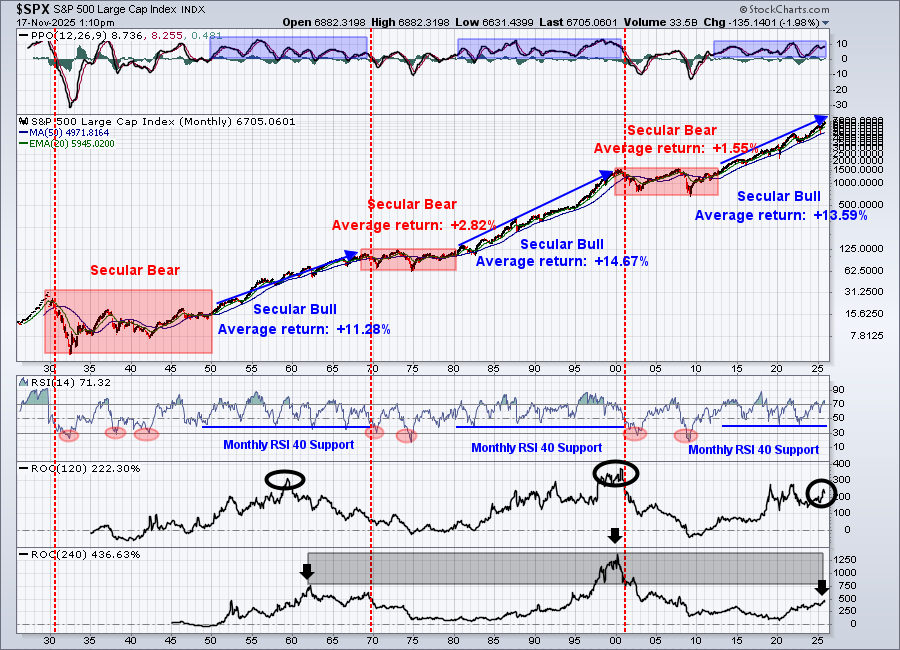
Big Picture
I am growing more concerned about short-term action, especially as it relates to interest-rate sensitive areas of the market. Small caps (IWM), home construction (XHB), and regional banks (KRE) have been 3 areas that I've favored for awhile and each has had its own relative strength at times, but that relative strength has taken an abrupt downturn over the past few weeks to couple months. This behavior is leading me to believe that the expected rate cut in December won't happen.
So...from a SHORT-TERM perspective, I believe these areas have much more risk exposure. If the Fed comes through with the December rate cut, then I would expect these areas to soar as it now appears that investors are selling these groups. If we continue to see relative weakness, then it's much more likely that the Fed will not cut and Wall Street HATES this uncertainty and back-and-forth yo-yo stance by the Fed. After all, if the Fed cannot figure out whether to battle economic woes or stubborn inflation, then how is Wall Street supposed to figure out proper valuations for equities, especially those equities most impacted by rate decisions?
I view the current situation similar to this time last year when the Fed decided to move from a rate-cutting stance to a wait-and-see approach. You can see varying degrees of relative strength in Q4 2024 that stopped dead in its tracks when Wall Street began to sense that the Fed would pause rate cuts. Things deteriorated from there as the relative weakness accelerated into 2025:
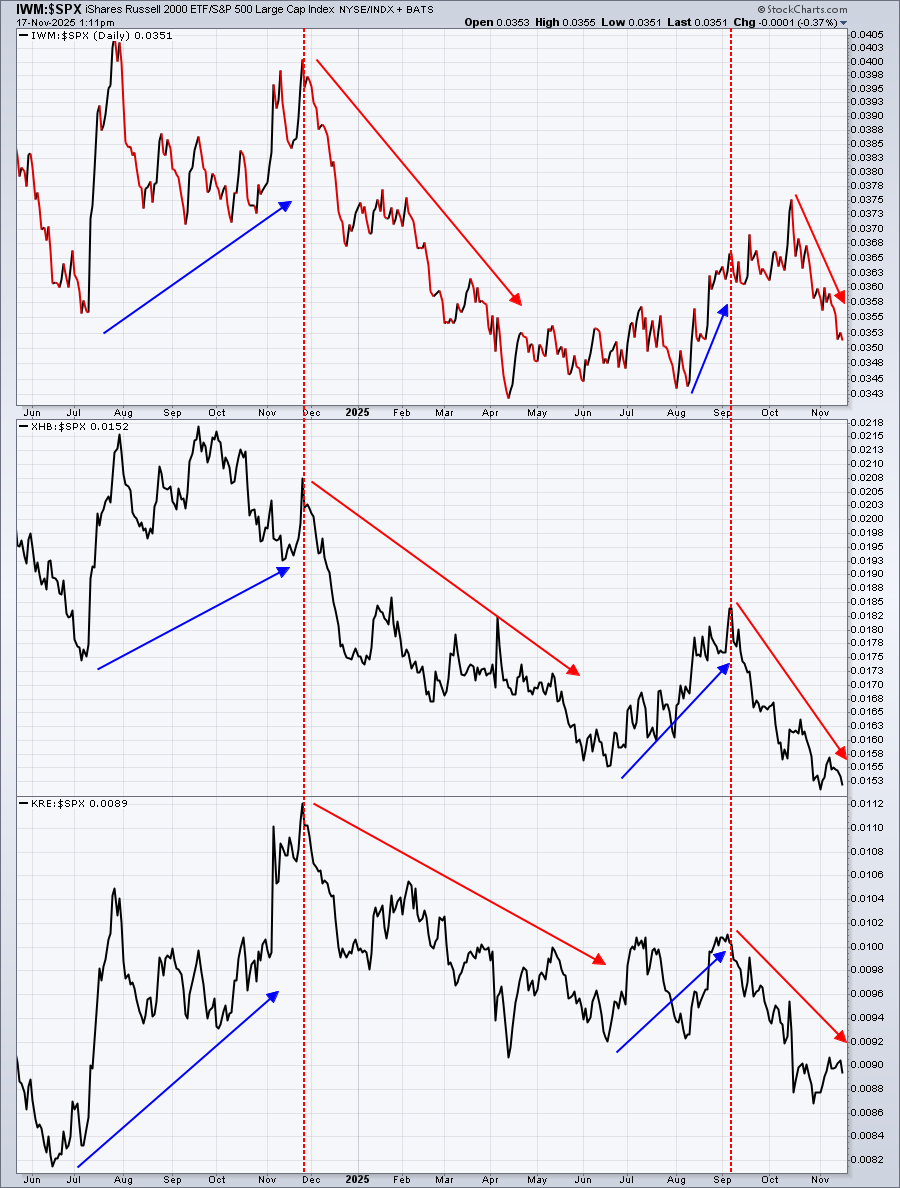
I think it looks very similar this year. I have backed off the IWM and KRE as a result. It's a challenging environment, for sure, because I do think money will quickly rotate back into these groups if it appears that the Fed will cut next month. Right now, however, caution is the right approach, in my view.
From a LONG-TERM perspective, nothing has really changed. I believe rates ultimately come down further and that market valuations move higher as economic conditions improve. My long-term signals continue to point to higher prices down the road. If and when that changes, you'll be the first to hear.
Sustainability Ratios
Here's the latest look at our key intraday ratios as we follow where the money is traveling on an INTRADAY basis (ignoring gaps):
QQQ:SPY
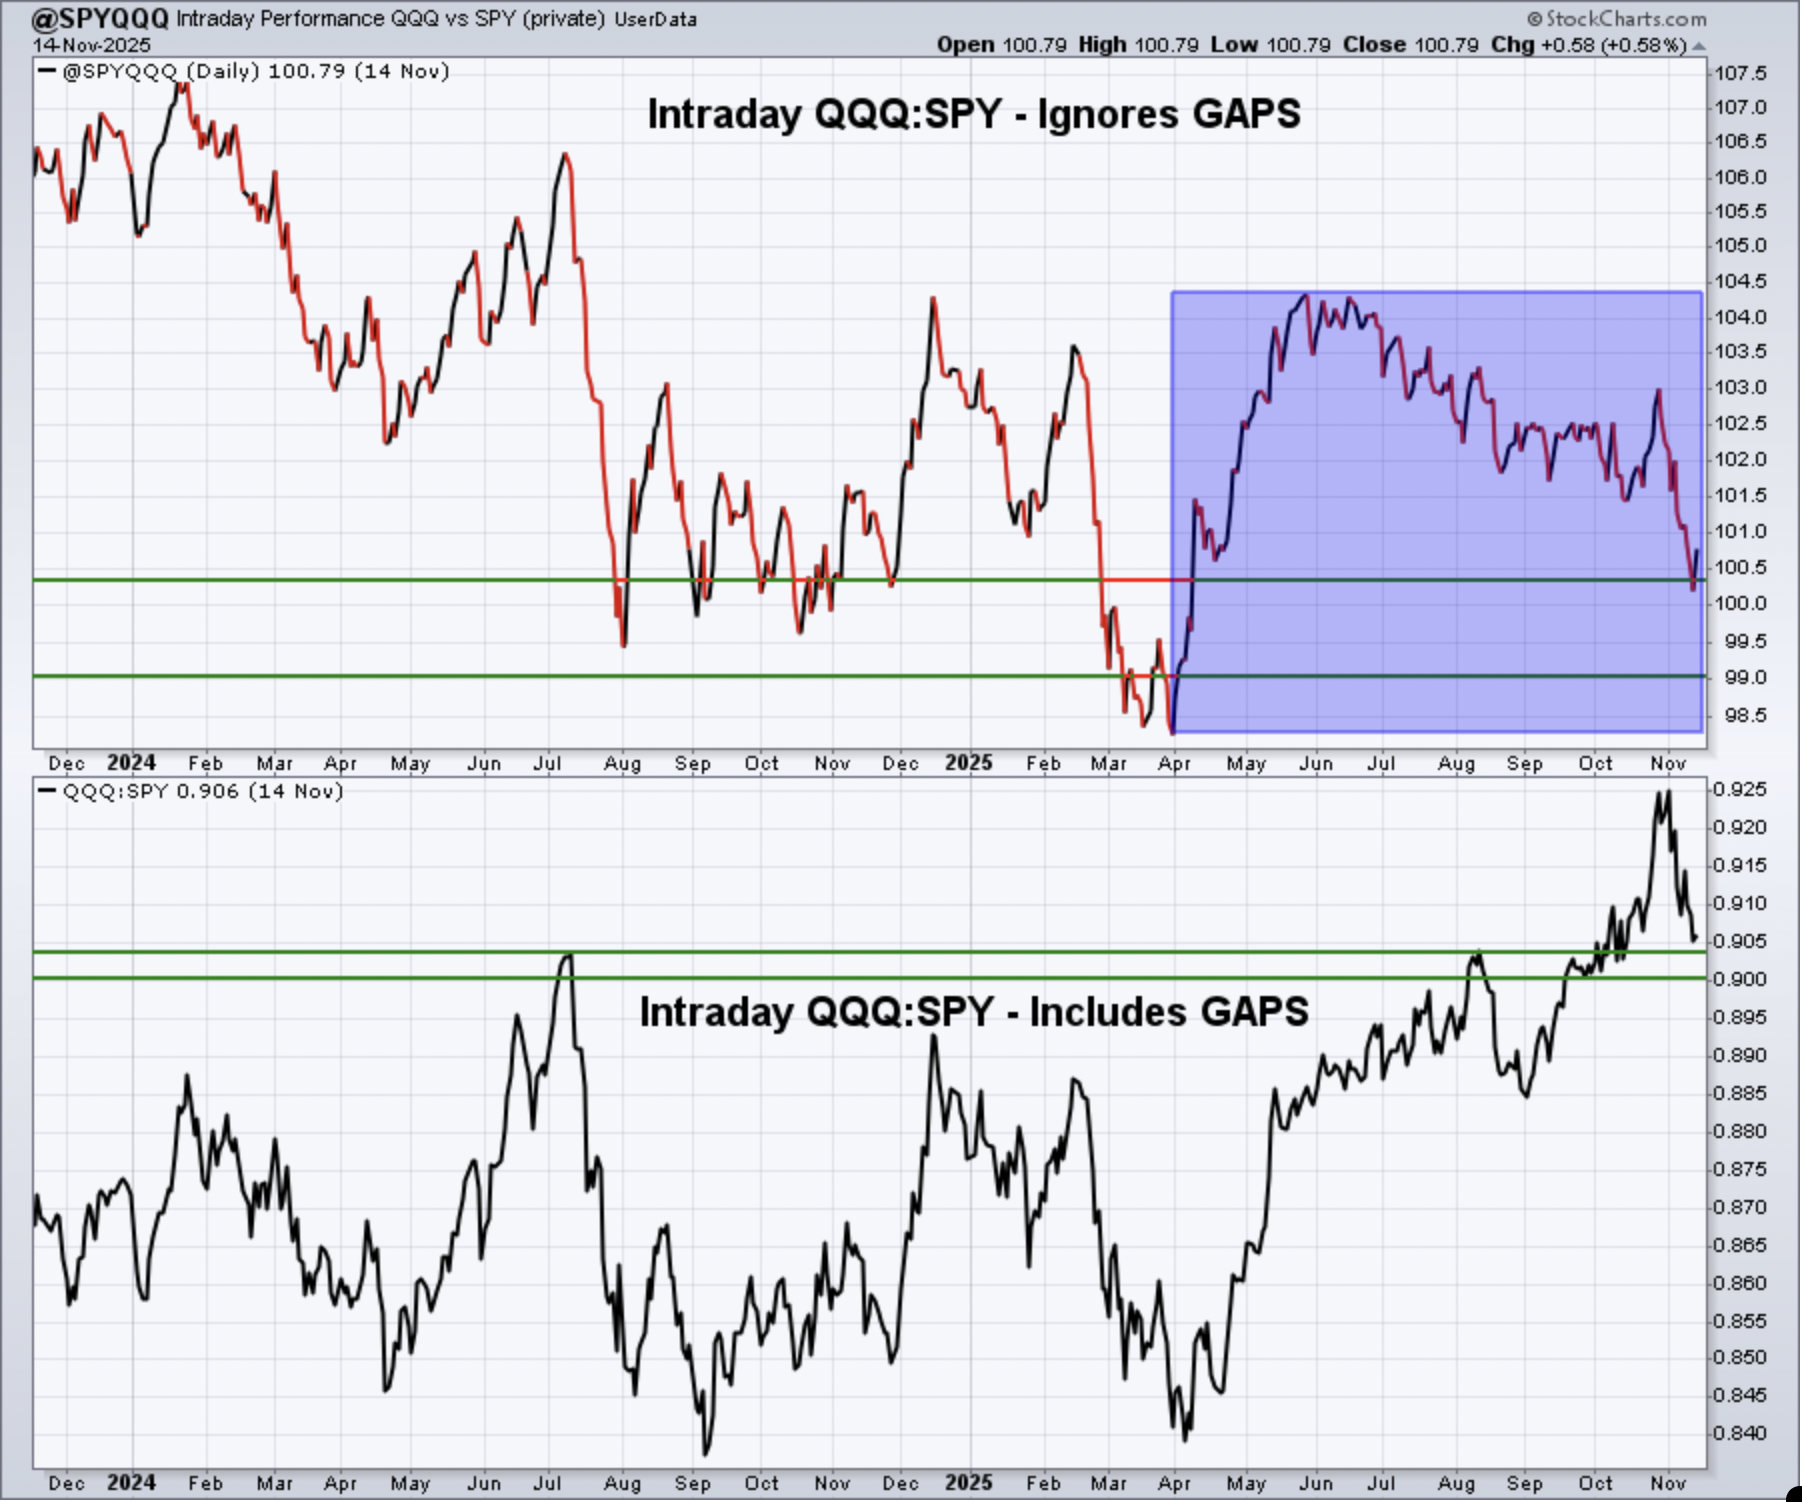
Keep in mind that the intraday analysis provided is a "work in progress". I continue to analyze this data to see if it helps provide us clues about calling market direction. It makes common sense to me that it should help in some sense, but it'll require a much longer-term study to determine its worth. For now, though, you can see that money seems to be rotating during the day more towards the S&P 500, suggesting that as the more growth-oriented NASDAQ rises, more of that increase is due to opening gaps and less is due to intraday accumulation.
I will say that I don't believe any one signal will ever provide us answers as to market direction. All of our information needs to be considered together. Tops form for different reasons, so trying to use just one signal, I believe, will send many false signals.IWM:QQQ
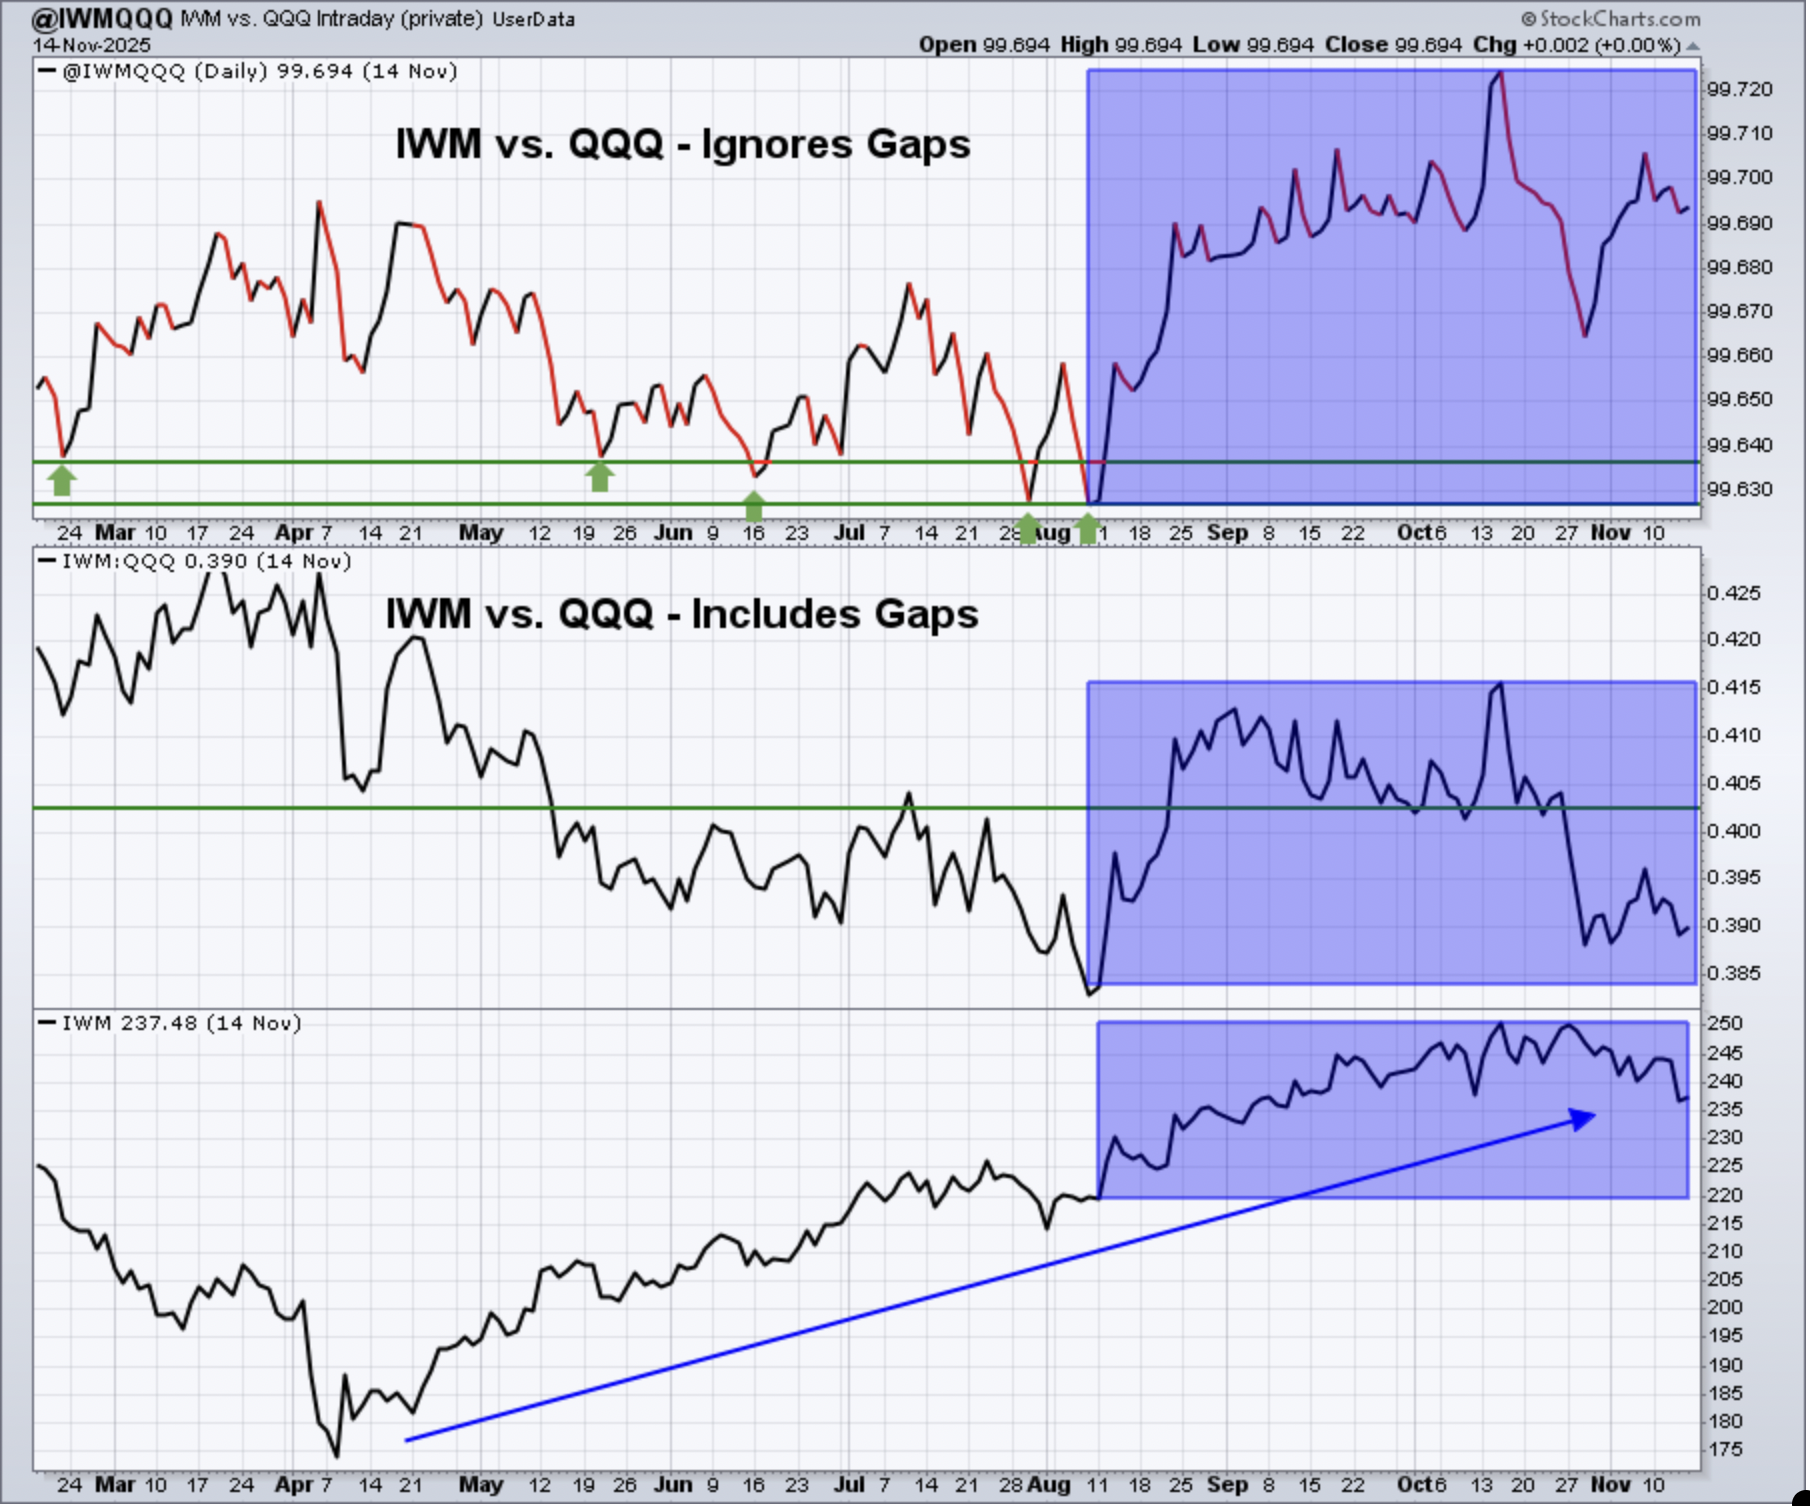
The IWM price action has turned bearish after closing twice last week beneath its neckline within a topping head & shoulders pattern. The intraday chart (top panel) above is still holding its own, well off its prior low, but the "including gaps" panel is deteriorating and moving closer to the August low - not great.
XLY:XLP
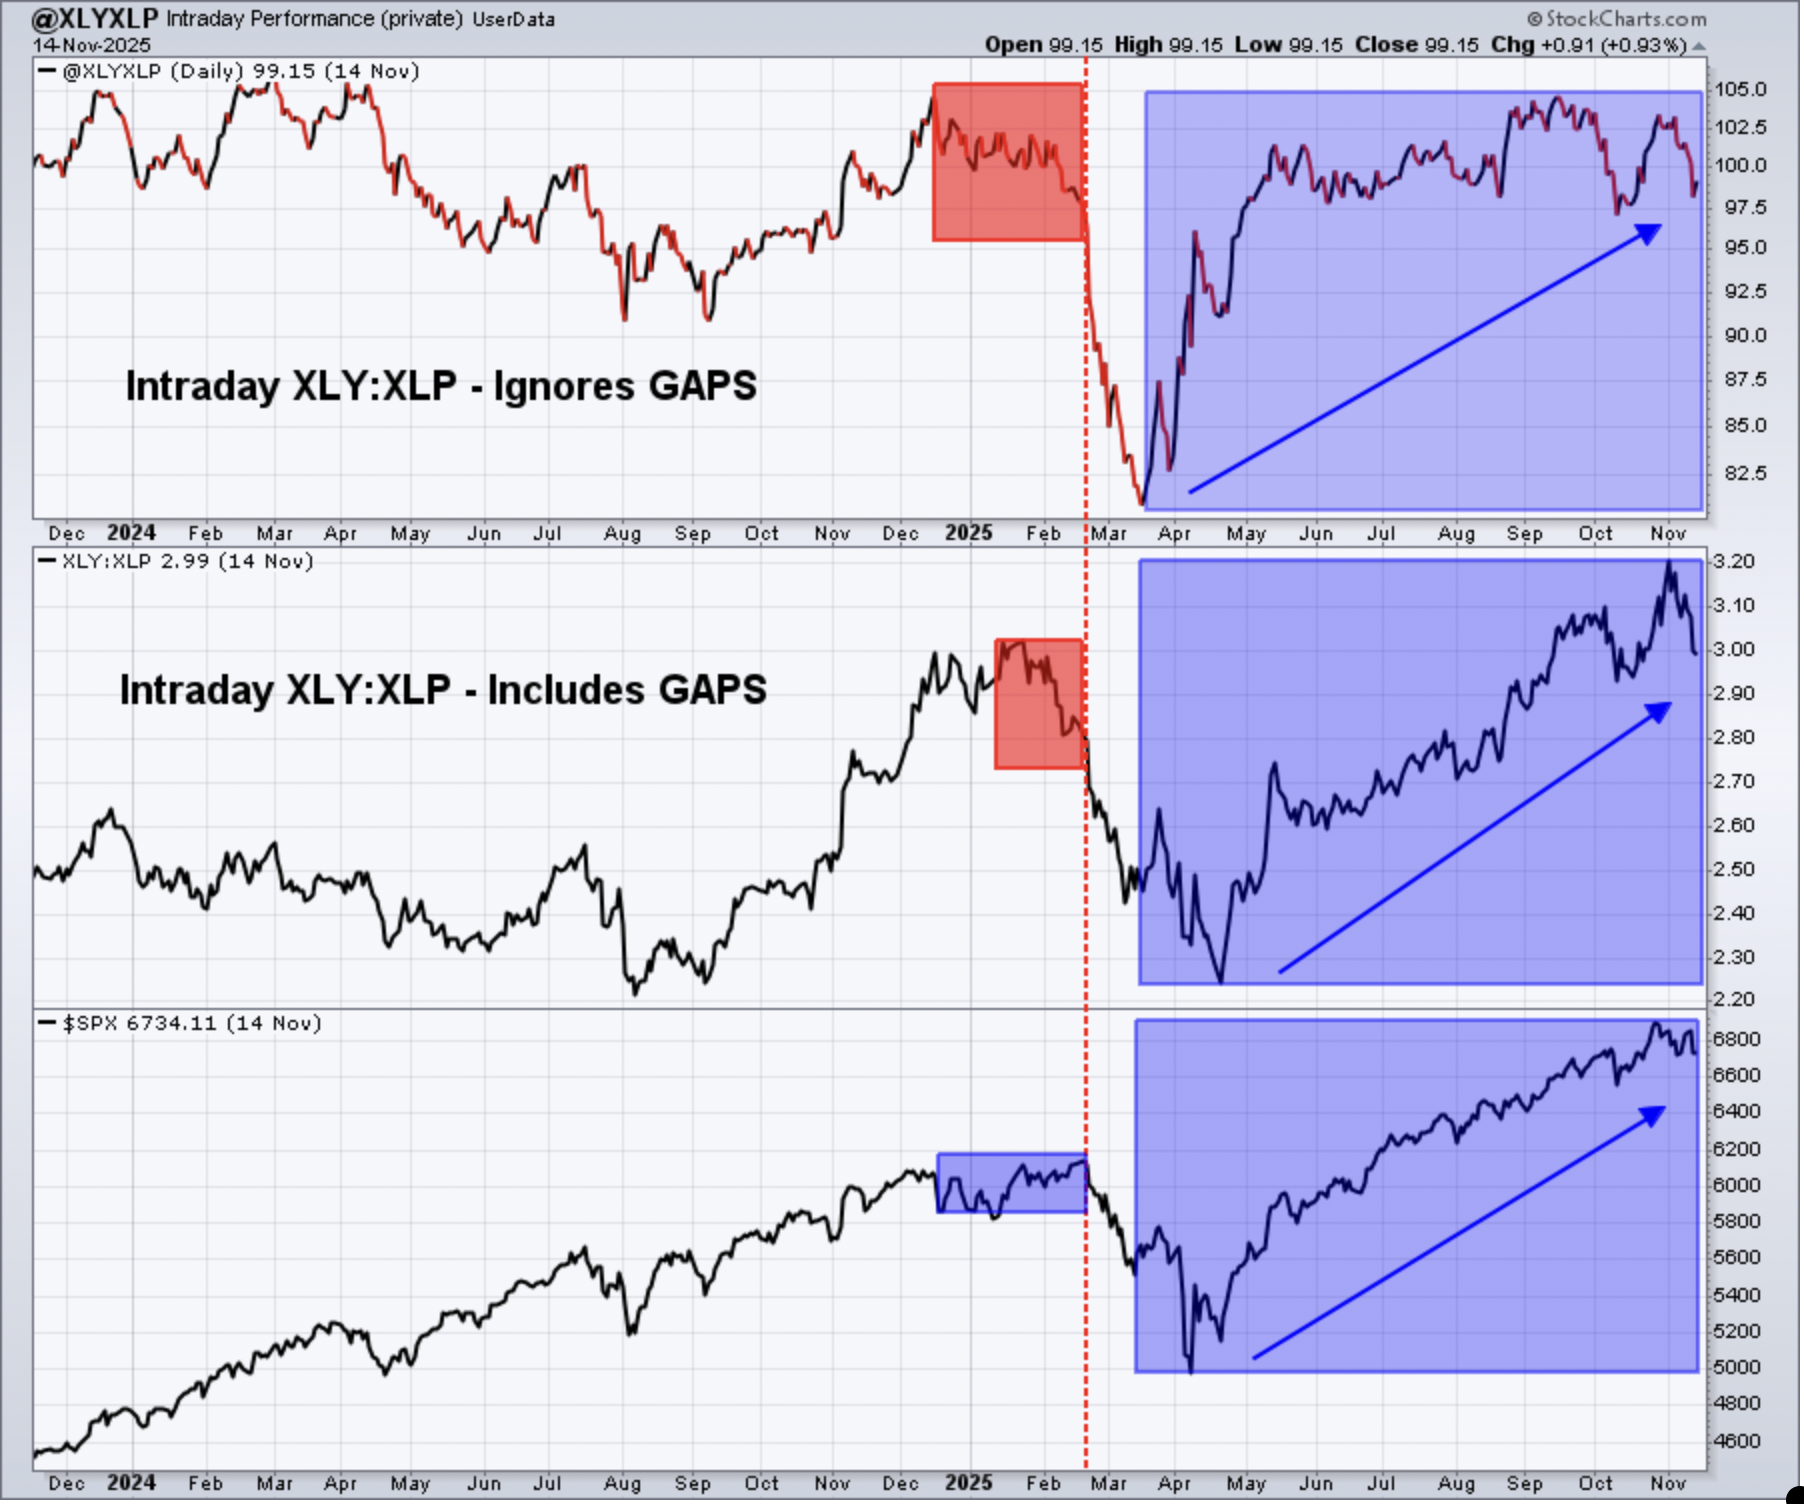
Both "including gaps" and "excluding gaps" charts remain in an uptrend, supporting the overall uptrend in the S&P 500 and suggesting this secular bull market is sustainable. The top panel, however, does look like there's less rotation to the more aggressive discretionary space than the chart where gaps are included.
Sentiment
5-day SMA ($CPCE)
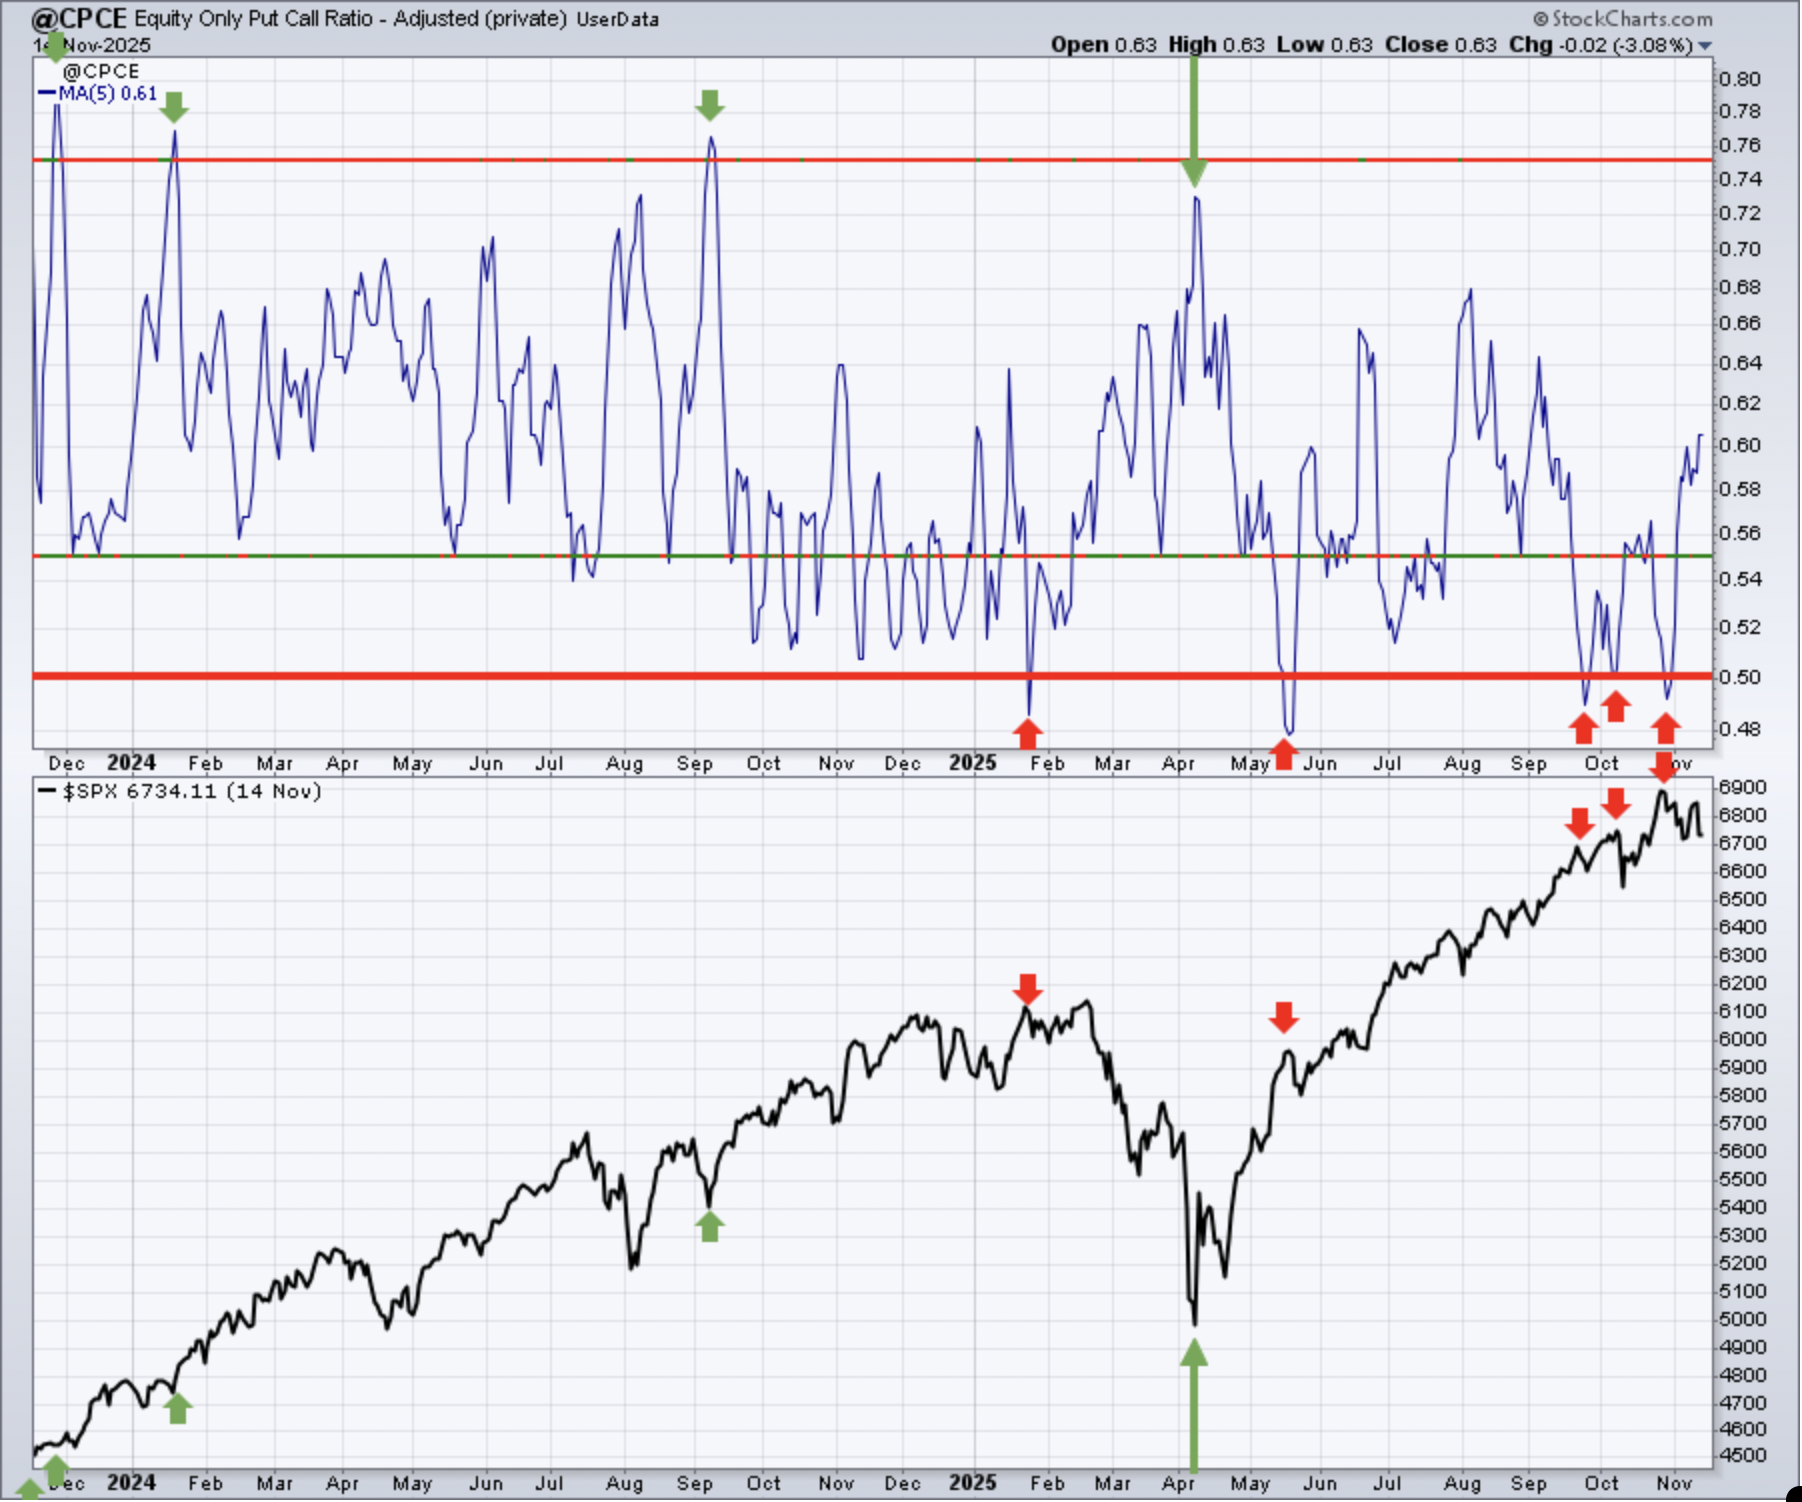
Sentiment indicators are contrarian indicators. When they show extreme bullishness, we need to be a bit cautious and when they show extreme pessimism, it could be time to become much more aggressive. Major market bottoms are carved out when pessimism is at its absolute highest level.
Keep in mind that the above 5-day SMA reading of the CPCE is our "speed boat" sentiment indicator that changes quite frequently. This sentiment indicator is now in "neutral" territory in the .60s. Historically, we don't grow excessively pessimistic, where bottoms form, until this 5-day moving average reaches .75.
253-day SMA ($CPCE)
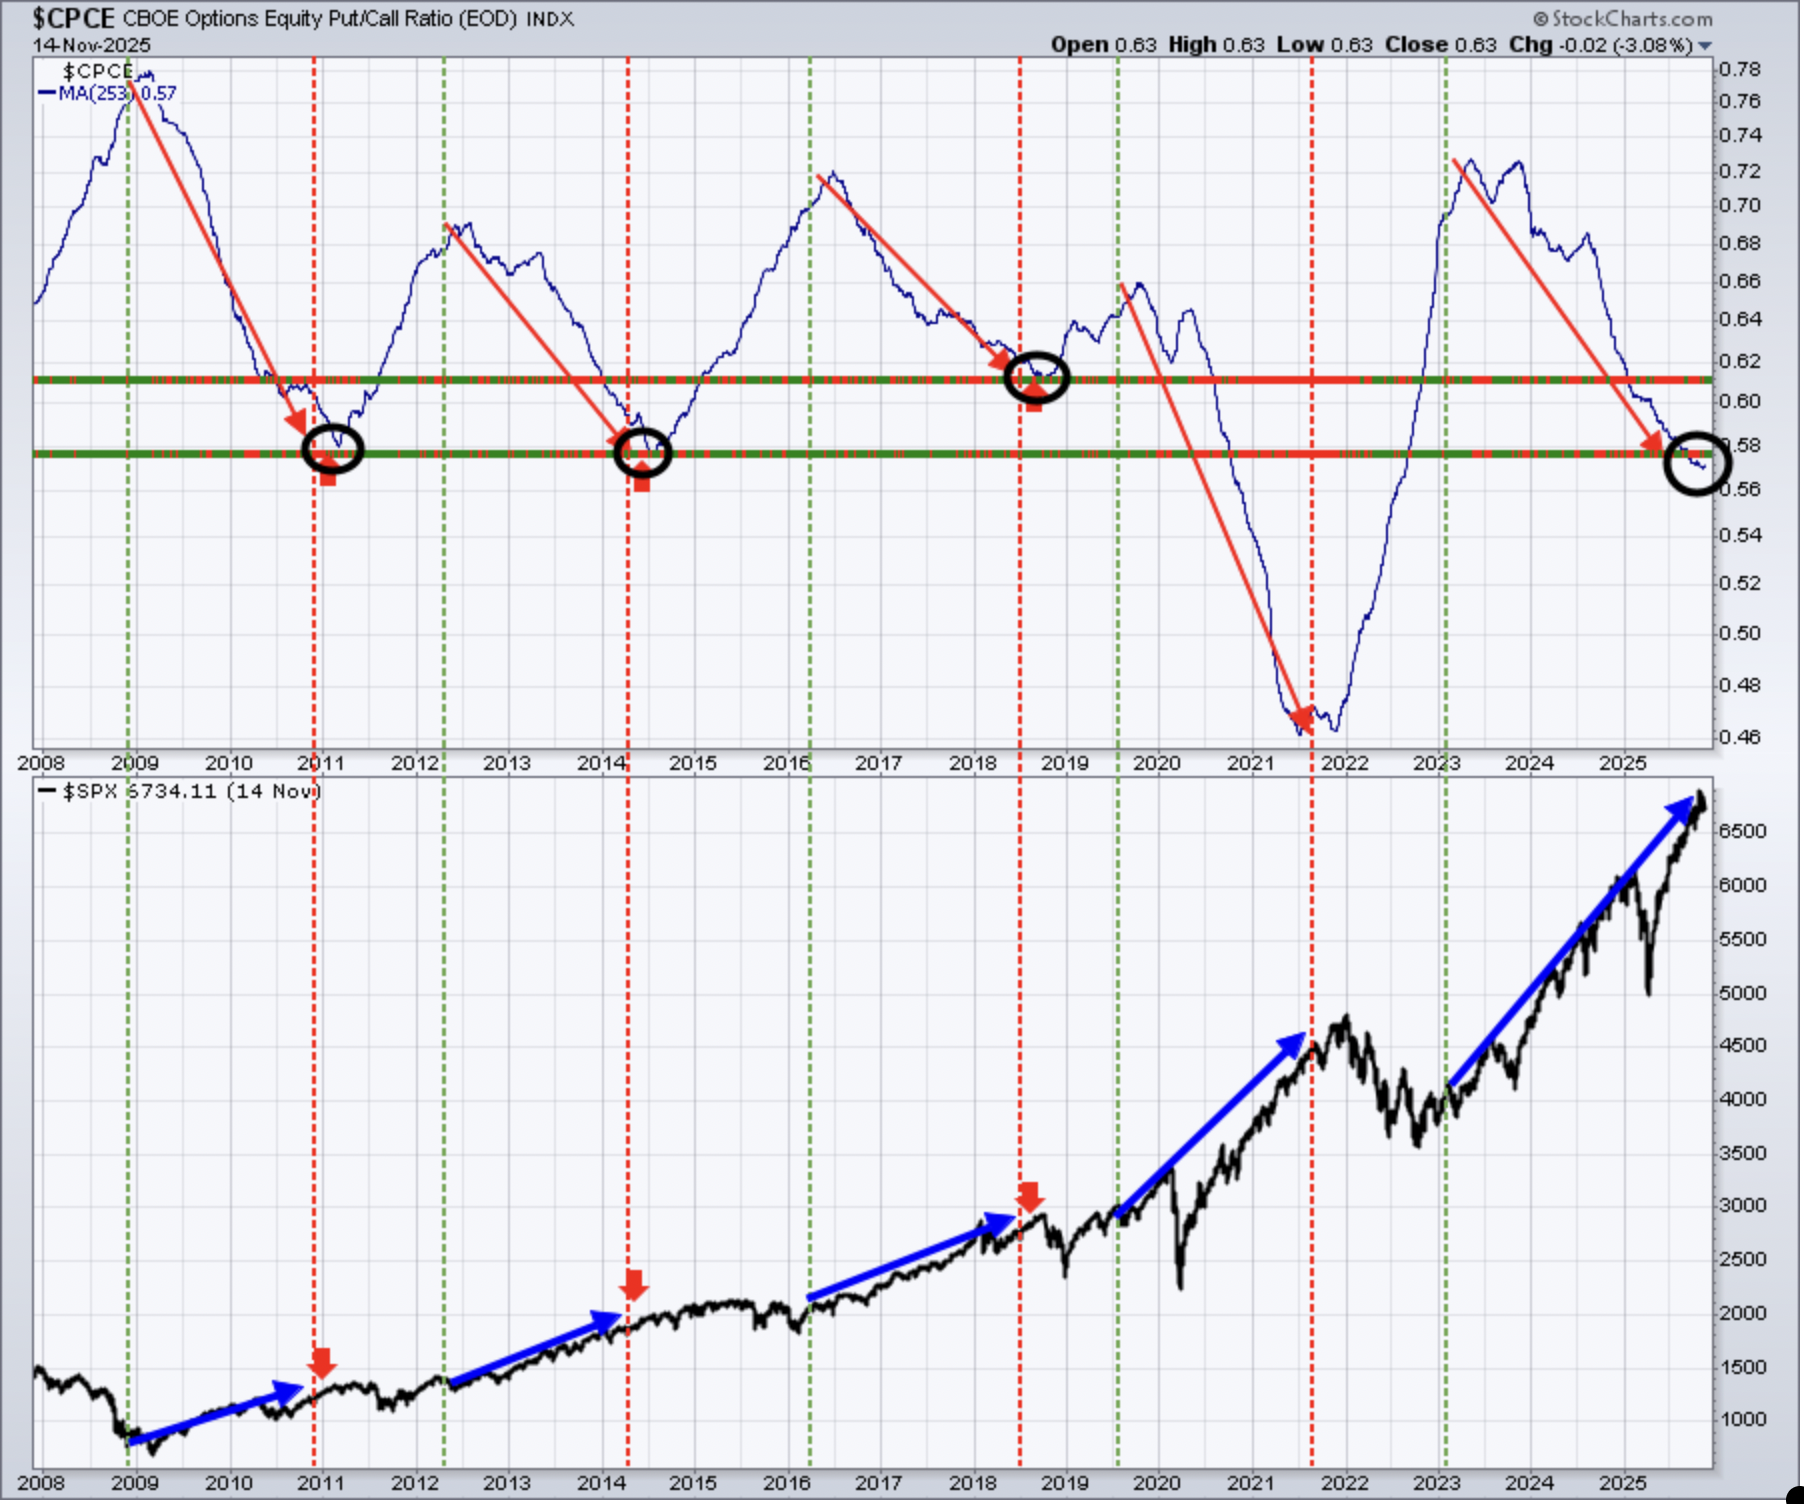
This longer-term 253-day SMA of the CPCE is our "ocean-liner" signal, unlike our short-term speedboat indicator. Like the XLY:XLP ratio, this sentiment indicator points to higher prices in the S&P 500 and rally sustainability.
Long-Term Trade Setup
Since beginning this Weekly Market Report in September 2023, I've discussed the long-term trade candidates below that I really like. Generally, these stocks have excellent long-term track records, and many pay nice dividends that mostly grow every year. Only in specific cases (exceptions) would I consider a long-term entry into a stock that has a poor or limited long-term track record and/or pays no dividends. I try to review the long-term picture once a month or so. Below is a quick recap of how these stocks looked as of two weeks ago:
- JPM – challenging all-time highs after quarterly results were released
- BA – rolling over and losing 20-week EMA support not a great look
- FFIV – after months of great action, we've now seen 3 weeks of awful performance
- MA – testing 50-week SMA
- GS – very strong uptrend, nearly tripling over last 20 months
- FDX – appears to now be uptrending on weekly chart
- AAPL – setting new all-time highs last week
- CHRW – has nearly doubled off its April low
- JBHT – moving back through 155 price resistance was a big deal technically
- STX - very hot stock, has now more than quadrupled off its April low
- HSY – was unable to clear 200, then broke 20-week EMA support, want to see it hold 160
- DIS – 125 resistance remains the key
- MSCI – nice week last week, but still has significant resistance in 625-650 range
- SBUX - another in a lengthy consolidation period, needs to hold 70 on selling
- KRE – October reversal leaves the group perilously close to 57.50 support
- ED – 95 is the support I'm watching on the weekly chart
- AJG – after years of uninterrupted strength, AJG now finds itself in a downtrend
- NSC – railroads have been weak, but NSC's uptrend remains intact, watch 270 support
- RHI – one of the worst stocks of 2025, losing support near 28 is bearish
- ADM – recovery still intact, 20-week EMA, now rising at 56, is key support
- BG – has recovered 50% off February low and is currently trending higher
- CVS – traded in October at a near 3-year high
- IPG – consolidation continuing with support in 22.00-22.50 range
- HRL - losing 25 was bad technically and downtrend is worsening
- DE – bouncing slightly off 20-month EMA test
I want to add two more stocks to this list, both from a growth perspective as neither pay quarterly dividends. Accordingly, these would not be good choices from an income investor's mindset as they generate no regular dividend income. However, these are both stocks that have had very bullish pasts, but have really been beaten up:
LULU:
At the beginning of the year, LULU had more than $50 billion market cap and it's now under $20 billion. The company remains profitable and its trailing 12-month PE ratio has fallen from 27 to 12. These types of POTENTIAL turnaround candidates typically require a ton of patience, but not always. Here's the long-term chart, showing LULU's monthly RSI now down in the 30s.
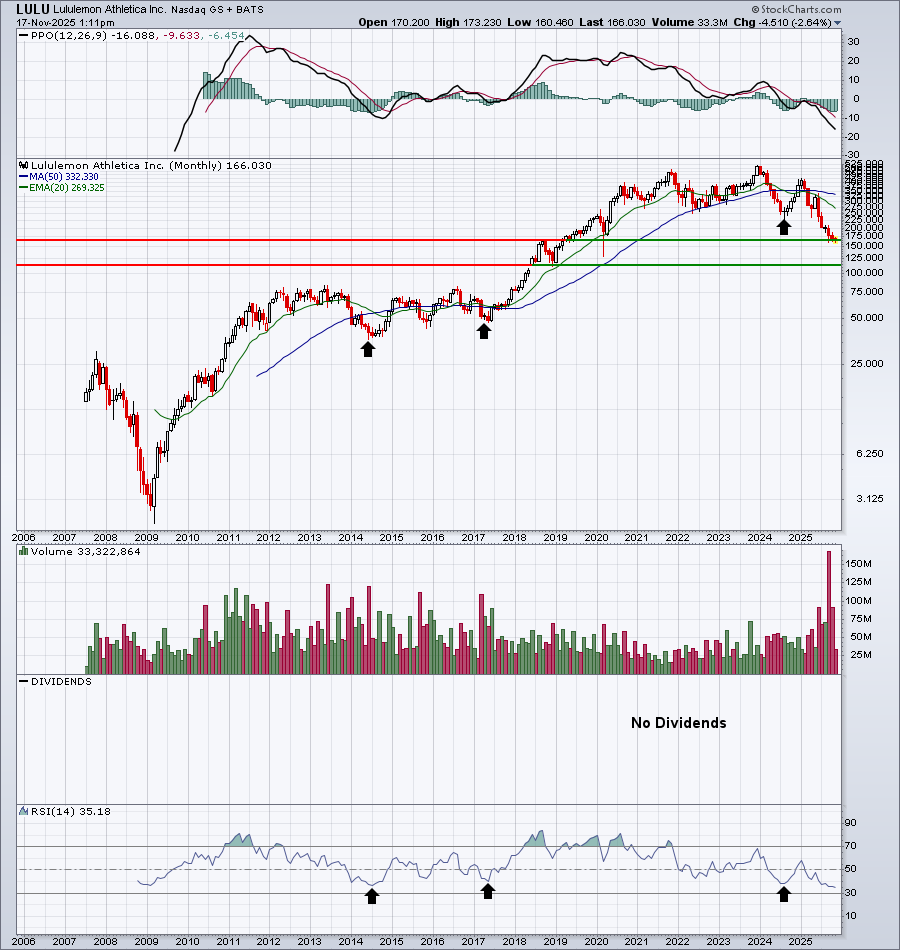
Historically, solid companies with monthly RSIs down at 40 represent solid entries. LULU's is now at 35 and it's reached the 40 level in the past, only to see the stock bounce considerably each time. There's certainly risk with any company downtrending as it could continue for the foreseeable future, so make sure you're comfortable with the risk. Please consult your own financial advisor before buying or selling any securities.
TTD:
This one probably carries much more risk and software companies do come and go more often than many industries as technology changes rapidly and many companies simply don't keep up. TTD has been around for awhile, however, and for much of its existence, it's been a leader. So for that reason, I'm viewing this massive selloff as an opportunity:
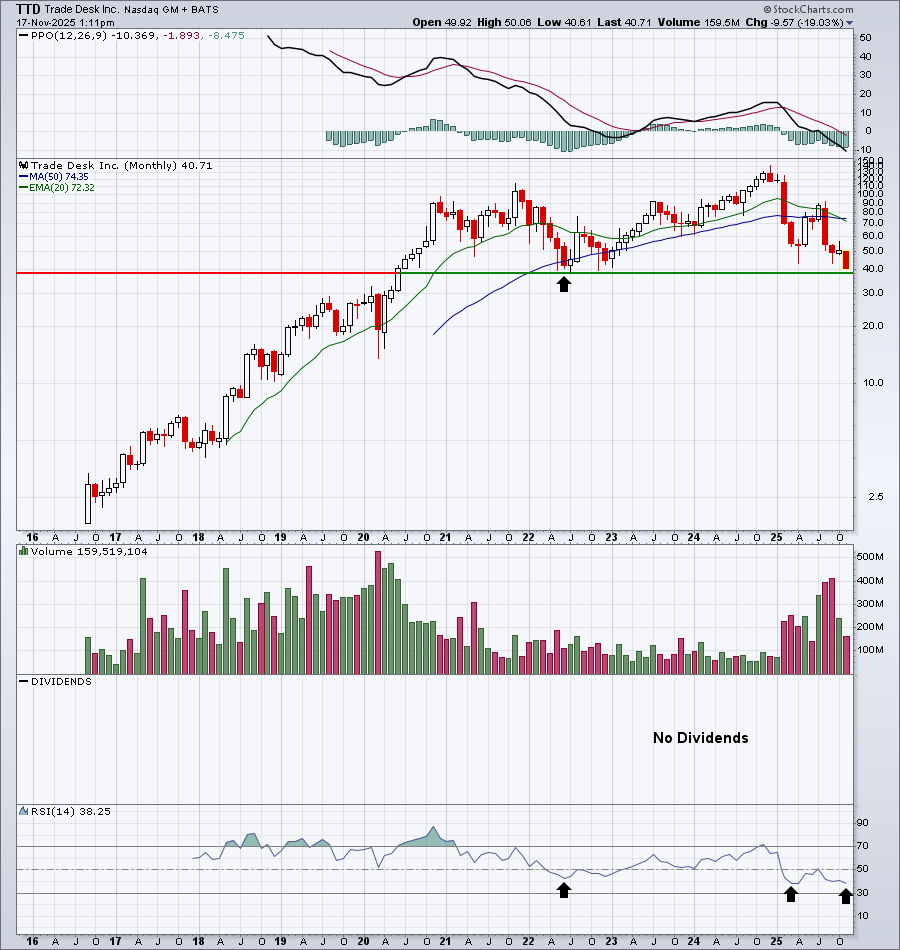
TTD is approaching what I'd consider to be excellent long-term price support. If it fails to hold, even a long-term investor could simply say "goodbye" and sell it.
Keep in mind that our Weekly Market Reports favor those who are more interested in the long-term market picture. Therefore, the list of stocks above are stocks that we believe are safer (but nothing is ever 100% safe) to own with the long-term in mind. Nearly everything else we do at EarningsBeats.com favors short-term momentum trading, so I wanted to explain what we're doing with this list and why it's different.
Also, please keep in mind that I'm not a Registered Investment Advisor (and neither is EarningsBeats.com nor any of its employees) and am only providing (mostly) what I believe to be solid dividend-paying stocks for the long term. Companies periodically go through adjustments, new competition, restructuring, management changes, etc. that can have detrimental long-term impacts. Neither the stock price nor the dividend is ever guaranteed. I simply point out interesting stock candidates for longer-term investors. Do your own due diligence and please consult with your financial advisor before making any purchases or sales of securities.
Looking Ahead
Upcoming Earnings
The following list of companies is NOT a list of all companies scheduled to report quarterly earnings, however, just key reports, so please be sure to check for earnings dates of any companies that you own. Any company in BOLD represents a stock in one of our portfolios and the amount in parenthesis represents the market capitalization of each company listed:
- Monday: None
- Tuesday: HD ($366 billion), PDD ($187 billion), MDT ($123 billion)
- Wednesday: NVDA ($4.5 trillion), TJX ($163 billion), PANW ($140 billion), LOW ($130 billion)
- Thursday: WMT ($818 billion), INTU ($181 billion), NTES ($90 billion)
- Friday: None
Key Economic Reports
- Monday: November empire state manufacturing survey, August construction spending
- Tuesday: October industrial production & capacity utilization, August factory orders, August business inventories
- Wednesday: November Philadelphia Fed manufacturing survey, October housing starts & building permits, FOMC minutes
- Thursday: September nonfarm payrolls, initial jobless claims, October existing home sales, October leading economic indicators
- Friday: November consumer sentiment
The government shutdown has ended, so we should expect a flood of economic reports out, beginning later this week with September's nonfarm payrolls.
Historical Data
I'm a true stock market historian. I am absolutely PASSIONATE about studying stock market history to provide us more clues about likely stock market direction and potential sectors/industries/stocks to trade. While I don't use history as a primary indicator, I'm always very aware of it as a secondary indicator. I love it when history lines up with my technical signals, providing me with much more confidence to make particular trades.
Below you'll find the next two weeks of historical data and tendencies across the three key indices that I follow most closely. The percentage for each calendar day represents the annualized return for that day. An example of how this is calculated is reflected next to the first day under the S&P 500 and in parenthesis:
S&P 500 (since 1950)
- Nov 17: +0.74% (Ex: cumulative gains = +0.15% over 52 trading days since 1950. +% x 253/52 = +0.74%)
- Nov 18: -2.31%
- Nov 19: -85.30%
- Nov 20: -27.63%
- Nov 21: +55.14%
- Nov 22: +3.28%
- Nov 23: +49.61%
- Nov 24: +125.29%
- Nov 25: +34.27%
- Nov 26: +58.57%
- Nov 27: +49.40%
- Nov 28: +31.94%
- Nov 29: +7.99%
- Nov 30: +19.90%
NASDAQ (since 1971)
- Nov 17: -12.31%
- Nov 18: +2.93%
- Nov 19: -100.25%
- Nov 20: -78.61%
- Nov 21: +67.22%
- Nov 22: -11.17%
- Nov 23: +34.13%
- Nov 24: +222.36%
- Nov 25: +48.61%
- Nov 26: +80.45%
- Nov 27: +61.34%
- Nov 28: +57.67%
- Nov 29: +1.44%
- Nov 30: -21.23%
Russell 2000 (since 1987)
- Nov 17: -10.61%
- Nov 18: +6.06%
- Nov 19: -141.29%
- Nov 20: -62.40%
- Nov 21: +69.32%
- Nov 22: +18.45%
- Nov 23: +63.10%
- Nov 24: +251.02%
- Nov 25: +91.90%
- Nov 26: +12.19%
- Nov 27: +23.42%
- Nov 28: +63.14%
- Nov 29: +44.73%
- Nov 30: +45.26%
The S&P 500 data dates back to 1950, while the NASDAQ and Russell 2000 information date back to 1971 and 1987, respectively.
Final Thoughts
I'm definitely not a fan of how the interest-rate-sensitive stocks are trading right now. It appears that Fed Chief Powell and his waffling gang are at it again, quite possibly ready to stop the interest rate cuts - almost before they got started. Wall Street does not like uncertainty and the Fed seems to create more of it than anyone. I can assure you that this is not a politically-motivated statement. I didn't like Powell under the Biden Administration and I don't like Powell under the Trump Administration. It's not a political thing. It's a Powell thing. Name me another Fed Chief who's presided over 4 bear markets in 7 years. (Hint: there are none)
Here are a few things I'm thinking about as we head towards NVIDIA Corp's (NVDA) earnings report on Wednesday after the close:
Government Shutdown. It's over! While I thought it might provide a spark to the market, it's instead coincided with selling in many areas, especially interest-rate-sensitive areas and growth stocks. Among growth stocks, mid-cap names have been hit the hardest.
Head & Shoulders Top. The small cap Russell 2000 had printed a head & shoulders topping pattern, which I didn't think would execute, but I was wrong. We saw the violation last week and the IWM closed on two consecutive sessions beneath that neckline. A trip down to 220-225 is a very real possibility, based upon the pattern measurement. I don't believe the IWM's relative strength is gone, but it does appear that another interest rate cut is losing support on the charts, which could mean further IWM relative strength will be delayed. The charts can change, but that's what I'm seeing right now.
Earnings. NVDA is coming up Wednesday. Walmart (WMT) is another big name reporting. Earnings season has clearly slowed, but there are still some big names on deck.
Seasonality. It seems as though seasonality has been turned on its head in Q4. Obviously, seasonality doesn't guarantee us results, but it does provide tendencies. After Thursday of this week, the tendencies from November 21st through the first week of December turned extremely bullish. You can see the numbers in the Historical Data section above. We'll see if this one holds true.
Options Expiration. Friday marks November options expiration. Usually this week is bearish, but usually we're moving higher through the first half of November. That hasn't been the case in November 2025, especially among many of the growth names impacted by options expiration. It'll be interesting, so be sure to tune into our Max Pain event on Tuesday after the close.
Happy trading!
Tom