
EB Weekly Market Report (WARNING) - Monday, December 1, 2025
EXITING ALL PORTFOLIOS
Out of an abundance of caution, we are exiting our portfolios and moving to cash as of today's close. I'm seeing several warning signs that simply make investing much riskier. There are no guarantees of an impending drop in the days and weeks ahead. Rather, risks are increasing. It's as simple as that. I wanted to see the character of a market rally and, quite honestly, I didn't like what I saw last week. Sure, the gains were nice. But growth really didn't lead and, considering that the odds have increased substantially for a rate cut, that makes little sense to me. In other words, the market is telling us a story of potential danger ahead at a time when the 253-day equity only put call ratio ($CPCE) has turned up, negative divergences have emerged, and money is rotating in defensive fashion.
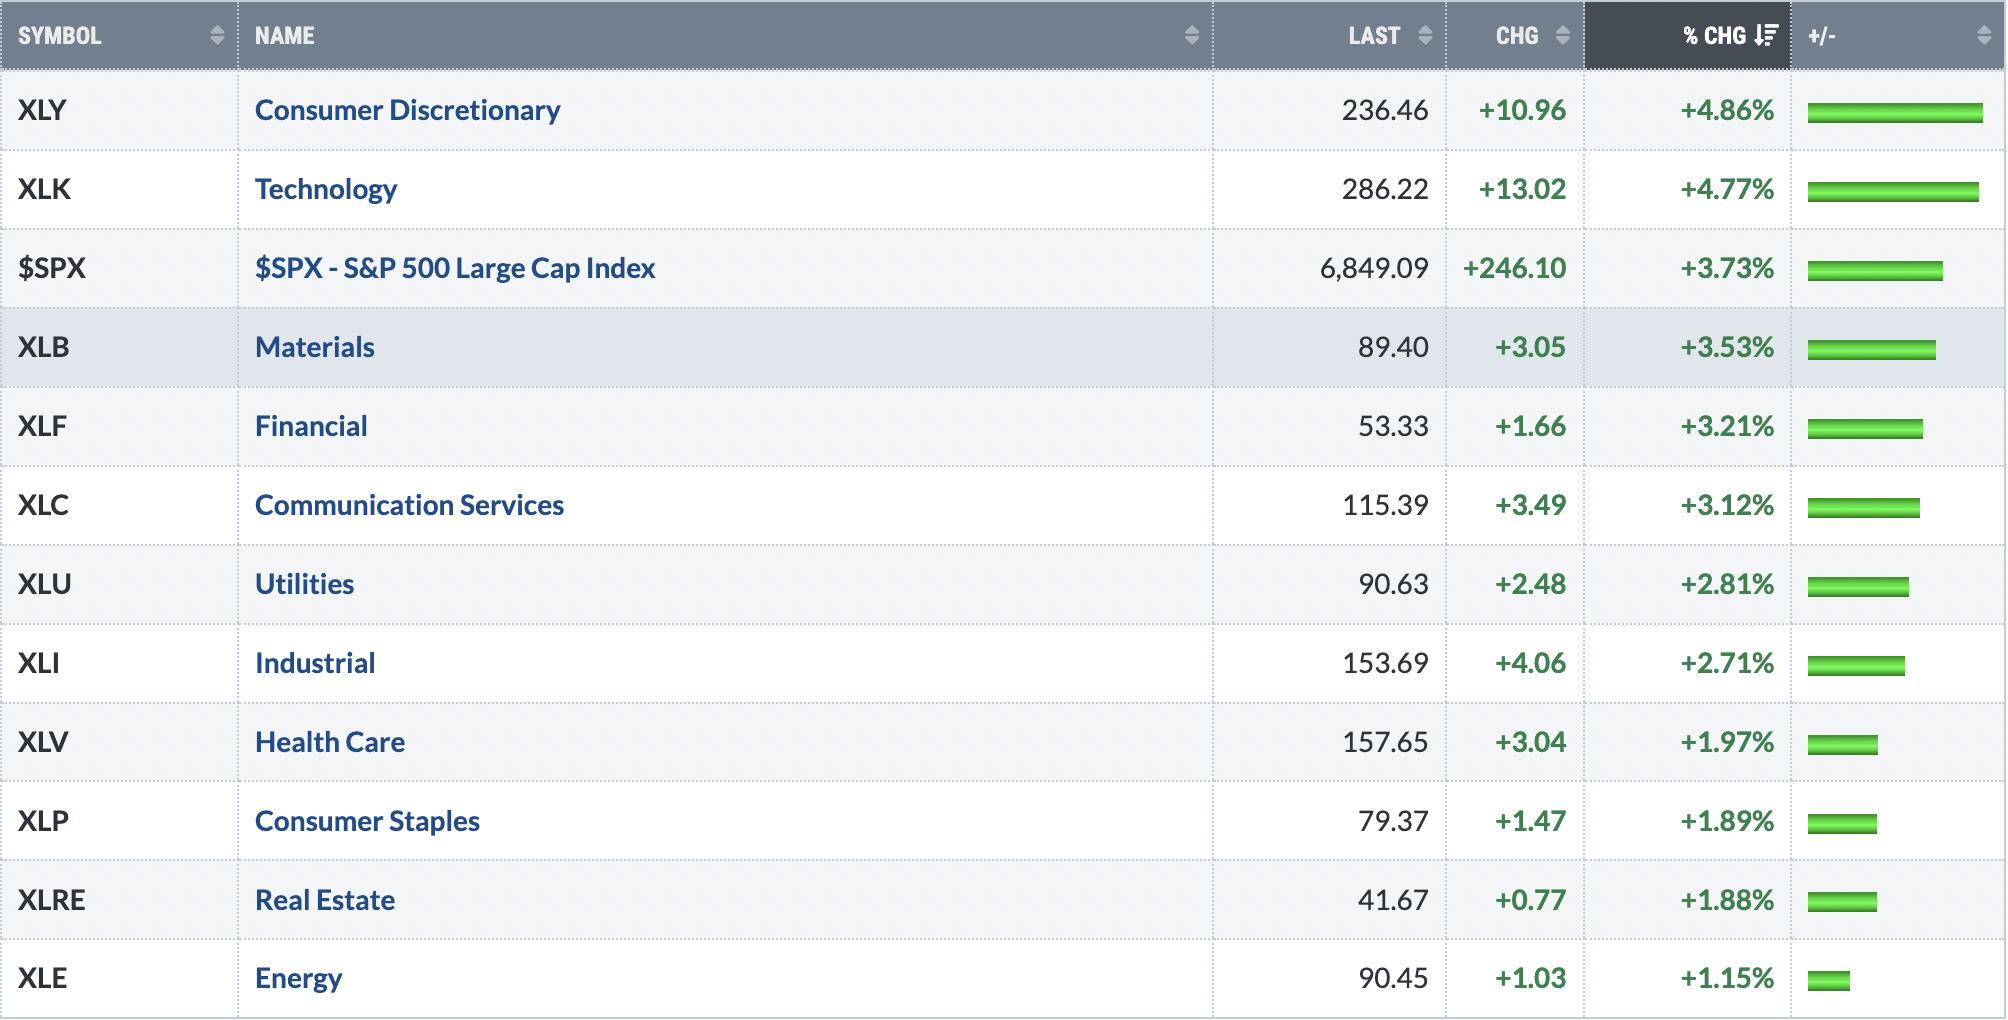
While the S&P 500 has recovered to near another all-time high, the 1-month sector returns are telling. Health care (XLV, +7.89%) and consumer staples (XLP, +4.10%) are among sector leaders, while technology (XLK, -4.87%) is dead last. Defense is leading this latest attempt at a breakout.
If conditions change, I'll let you know. But, for now, caution makes sense.
ChartLists/Spreadsheets
None of our ChartLists/Spreadsheets were updated over the weekend as we took time off for the Thanksgiving Day holiday in the U.S. We'll update our ChartLists and spreadsheet again at the end of this week.
Weekly Market Recap
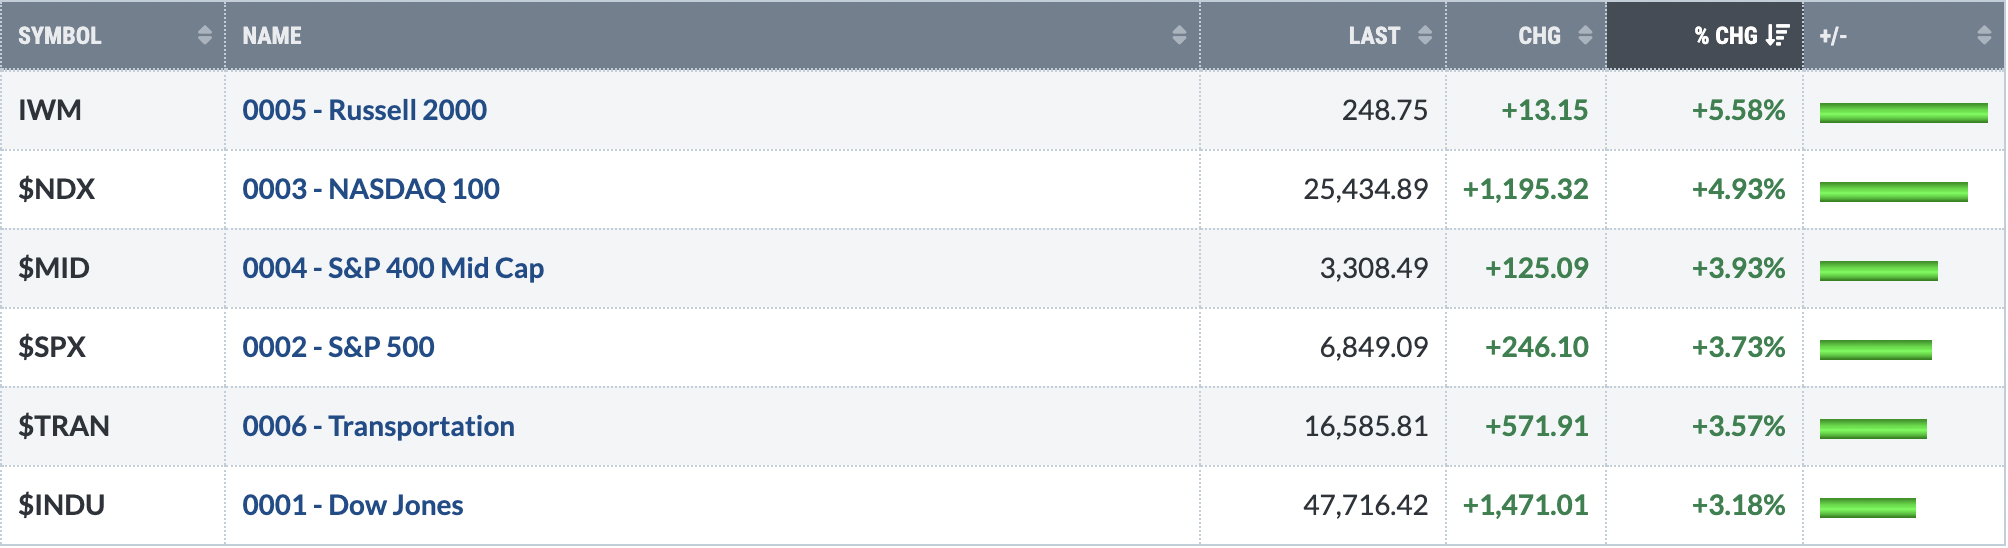
Major Indices
Sectors
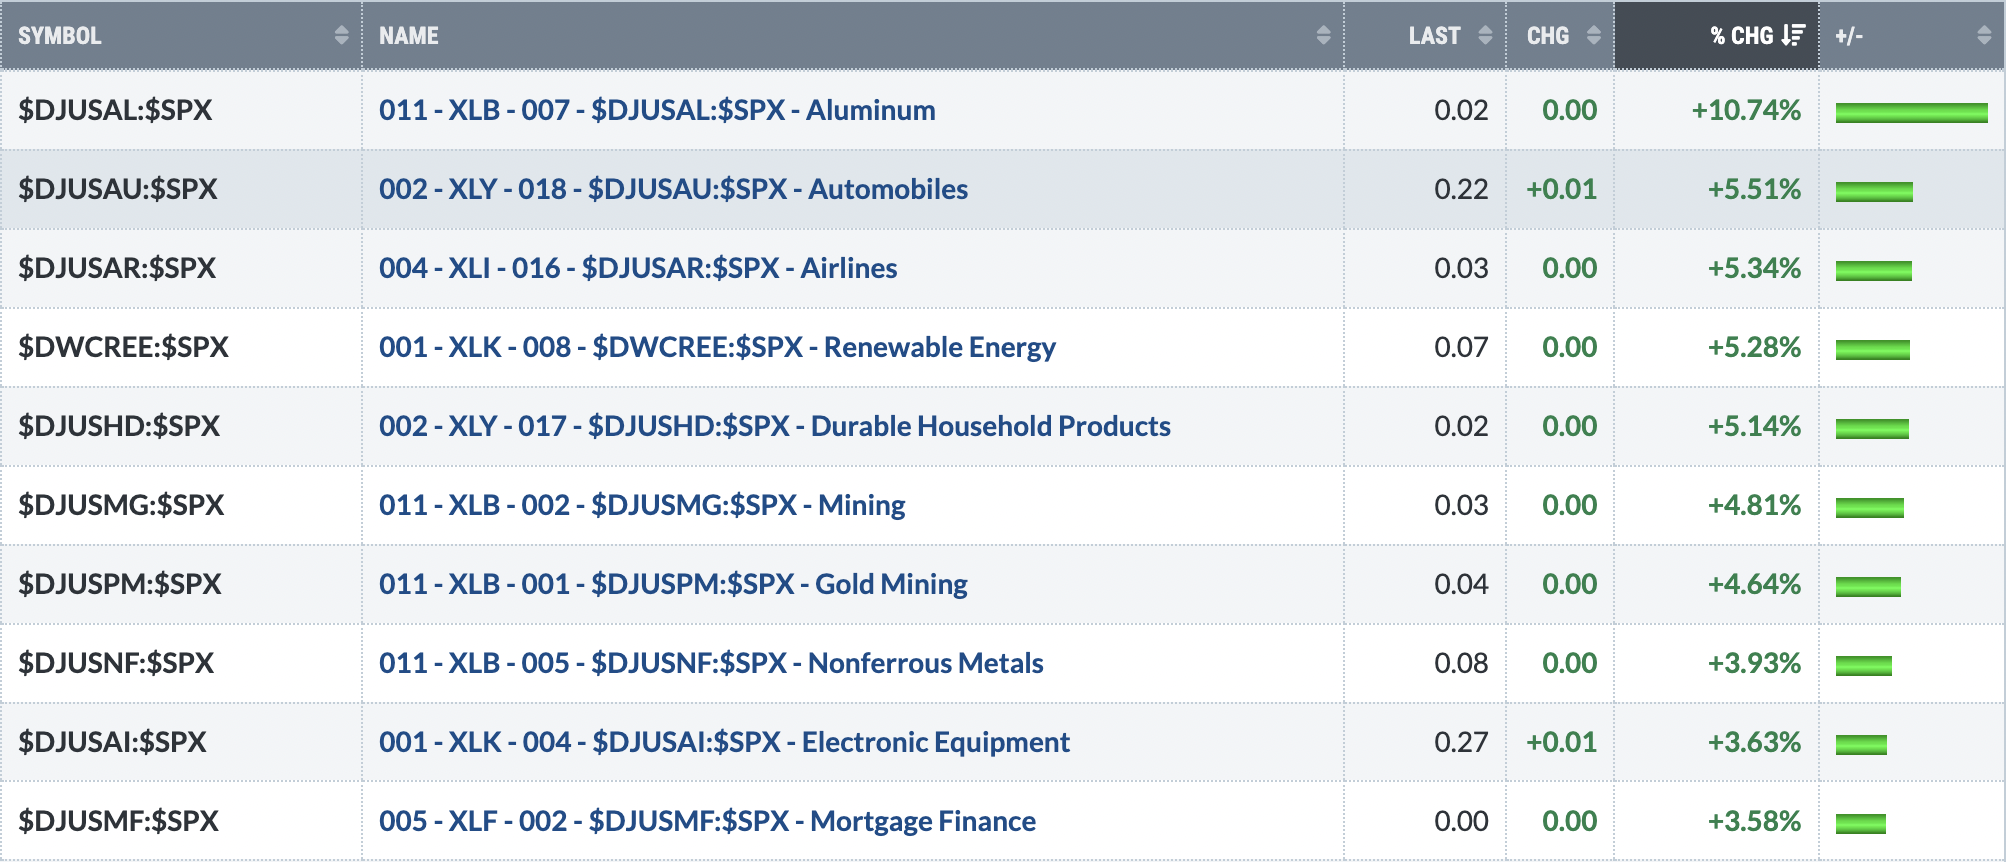
Top 10 Industries Last Week
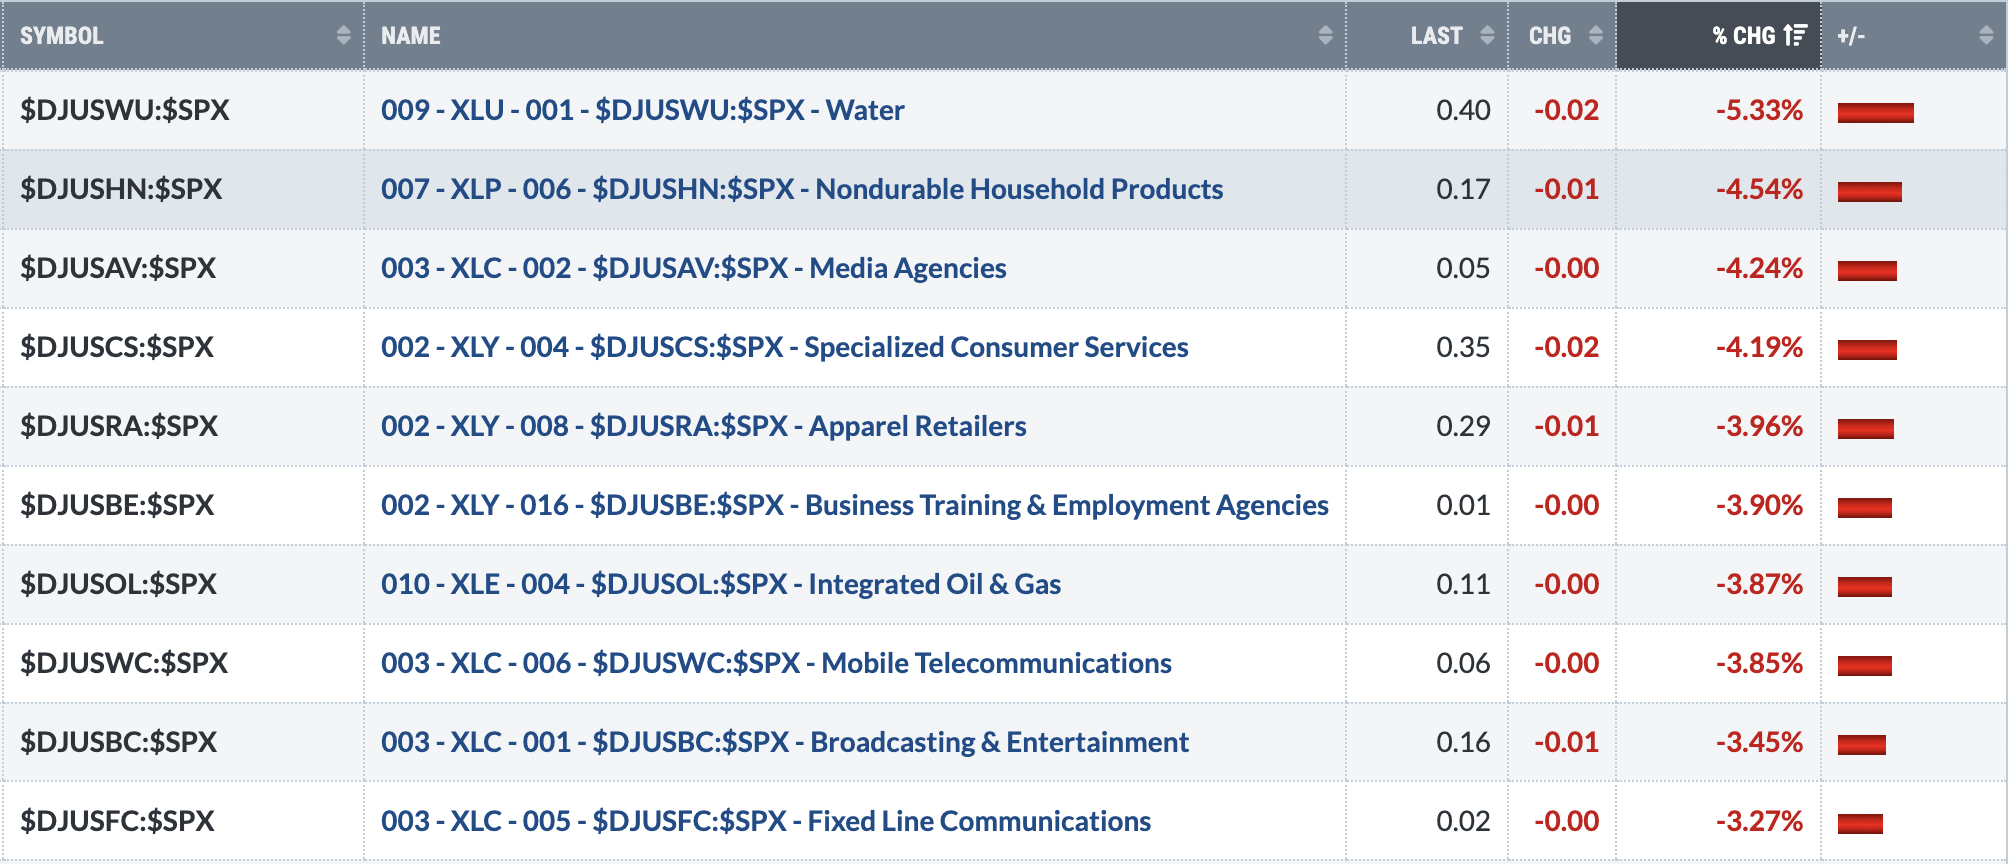
Bottom 10 Industries Last Week
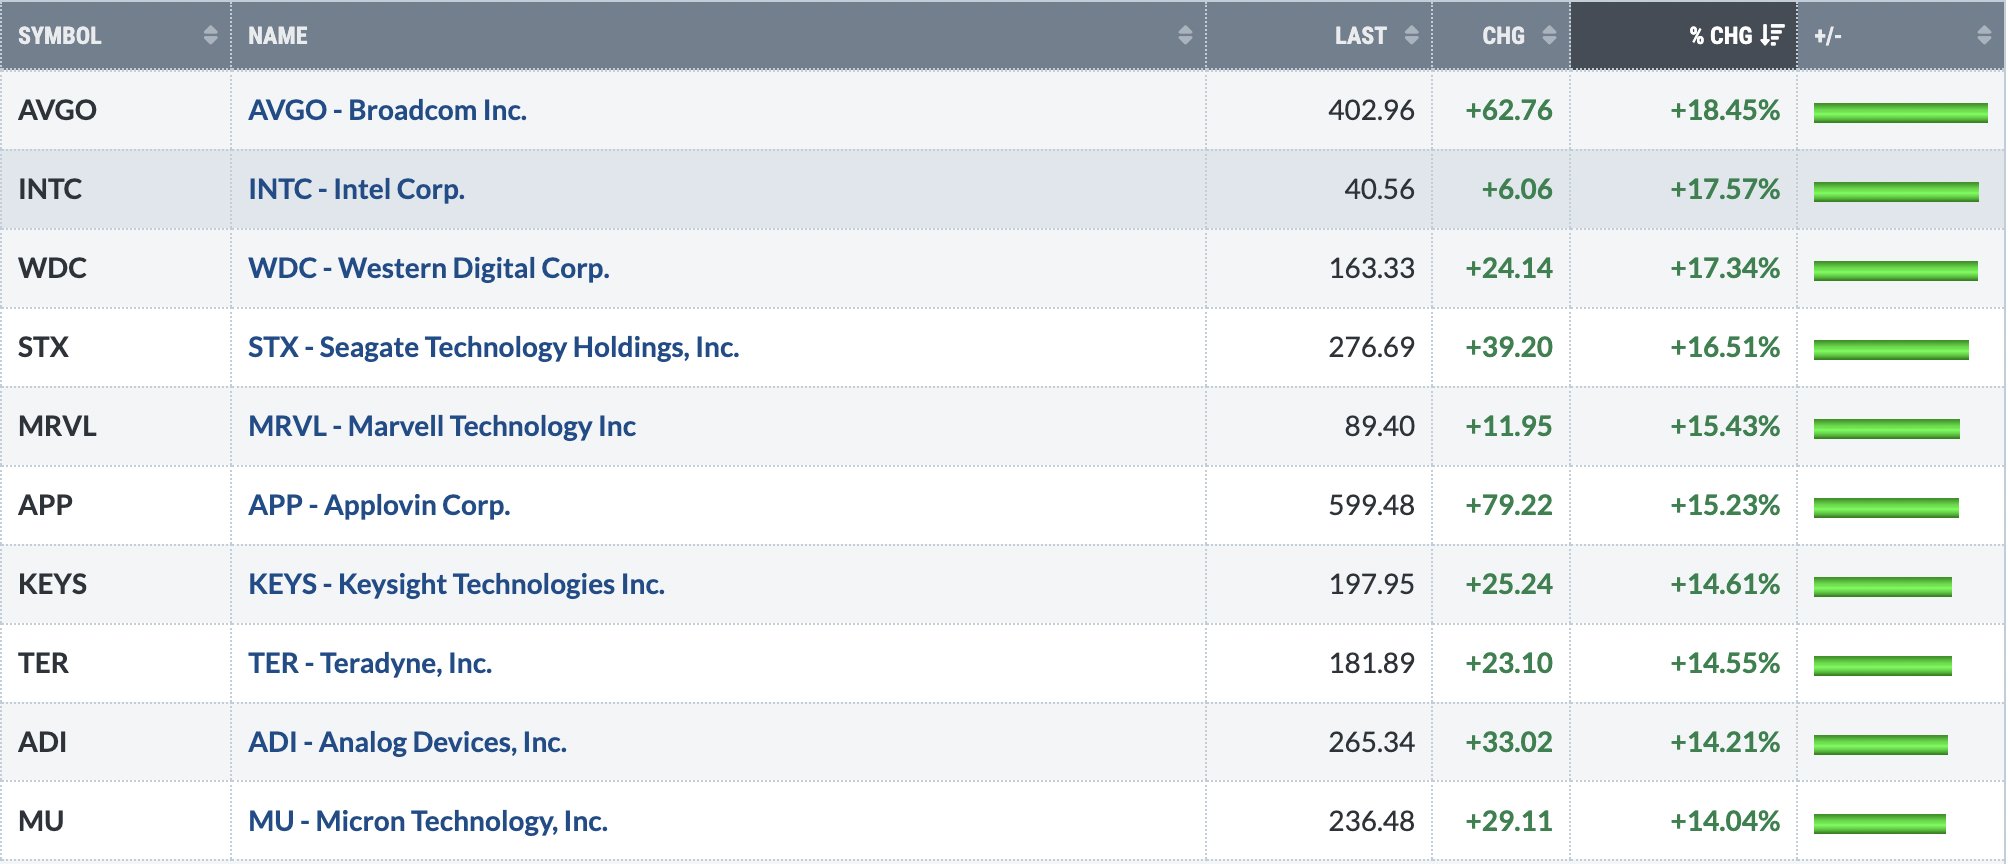
Top 10 Stocks - S&P 500/NASDAQ 100
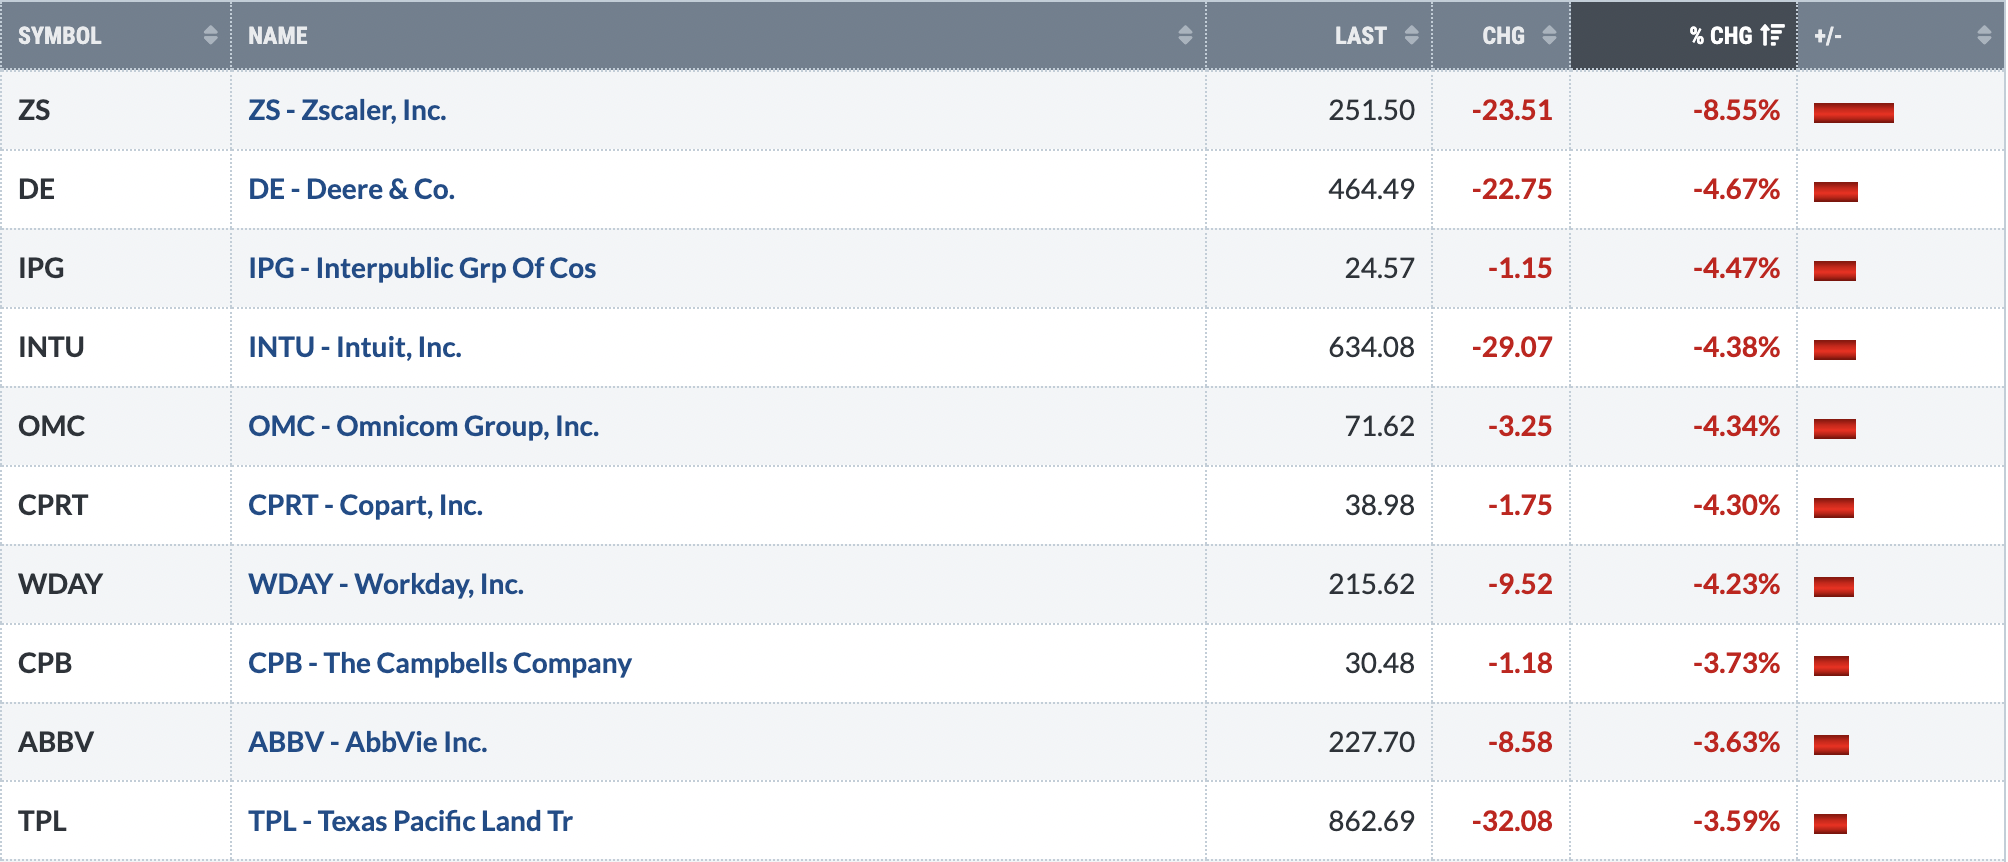
Bottom 10 Stocks - S&P 500/NASDAQ 100
Big Picture
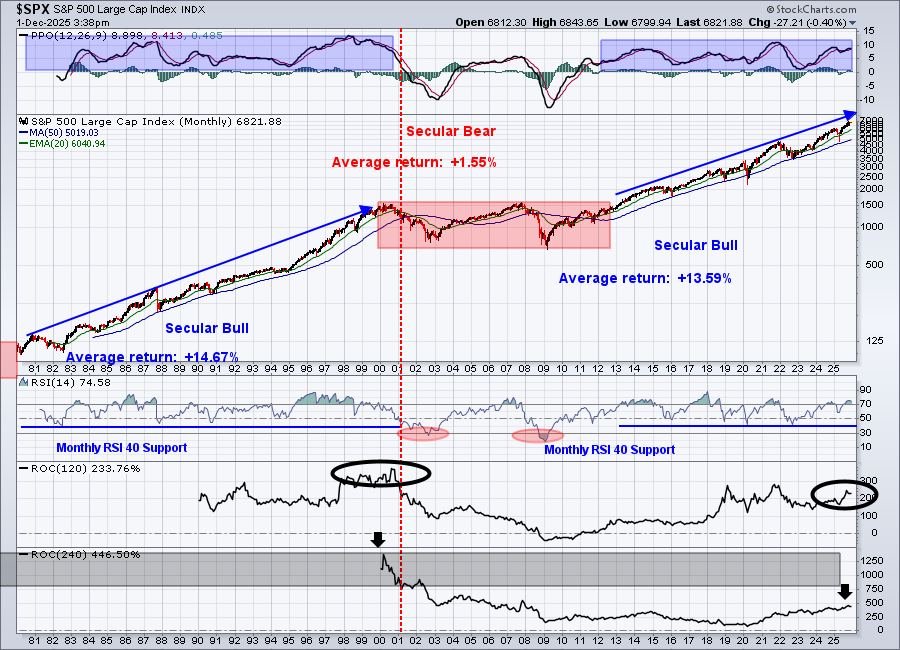
Not much has changed here - either during the November selling or the recent strong recovery. It's the primary reason why I would continue to remain long from a long-term perspective and stay the bullish course.
Sustainability Ratios
Here's the latest look at our key intraday ratios as we follow where the money is traveling on an INTRADAY basis (ignoring gaps):
QQQ:SPY
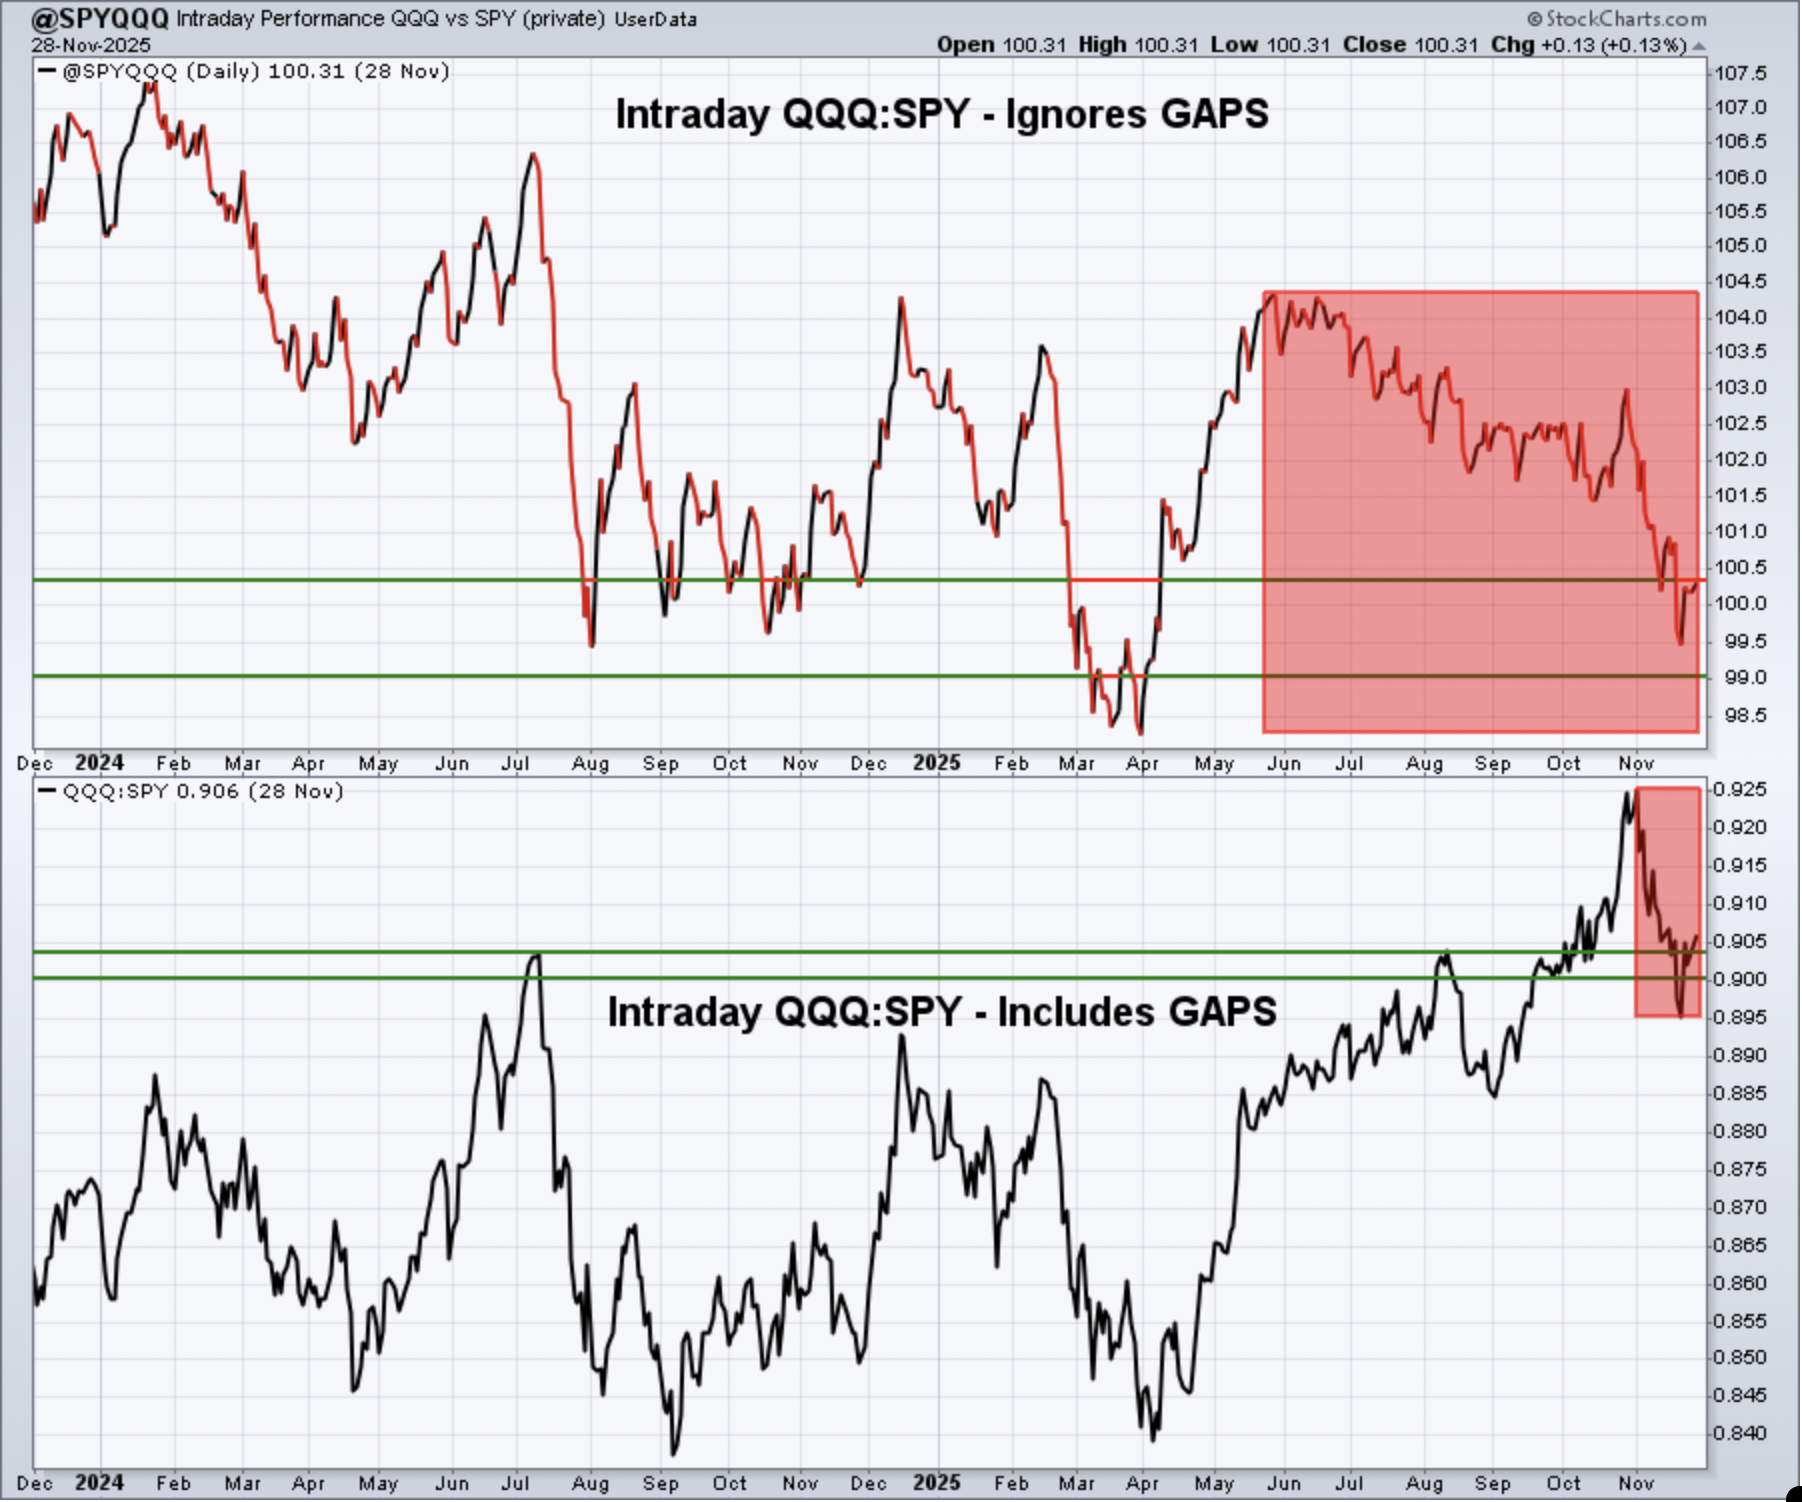
Keep in mind that the intraday analysis provided is a "work in progress". I continue to analyze this data to see if it helps provide us clues about calling market direction. It makes common sense to me that it should help in some sense, but it'll require a much longer-term study to determine its worth. For now, though, you can see that money seems to be rotating during the day more towards the S&P 500, suggesting that as the more growth-oriented NASDAQ rises, more of that increase is due to opening gaps and less is due to intraday accumulation.
I will say that I don't believe any one signal will ever provide us answers as to market direction. All of our information needs to be considered together. Tops form for different reasons, so trying to use just one signal, I believe, will send many false signals.
I am beginning to see a few signals, however, that are questioning the sustainability of the current rally. I think we learn a lot more about market strength during rallies than we do during selloffs. During this latest rally, aggressive areas are not really seeing a lot of relative buying and that is worrisome. This situation is definitely worth monitoring.
IWM:QQQ
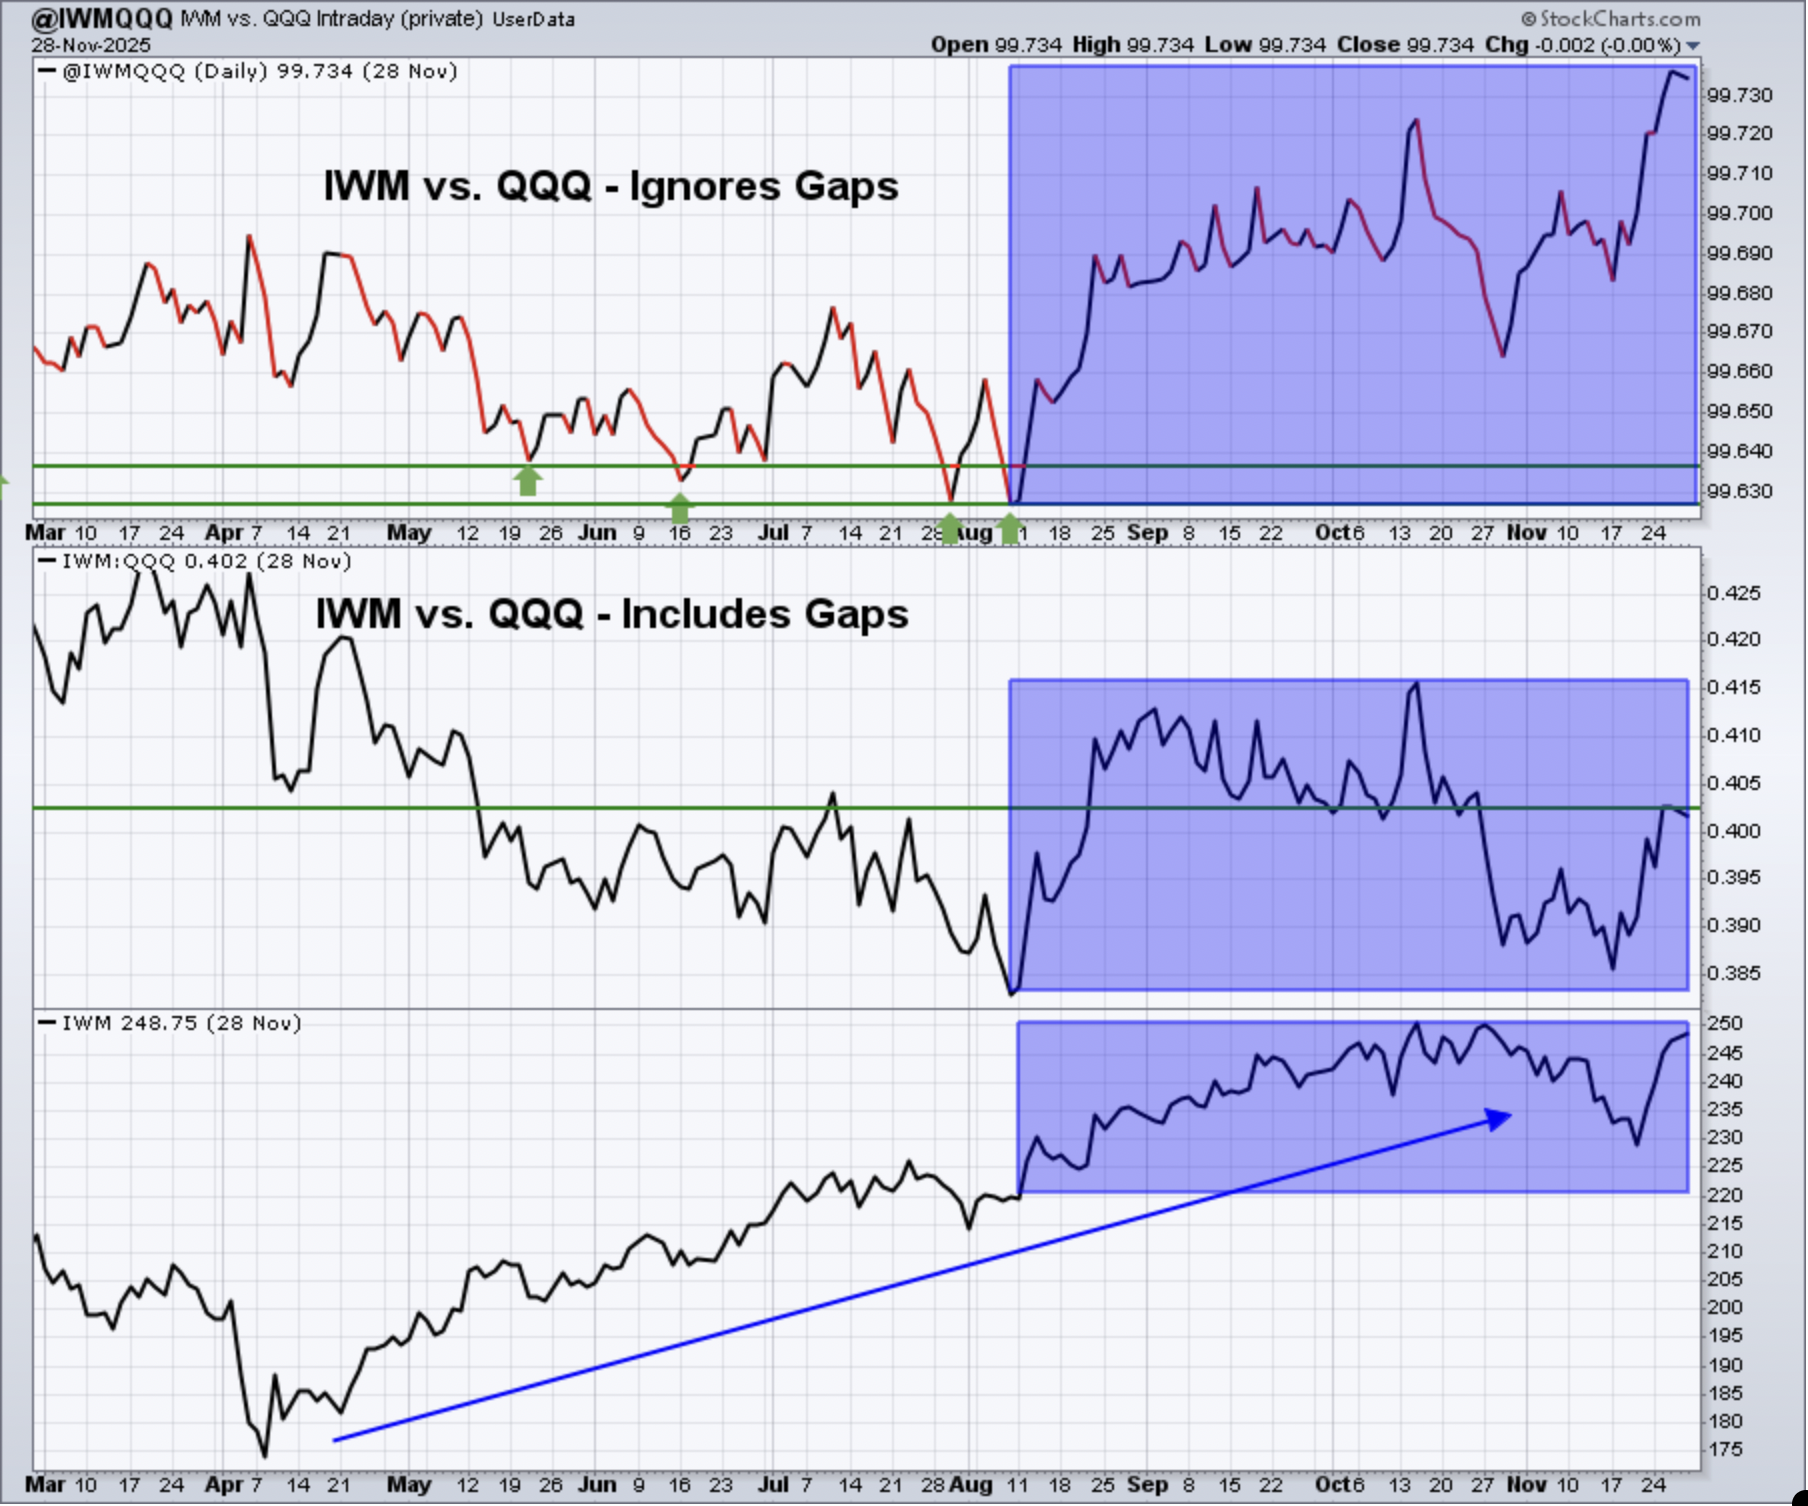
Money has rotated back into small caps and has done so quite rapidly. This rotational surge has the small cap IWM on the verge of another breakout.
XLY:XLP
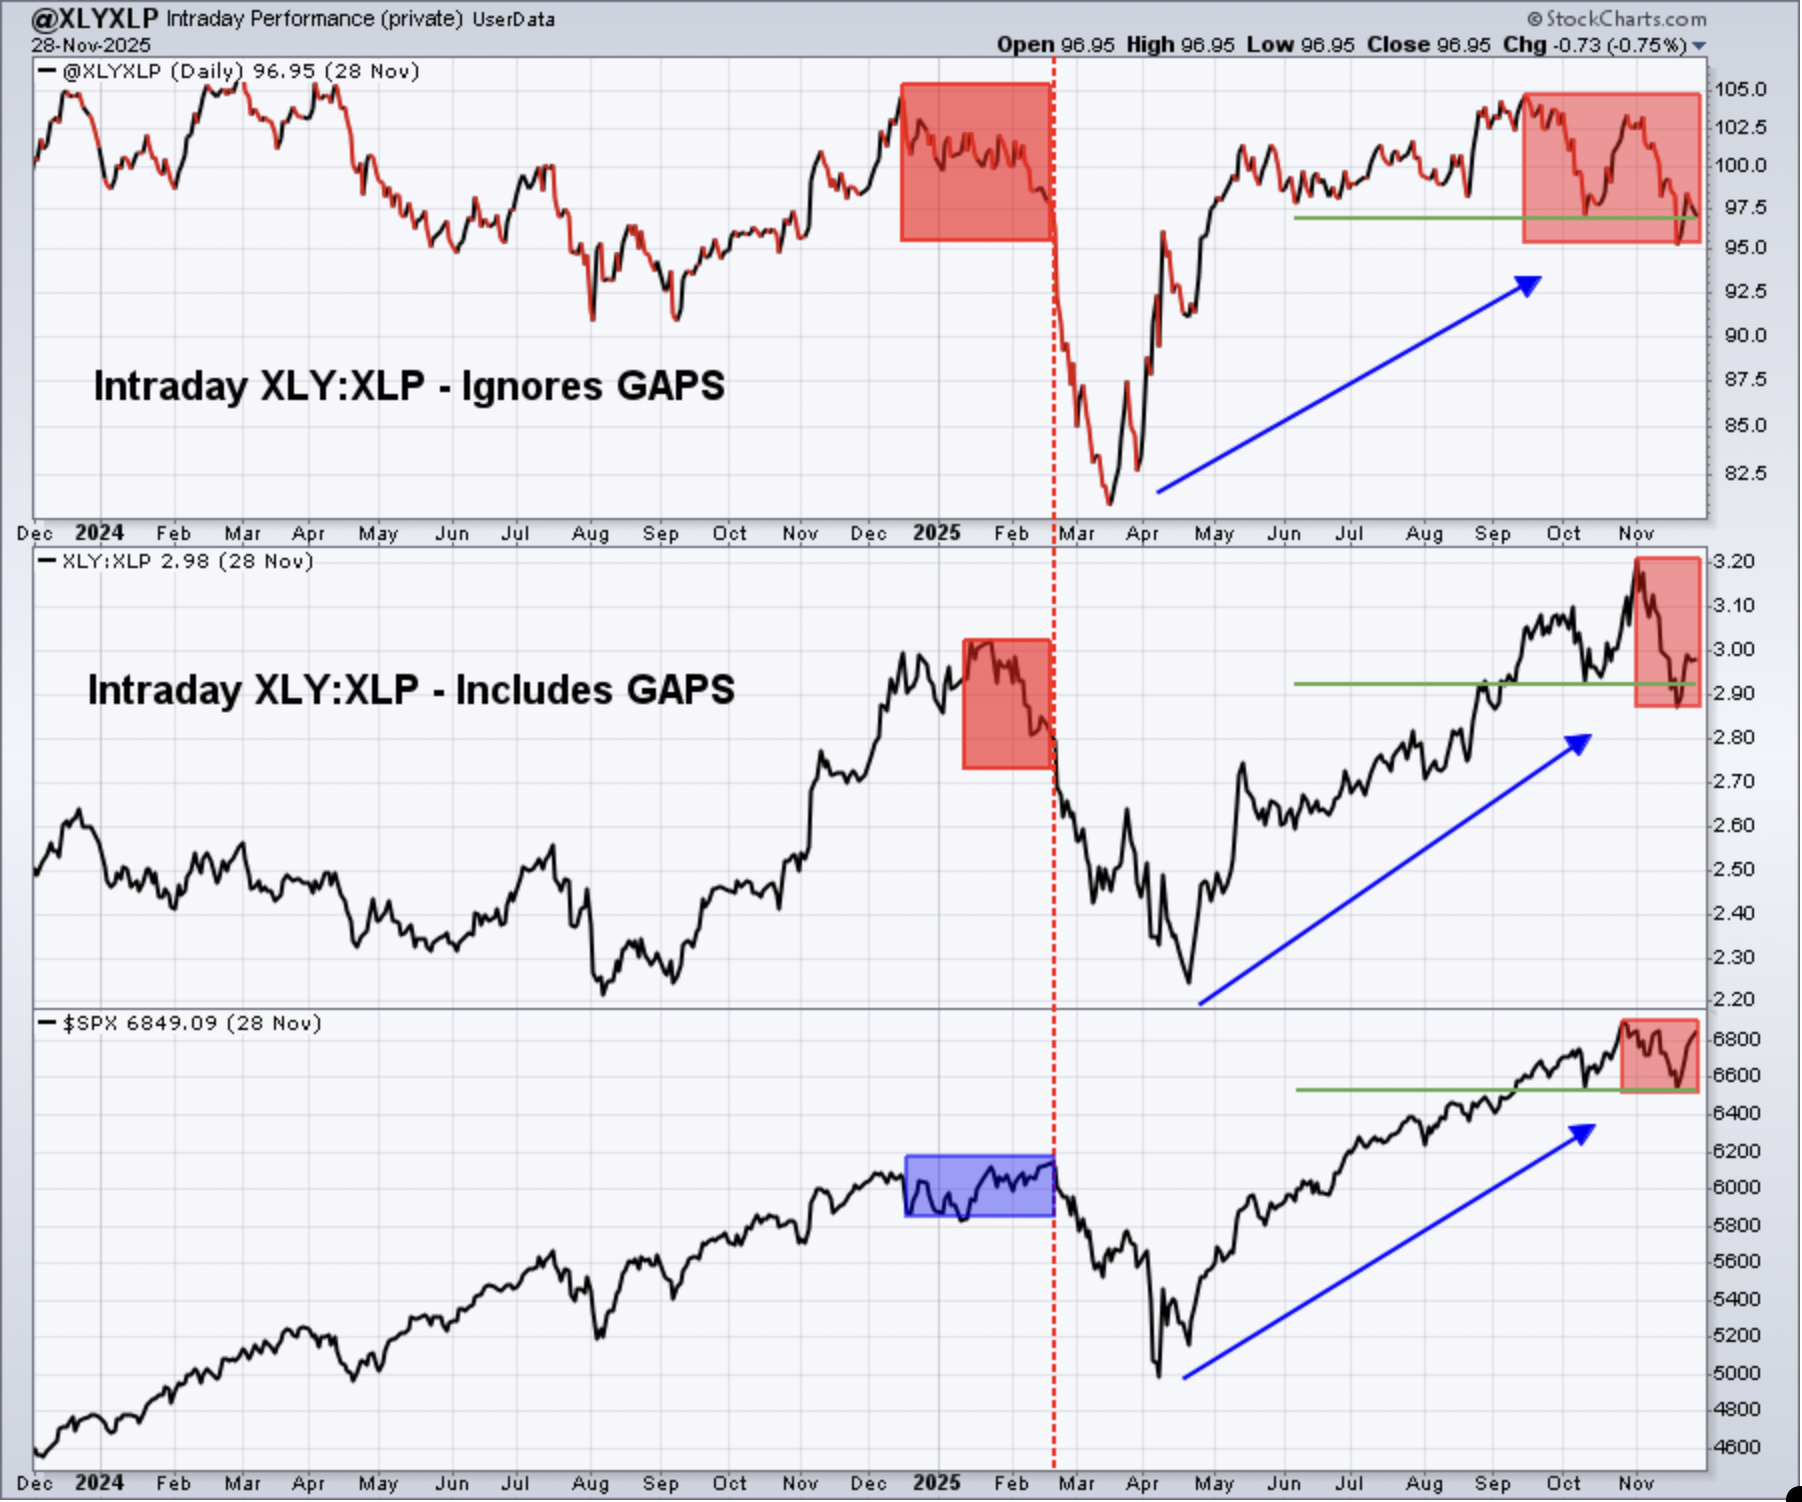
Both "including gaps" and "excluding gaps" charts remain in a long-term uptrend, but the continuing down trend over the past several weeks, even with the market rally last week, has suggested that we begin to question the rally's sustainability. Note that the S&P 500 bounced all the way back up to within a whisker of another all-time high. Our XLY:XLP ratios, however, have seen a much milder bounce and are nowhere near their relative highs. This could be a signal of Wall Street rotation to defense.
Sentiment
5-day SMA ($CPCE)
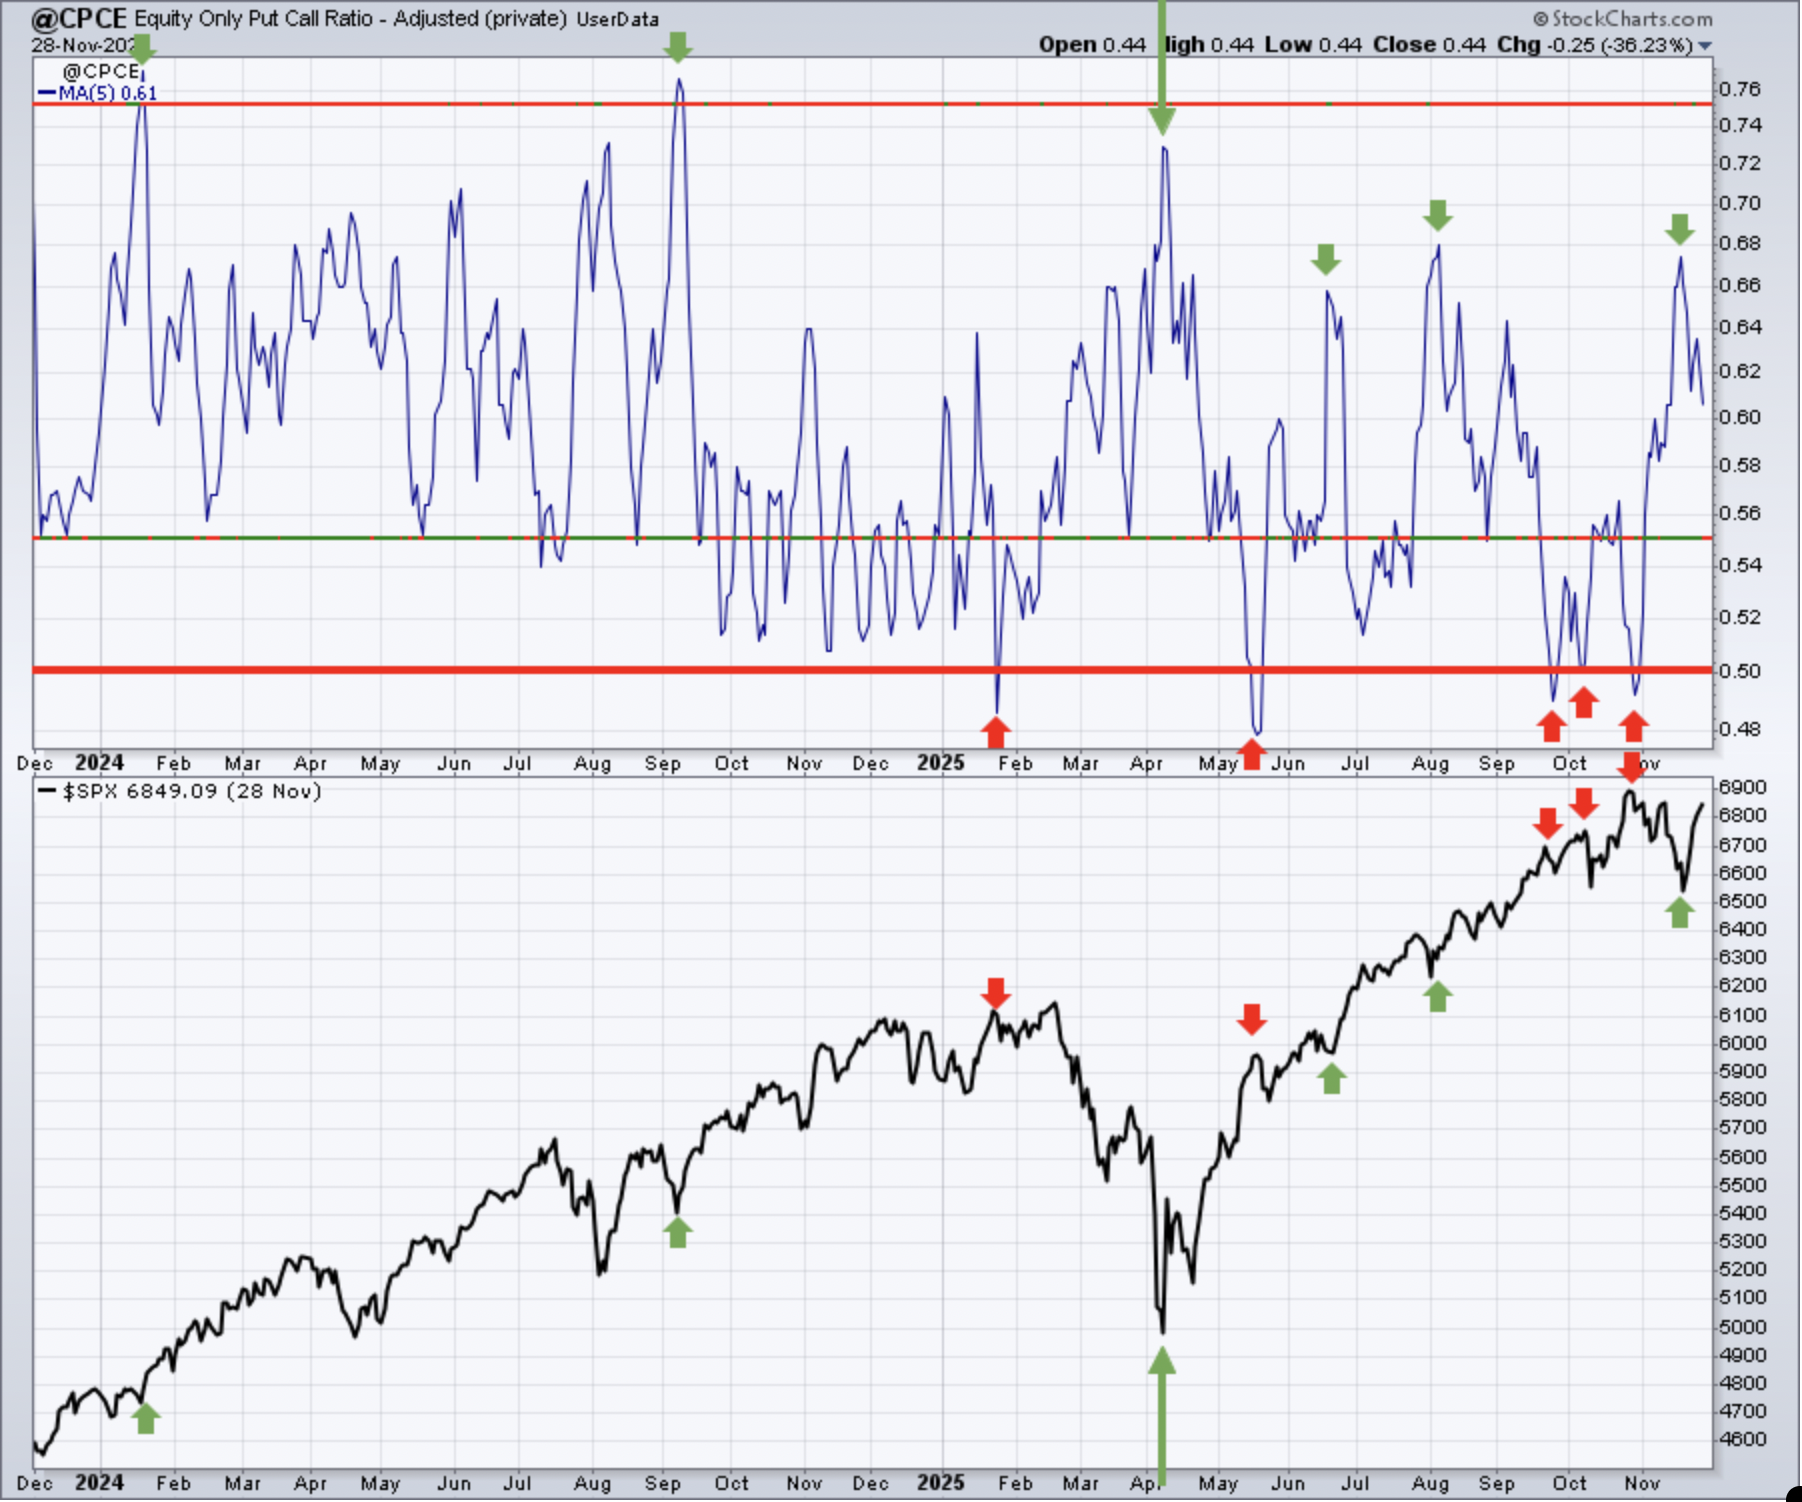
Sentiment indicators are contrarian indicators. When they show extreme bullishness, we need to be a bit cautious and when they show extreme pessimism, it could be time to become much more aggressive. Major market bottoms are carved out when pessimism is at its absolute highest level.
Keep in mind that the above 5-day SMA reading of the CPCE is our "speed boat" sentiment indicator that changes quite frequently. This sentiment indicator is now in "neutral" territory in the .60s. Historically, we don't grow excessively pessimistic, where bottoms form, until this 5-day moving average reaches .75. It's worth noting, however, that the mid-.60s area, more recently, has predicted short-term market bottoms.
253-day SMA ($CPCE)
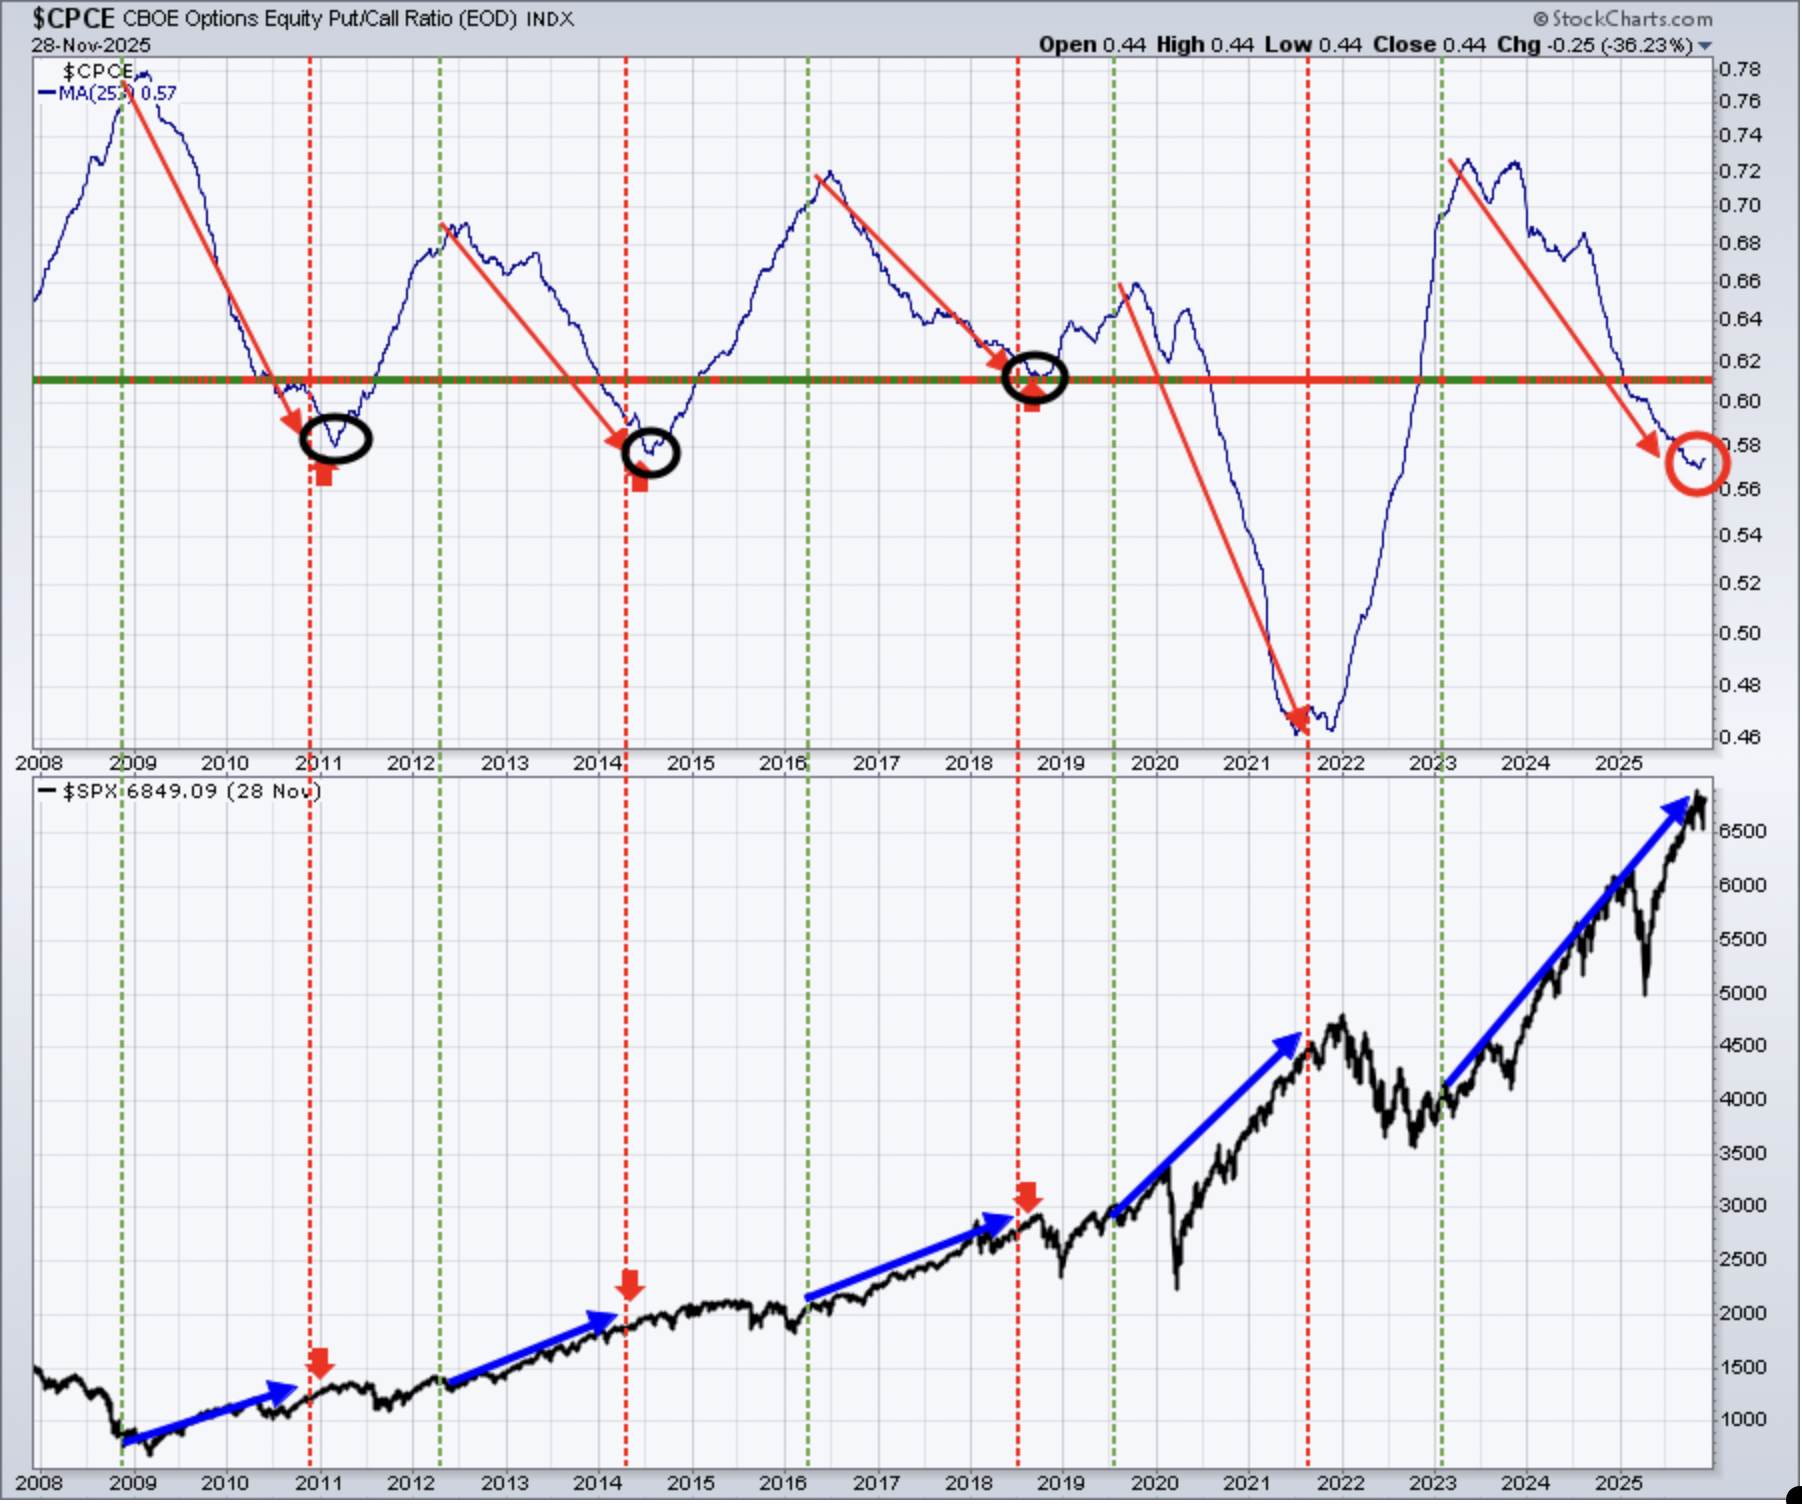
This longer-term 253-day SMA of the CPCE is our "ocean-liner" signal, unlike our short-term speedboat indicator. It is absolutely noteworthy that this 253-day signal appears to be turning back higher (red circle) off the recent low. I'd say that risks are definitely increasing, though I wouldn't say that another bear market is upon us.
Growth vs. Value
I like to follow how growth stocks (IWF) perform relative to value stocks (IWD). It gives me a sense of whether Wall Street is in a "risk on" type of market environment, which is what typically drives bull markets. I was especially interested in seeing how growth would perform relative to value on our next rally. Well, it wasn't very bullish. Check this out:
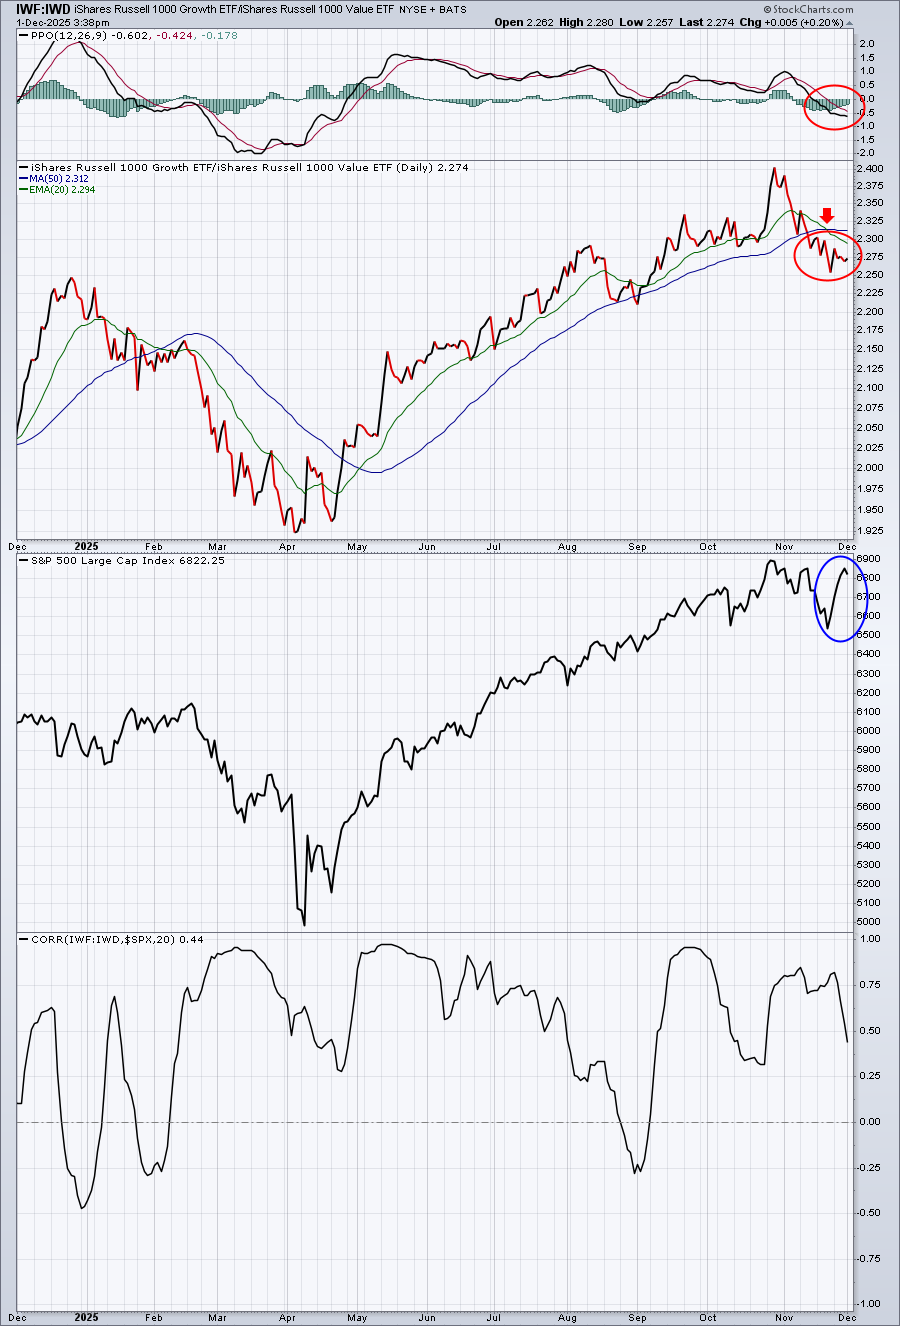
Why is Wall Street avoiding growth stocks on this rally attempt? While this market environment does not guarantee us a big decline ahead, it does tell us that the risks are elevated. I don't like putting my money at risk when I believe the risks of a larger decline are growing.
Long-Term Trade Setup
Since beginning this Weekly Market Report in September 2023, I've discussed the long-term trade candidates below that I really like. Generally, these stocks have excellent long-term track records, and many pay nice dividends that mostly grow every year. Only in specific cases (exceptions) would I consider a long-term entry into a stock that has a poor or limited long-term track record and/or pays no dividends. I try to review the long-term picture once a month or so. Below is a quick recap of how these stocks looked as of last month (I'll provide another update next week):
- JPM – challenging all-time highs after quarterly results were released
- BA – rolling over and losing 20-week EMA support not a great look
- FFIV – after months of great action, we've now seen 3 weeks of awful performance
- MA – testing 50-week SMA
- GS – very strong uptrend, nearly tripling over last 20 months
- FDX – appears to now be uptrending on weekly chart
- AAPL – setting new all-time highs last week
- CHRW – has nearly doubled off its April low
- JBHT – moving back through 155 price resistance was a big deal technically
- STX - very hot stock, has now more than quadrupled off its April low
- HSY – was unable to clear 200, then broke 20-week EMA support, want to see it hold 160
- DIS – 125 resistance remains the key
- MSCI – nice week last week, but still has significant resistance in 625-650 range
- SBUX - another in a lengthy consolidation period, needs to hold 70 on selling
- KRE – October reversal leaves the group perilously close to 57.50 support
- ED – 95 is the support I'm watching on the weekly chart
- AJG – after years of uninterrupted strength, AJG now finds itself in a downtrend
- NSC – railroads have been weak, but NSC's uptrend remains intact, watch 270 support
- RHI – one of the worst stocks of 2025, losing support near 28 is bearish
- ADM – recovery still intact, 20-week EMA, now rising at 56, is key support
- BG – has recovered 50% off February low and is currently trending higher
- CVS – traded in October at a near 3-year high
- IPG – consolidation continuing with support in 22.00-22.50 range
- HRL - losing 25 was bad technically and downtrend is worsening
- DE – bouncing slightly off 20-month EMA test
- LULU - basing between 160-190, but is it bottoming?; monthly RSI now in 30s
- TTD - trying to hang onto multi-year price support near 39-40
- META - nice bounce last week, but I wouldn't be surprised to see more difficulties and, possibly, lower prices ahead.
Keep in mind that our Weekly Market Reports favor those who are more interested in the long-term market picture. Therefore, the list of stocks above are stocks that we believe are safer (but nothing is ever 100% safe) to own with the long-term in mind. Nearly everything else we do at EarningsBeats.com favors short-term momentum trading, so I wanted to explain what we're doing with this list and why it's different.
Also, please keep in mind that I'm not a Registered Investment Advisor (and neither is EarningsBeats.com nor any of its employees) and am only providing (mostly) what I believe to be solid dividend-paying stocks for the long term. Companies periodically go through adjustments, new competition, restructuring, management changes, etc. that can have detrimental long-term impacts. Neither the stock price nor the dividend is ever guaranteed. I simply point out interesting stock candidates for longer-term investors. Do your own due diligence and please consult with your financial advisor before making any purchases or sales of securities.
Looking Ahead
Upcoming Earnings
The following list of companies is NOT a list of all companies scheduled to report quarterly earnings, however, just key reports, so please be sure to check for earnings dates of any companies that you own. Any company in BOLD represents a stock in one of our portfolios and the amount in parenthesis represents the market capitalization of each company listed:
- Monday: CRDO ($28 billion), MDB ($27 billion)
- Tuesday: CRWD ($126 billion), BNS ($85 billion), MRVL ($76 billion)
- Wednesday: CRM ($217 billion), RY ($215 billion), SNOW ($84 billion)
- Thursday: TD ($141 billion), BMO ($89 billion), CM ($80 billion)
- Friday: None
Key Economic Reports
- Monday: November PMI manufacturing, November ISM manufacturing
- Tuesday: None
- Wednesday: November ADP employment, September industrial production & capacity utilization (delayed), November PMI services, November ISM services
- Thursday: Initial jobless claims
- Friday: September personal income & spending (delayed), September PCE index (delayed), December consumer sentiment
Historical Data
I'm a true stock market historian. I am absolutely PASSIONATE about studying stock market history to provide us more clues about likely stock market direction and potential sectors/industries/stocks to trade. While I don't use history as a primary indicator, I'm always very aware of it as a secondary indicator. I love it when history lines up with my technical signals, providing me with much more confidence to make particular trades.
Below you'll find the next two weeks of historical data and tendencies across the three key indices that I follow most closely. The percentage for each calendar day represents the annualized return for that day. An example of how this is calculated is reflected next to the first day under the S&P 500 and in parenthesis:
S&P 500 (since 1950)
- Dec 1: +15.70% (Ex: cumulative gains = +3.29% over 53 trading days since 1950. +3.29% x 253/53 = +15.70%)
- Dec 2: +21.58%
- Dec 3: -36.62%
- Dec 4: +36.69%
- Dec 5: +35.03%
- Dec 6: +45.24%
- Dec 7: +22.82%
- Dec 8: +16.37%
- Dec 9: -10.35%
- Dec 10: +7.67%
- Dec 11: -36.52%
- Dec 12: +0.16%
- Dec 13: -0.13%
- Dec 14: -62.95%
NASDAQ (since 1971)
- Dec 1: +56.22%
- Dec 2: +45.01%
- Dec 3: -49.98%
- Dec 4: +30.44%
- Dec 5: +95.83%
- Dec 6: +17.81%
- Dec 7: +1.36%
- Dec 8: +53.51%
- Dec 9: -71.39%
- Dec 10: +50.65%
- Dec 11: -72.16%
- Dec 12: -18.85%
- Dec 13: -59.47%
- Dec 14: -109.19%
Russell 2000 (since 1987)
- Dec 1: -9.80%
- Dec 2: +117.14%
- Dec 3: -32.17%
- Dec 4: +34.90%
- Dec 5: +119.43%
- Dec 6: +51.19%
- Dec 7: -26.09%
- Dec 8: +93.55%
- Dec 9: -93.38%
- Dec 10: -22.33%
- Dec 11: -96.02%
- Dec 12: +2.91%
- Dec 13: -42.67%
- Dec 14: -87.43%
The S&P 500 data dates back to 1950, while the NASDAQ and Russell 2000 information date back to 1971 and 1987, respectively.
Final Thoughts
Well, I've got good news and bad news. The good news is that stocks rallied strongly throughout last week's holiday-shortened sessions and nearly reached all-time high territory. The bad news, however, is that aggressive areas of the market really didn't lead the charge. Our sustainability ratios didn't improve much, if at all. Here are a few things to consider and watch this week:
Negative Divergences. I'm seeing slowing momentum on the intraday, 60-minute (hourly) charts on our major indices, the XLK, XLY, XLC, and IWF (growth ETF). This is only a short-term potential warning sign, but it could morph into something more substantial given some of the issues discussed above.
Volatility ($VIX). During the abbreviated Friday session, the VIX did close back below 17 for the first time since the November selling started, but it's up more than 4% today and threatening to move back into the more dangerous 17-20 zone. If we see short-term selling from those 60-minute negative divergences, then I'd expect the VIX to push back higher in this "danger zone".
Seasonality. Seasonal patterns do remain quite strong for the month of December. Most December historical strength, however, has been felt more often in defensive sectors like real estate (XLRE) and consumer staples (XLP).
Jobs Report. The November ADP employment report will be out on Wednesday, but the November nonfarm payrolls report will be delayed until mid-December.
Bottom Line. I don't see a bear market ahead, but it wouldn't be shocking to see a 10% correction, possibly a bit more, given the changing market conditions.
Happy trading!
Tom