
EB Weekly Market Report - Monday, December 15, 2025
ChartLists/Spreadsheets
The following ChartLists/Spreadsheets were updated over the weekend:
- Strong Earnings (SECL)
- Strong Future Earnings (SFECL)
- Raised Guidance (RGCL)
- Bullish Trifecta (BTCL)
- Leading Stocks (LSCL)
- Hot Stocks (HTCL)
- Key Manipulation Spreadsheet
The above ChartLists and spreadsheet have been updated. You can read more about our ChartLists on our website.
Weekly Market Recap
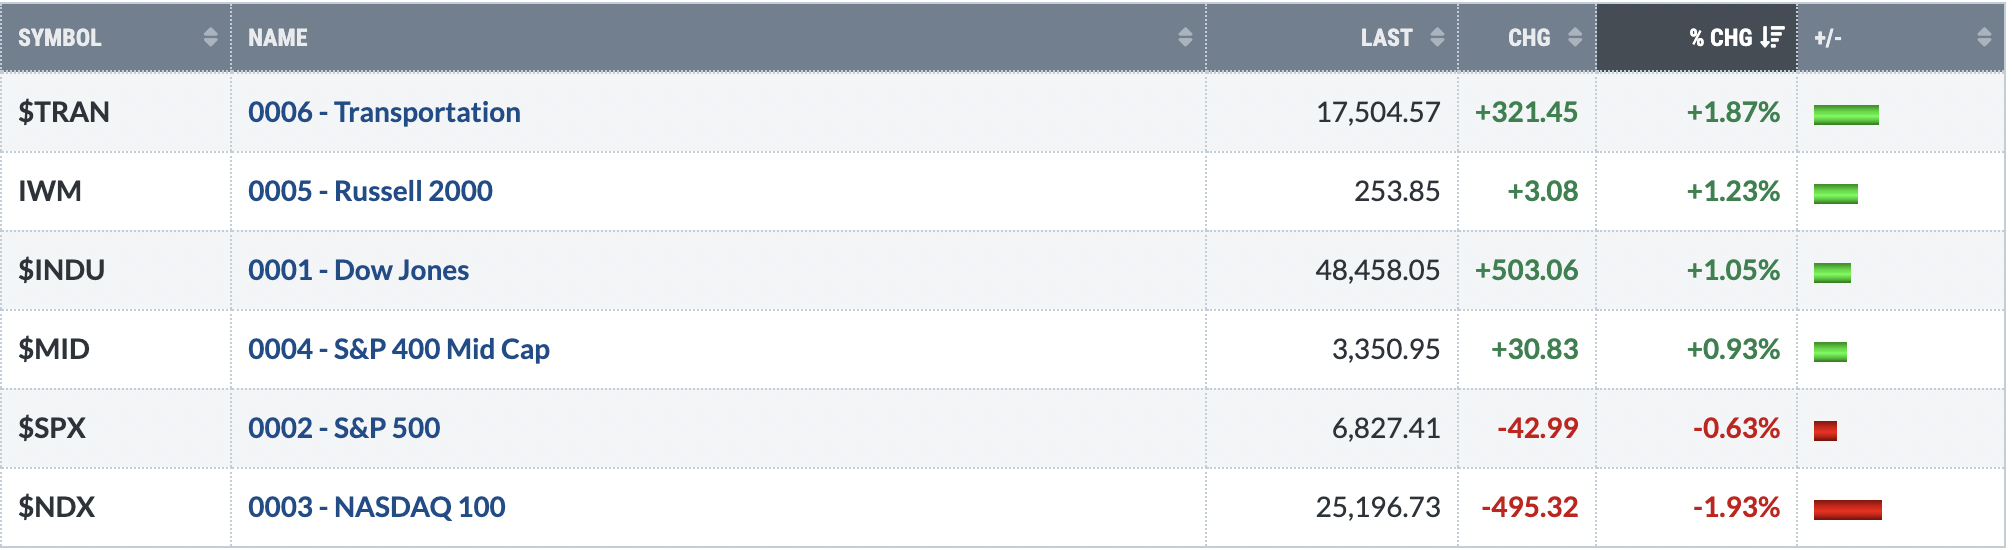
Major Indices
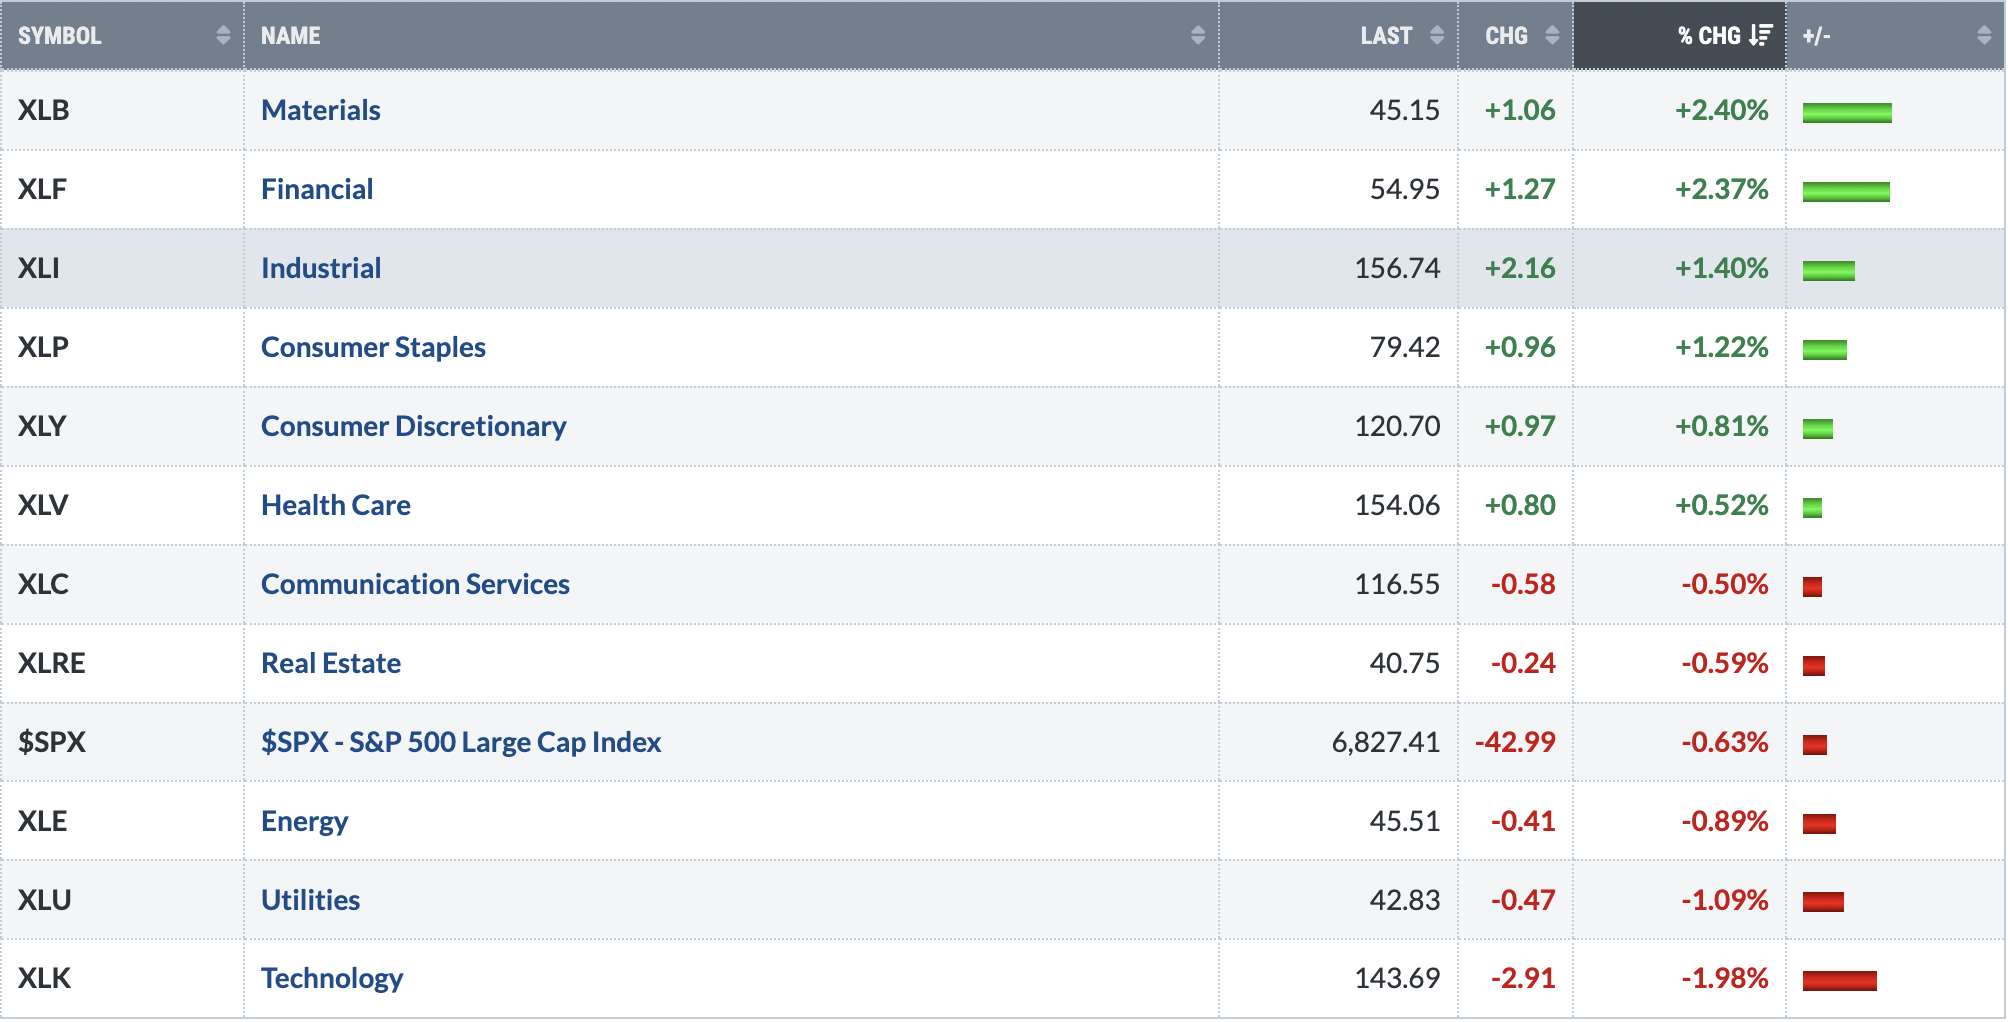
Sectors
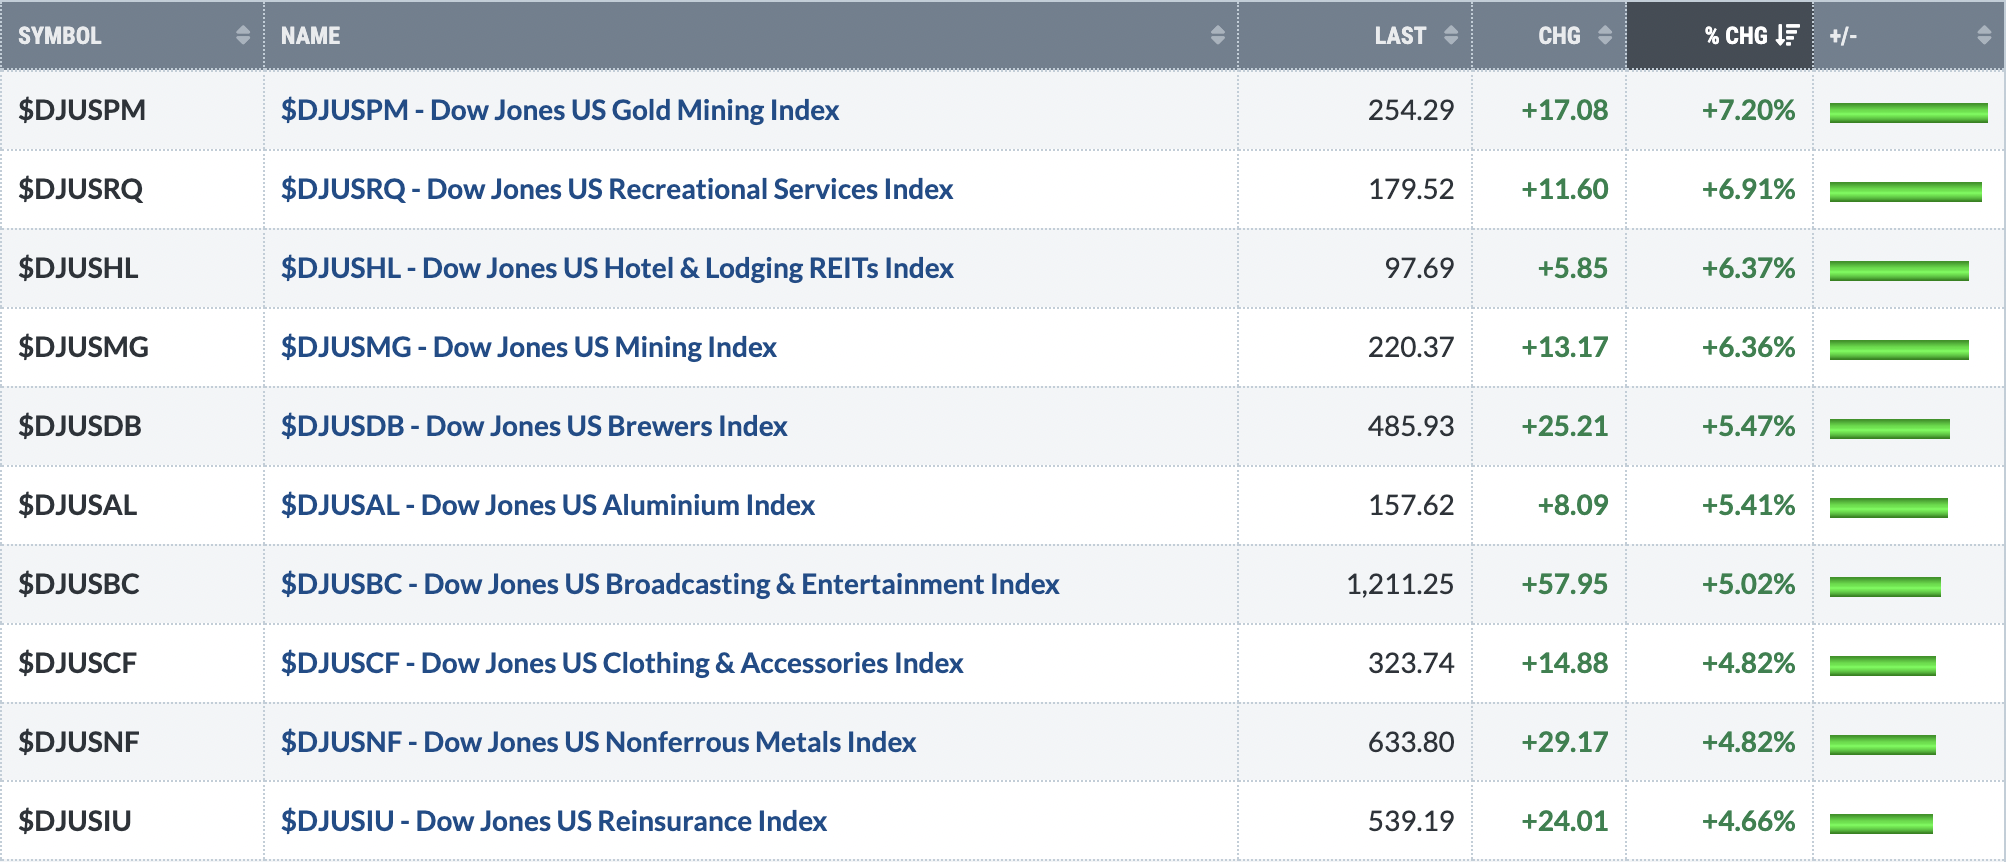
Top 10 Industries Last Week
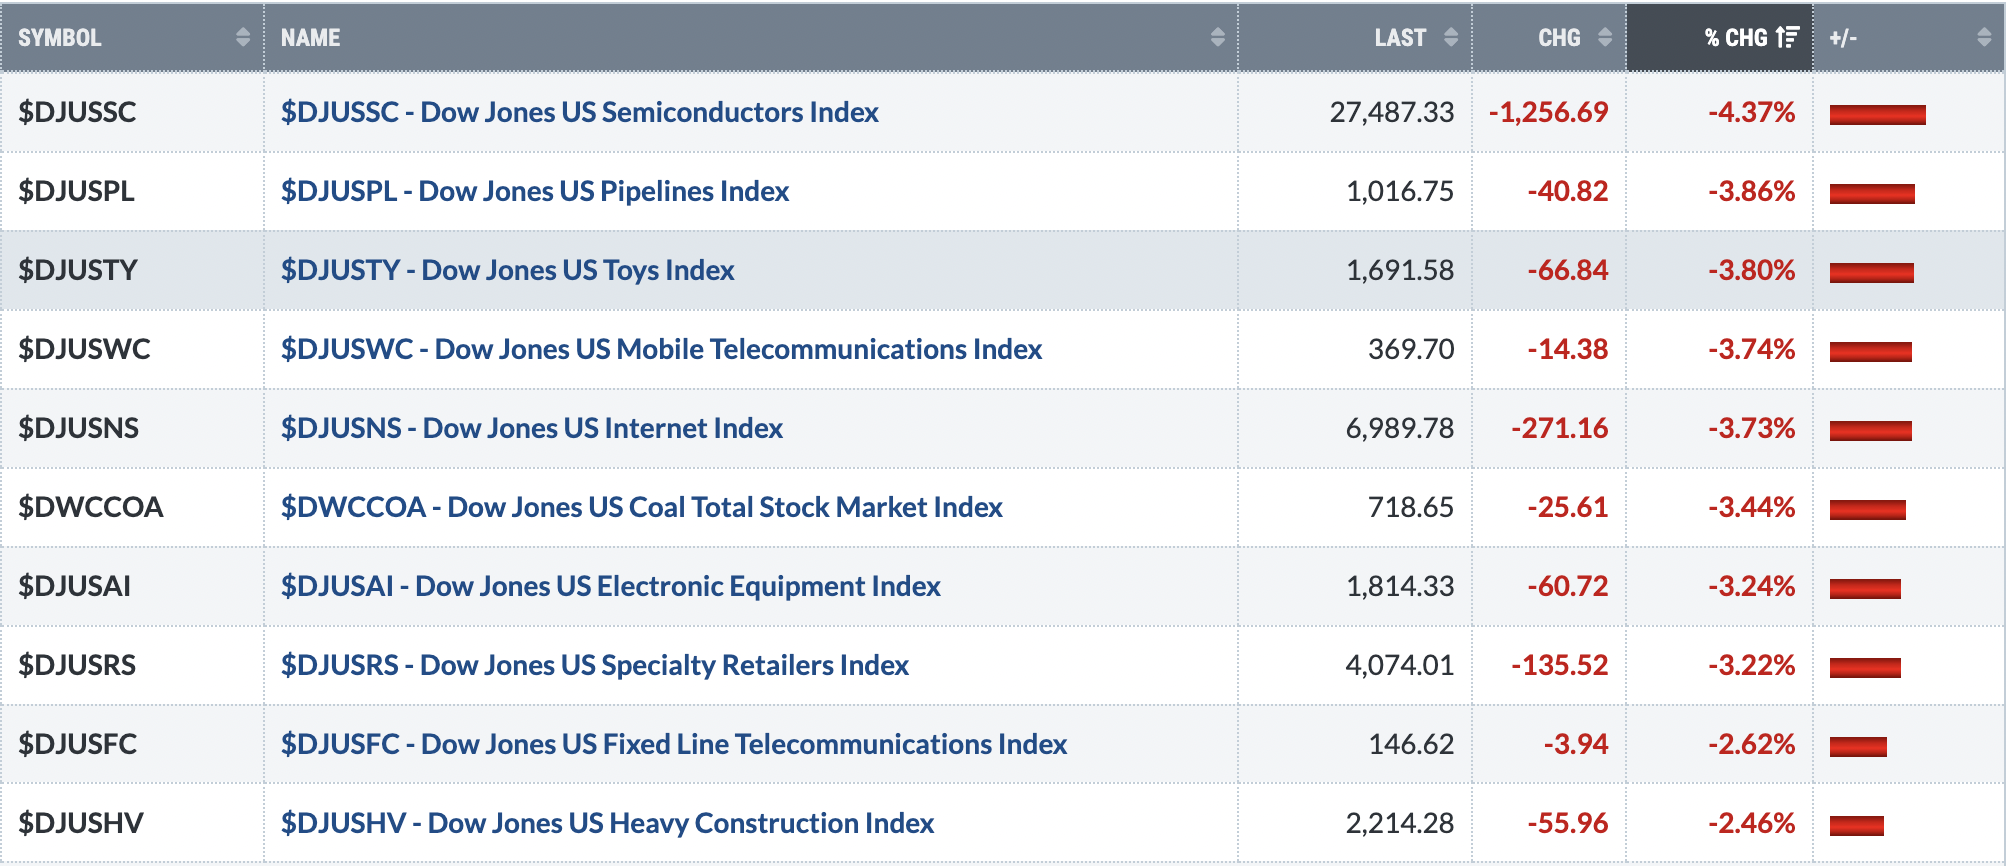
Bottom 10 Industries Last Week
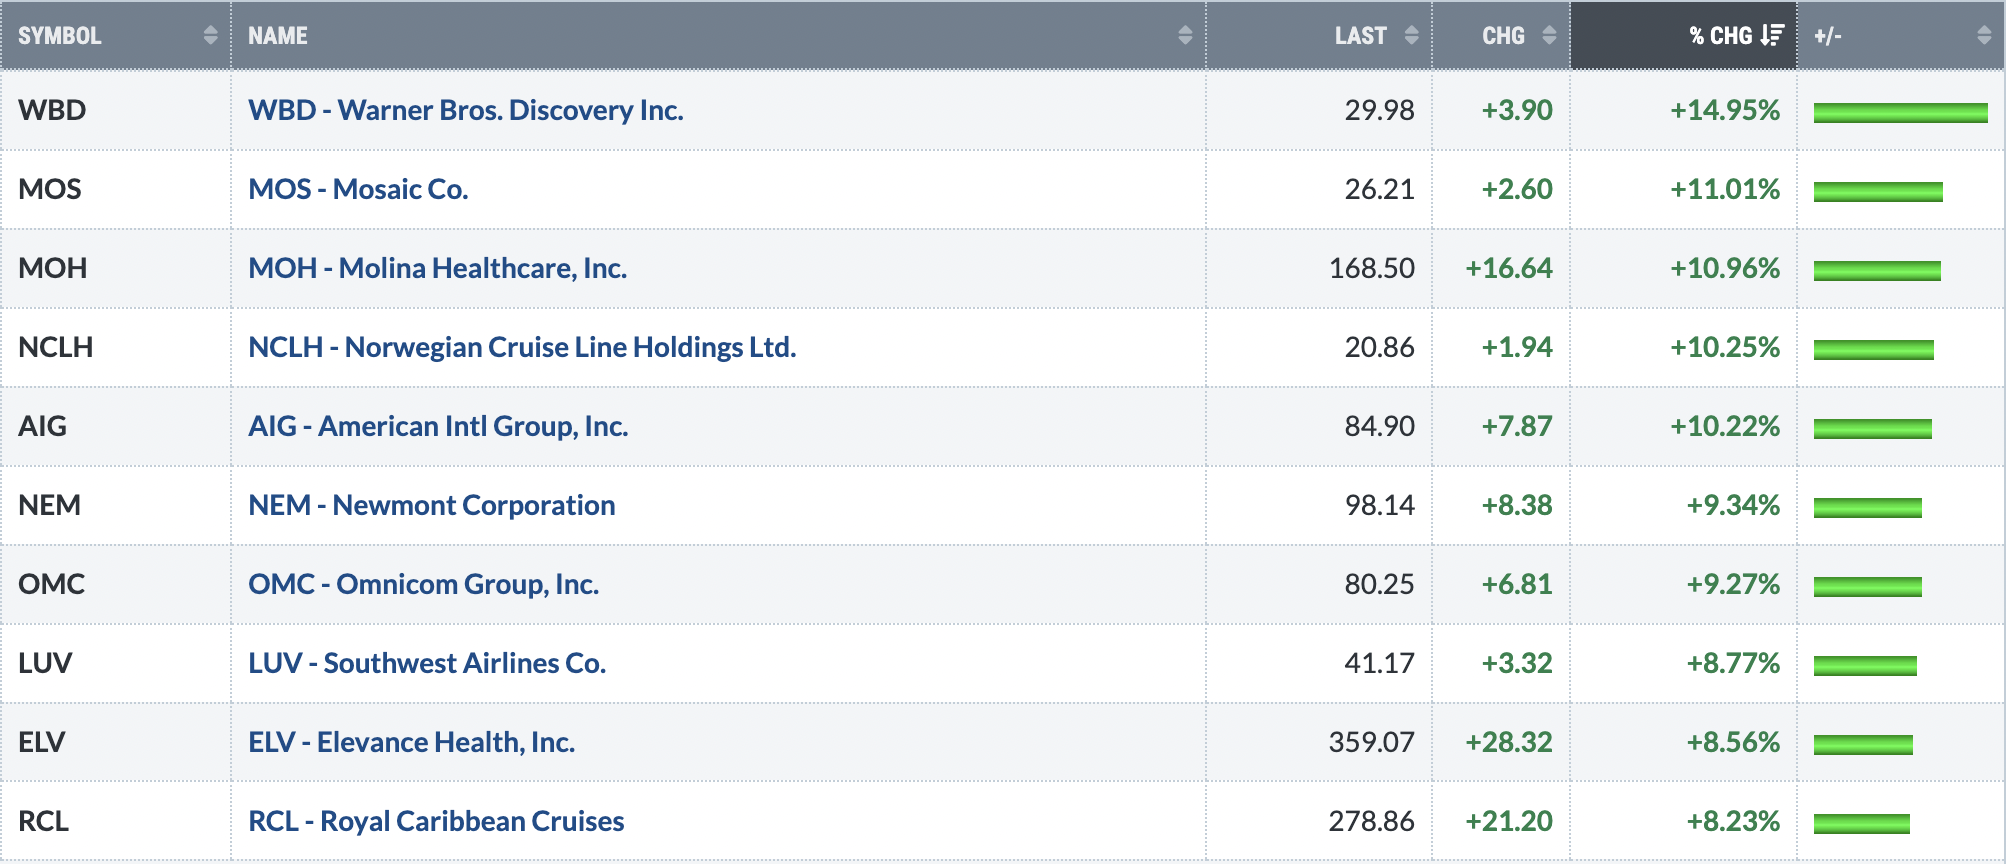
Top 10 Stocks - S&P 500/NASDAQ 100
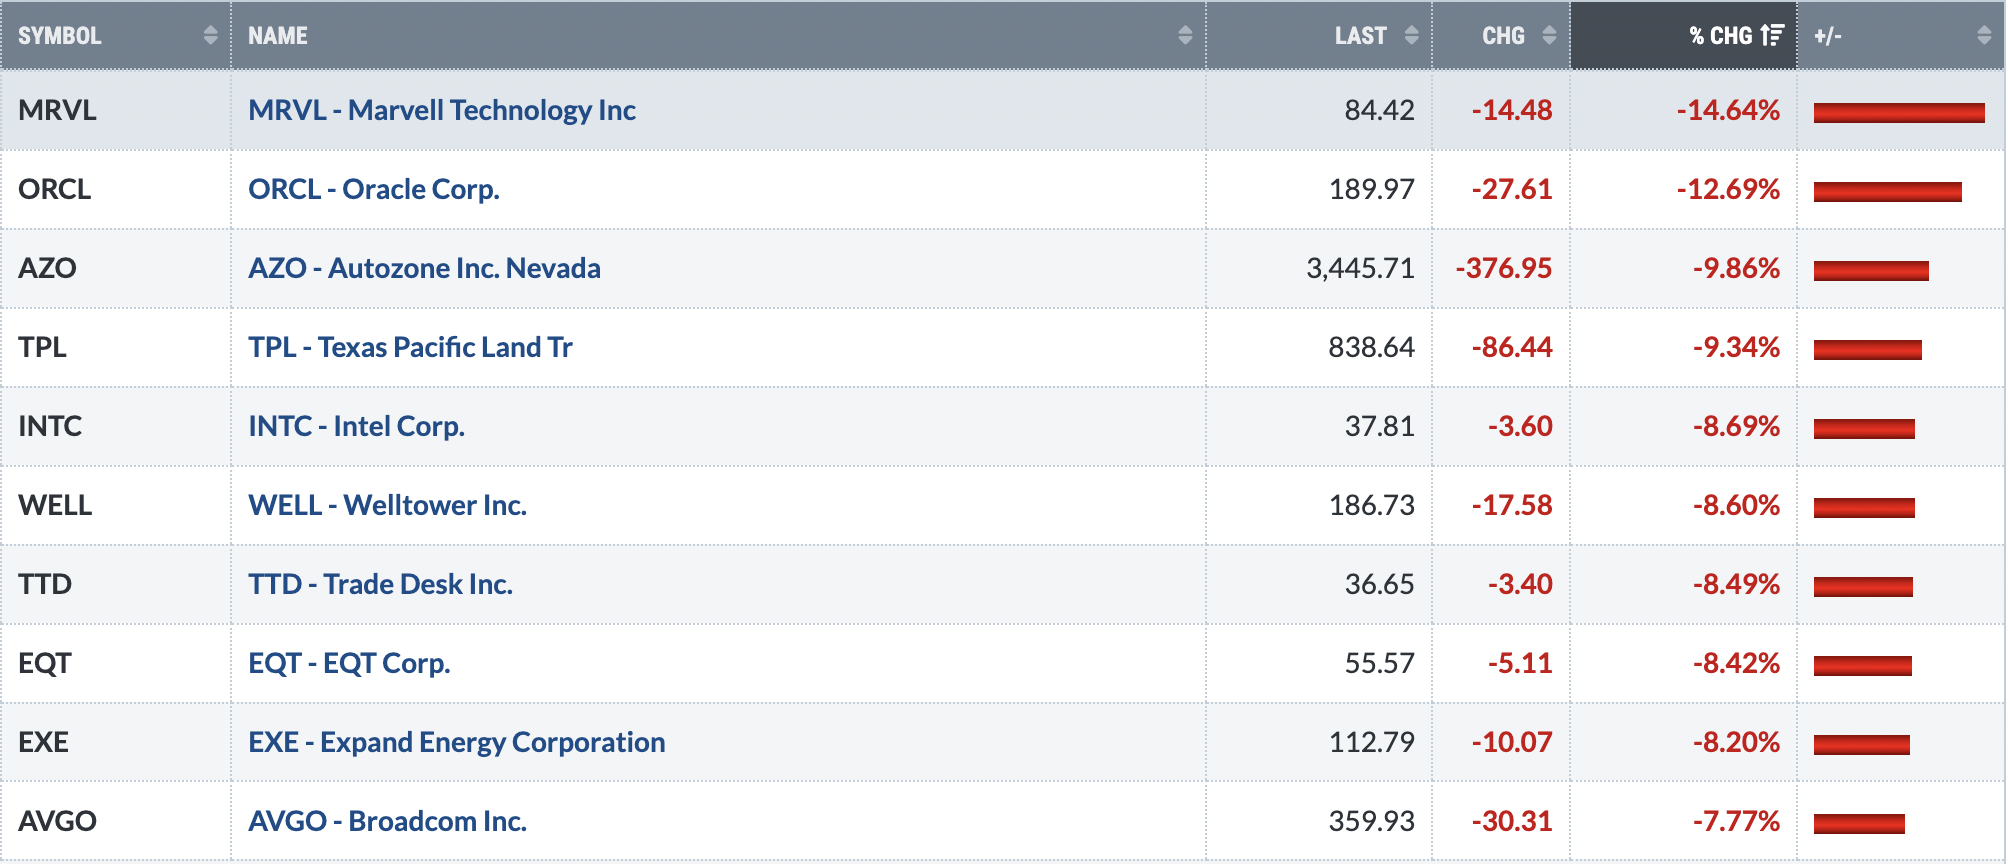
Bottom 10 Stocks - S&P 500/NASDAQ 100
Big Picture
The average annual return for the current secular bull market (years 2013 through 2025) was updated to 13.78% to include the solid gain posted thus far in 2025. That easily surpasses the average 9% return that the S&P 500 has delivered since 1950. So long as these average annual gains outperform the historical average, it makes perfect sense for long-term investors to stay the course.
Sustainability Ratios
Here's the latest look at our key intraday ratios as we follow where the money is traveling on an INTRADAY basis (ignoring gaps):
QQQ:SPY
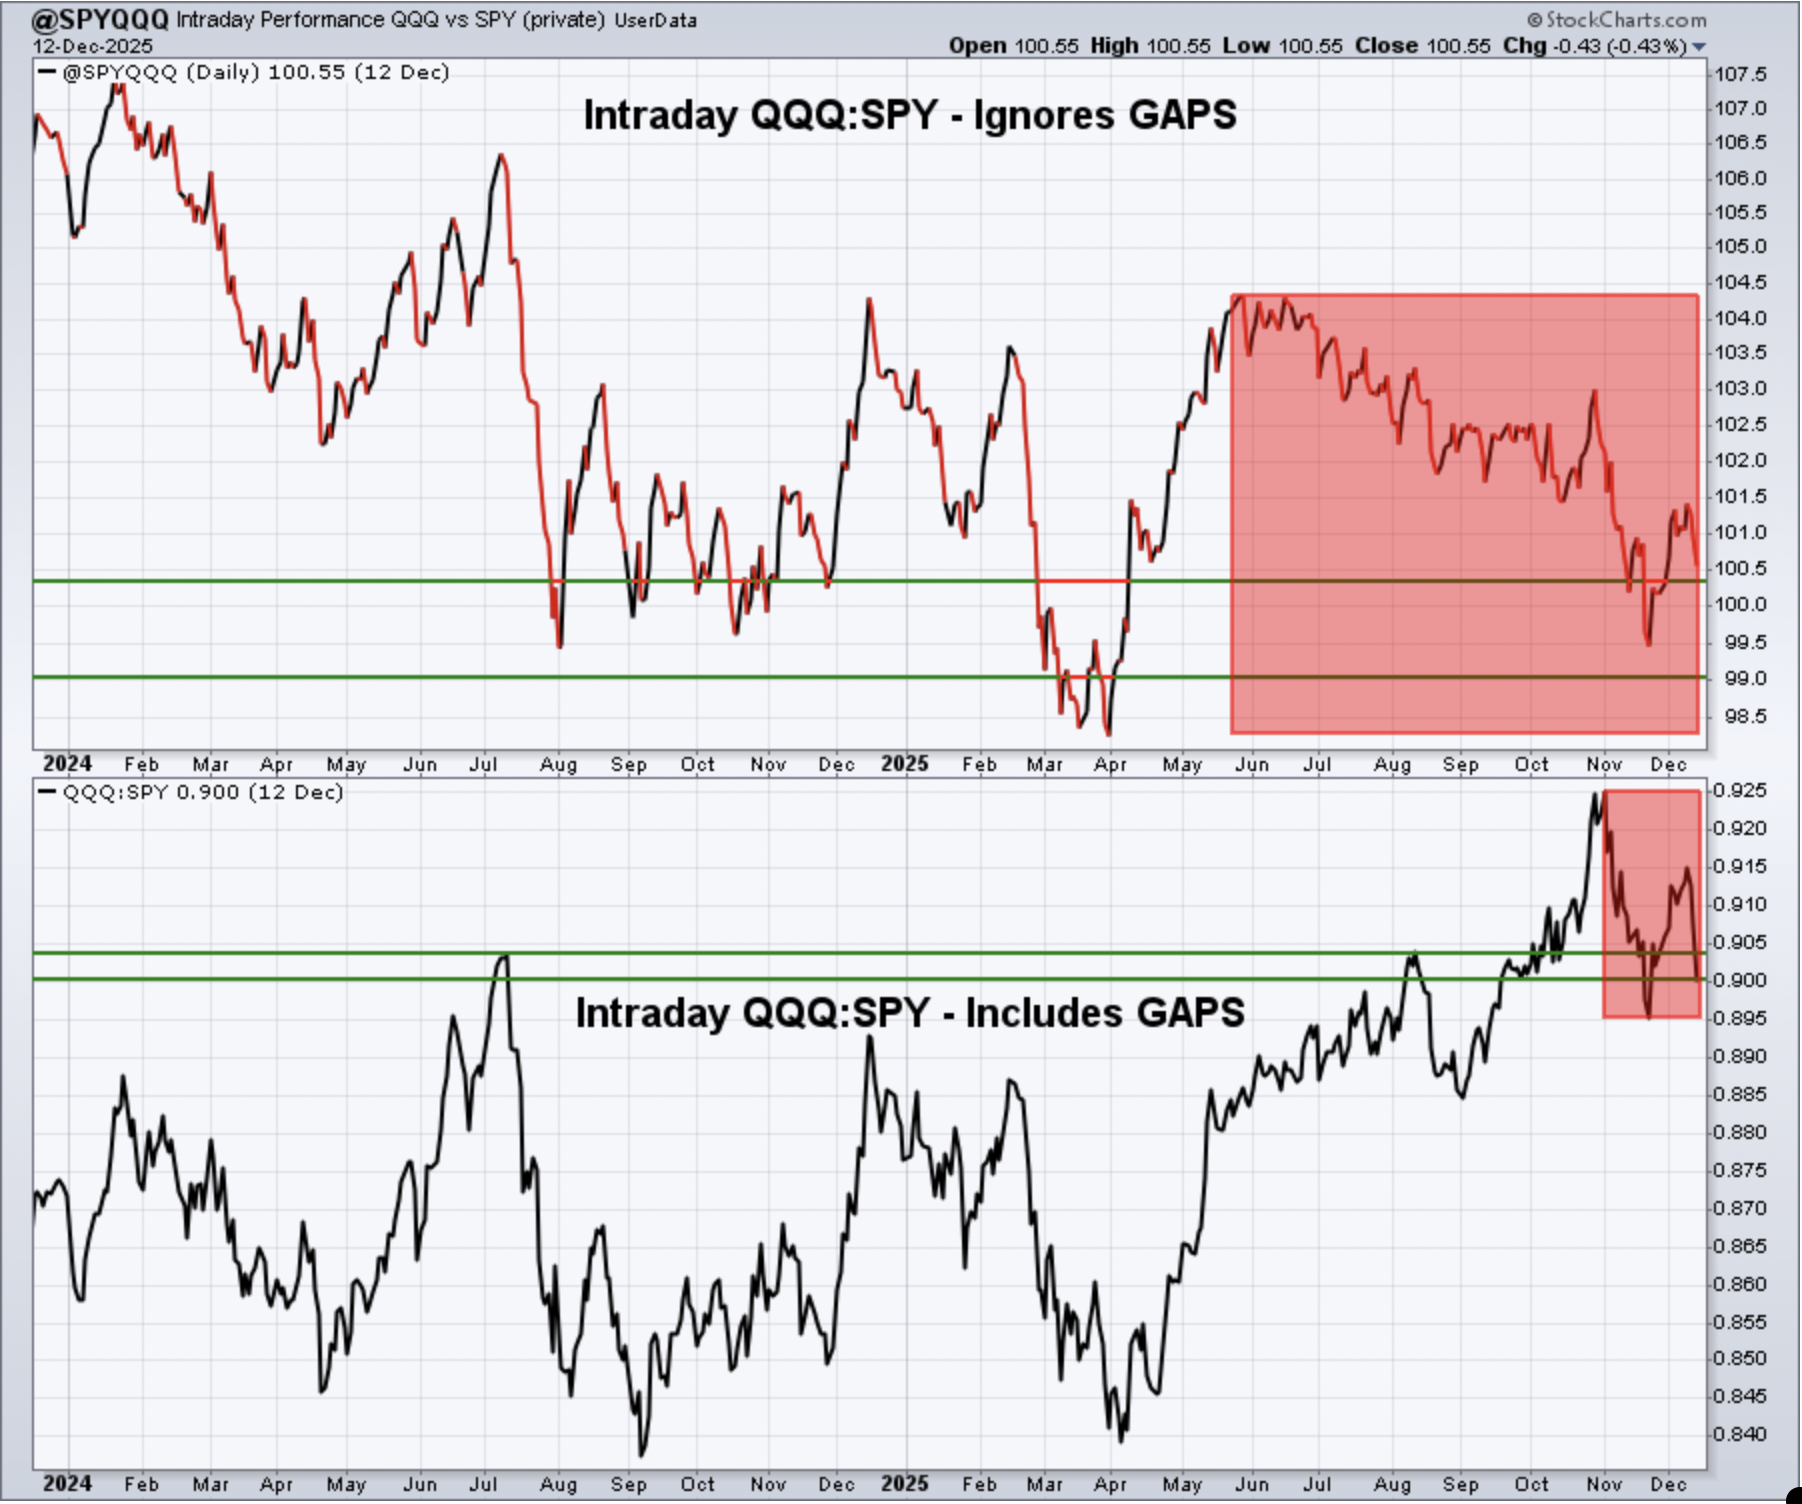
Keep in mind that the intraday analysis provided is a "work in progress". I continue to analyze this data to see if it helps provide us clues about calling market direction. It makes common sense to me that it should help in some sense, but it'll require a much longer-term study to determine its worth. The good news is that this ratio bounced with the recent rally to set a new all-time high close on the S&P 500. The bad news is it didn't bounce nearly high enough and has since rolled over quite strongly as we approach the end of the first half of December.
IWM:QQQ
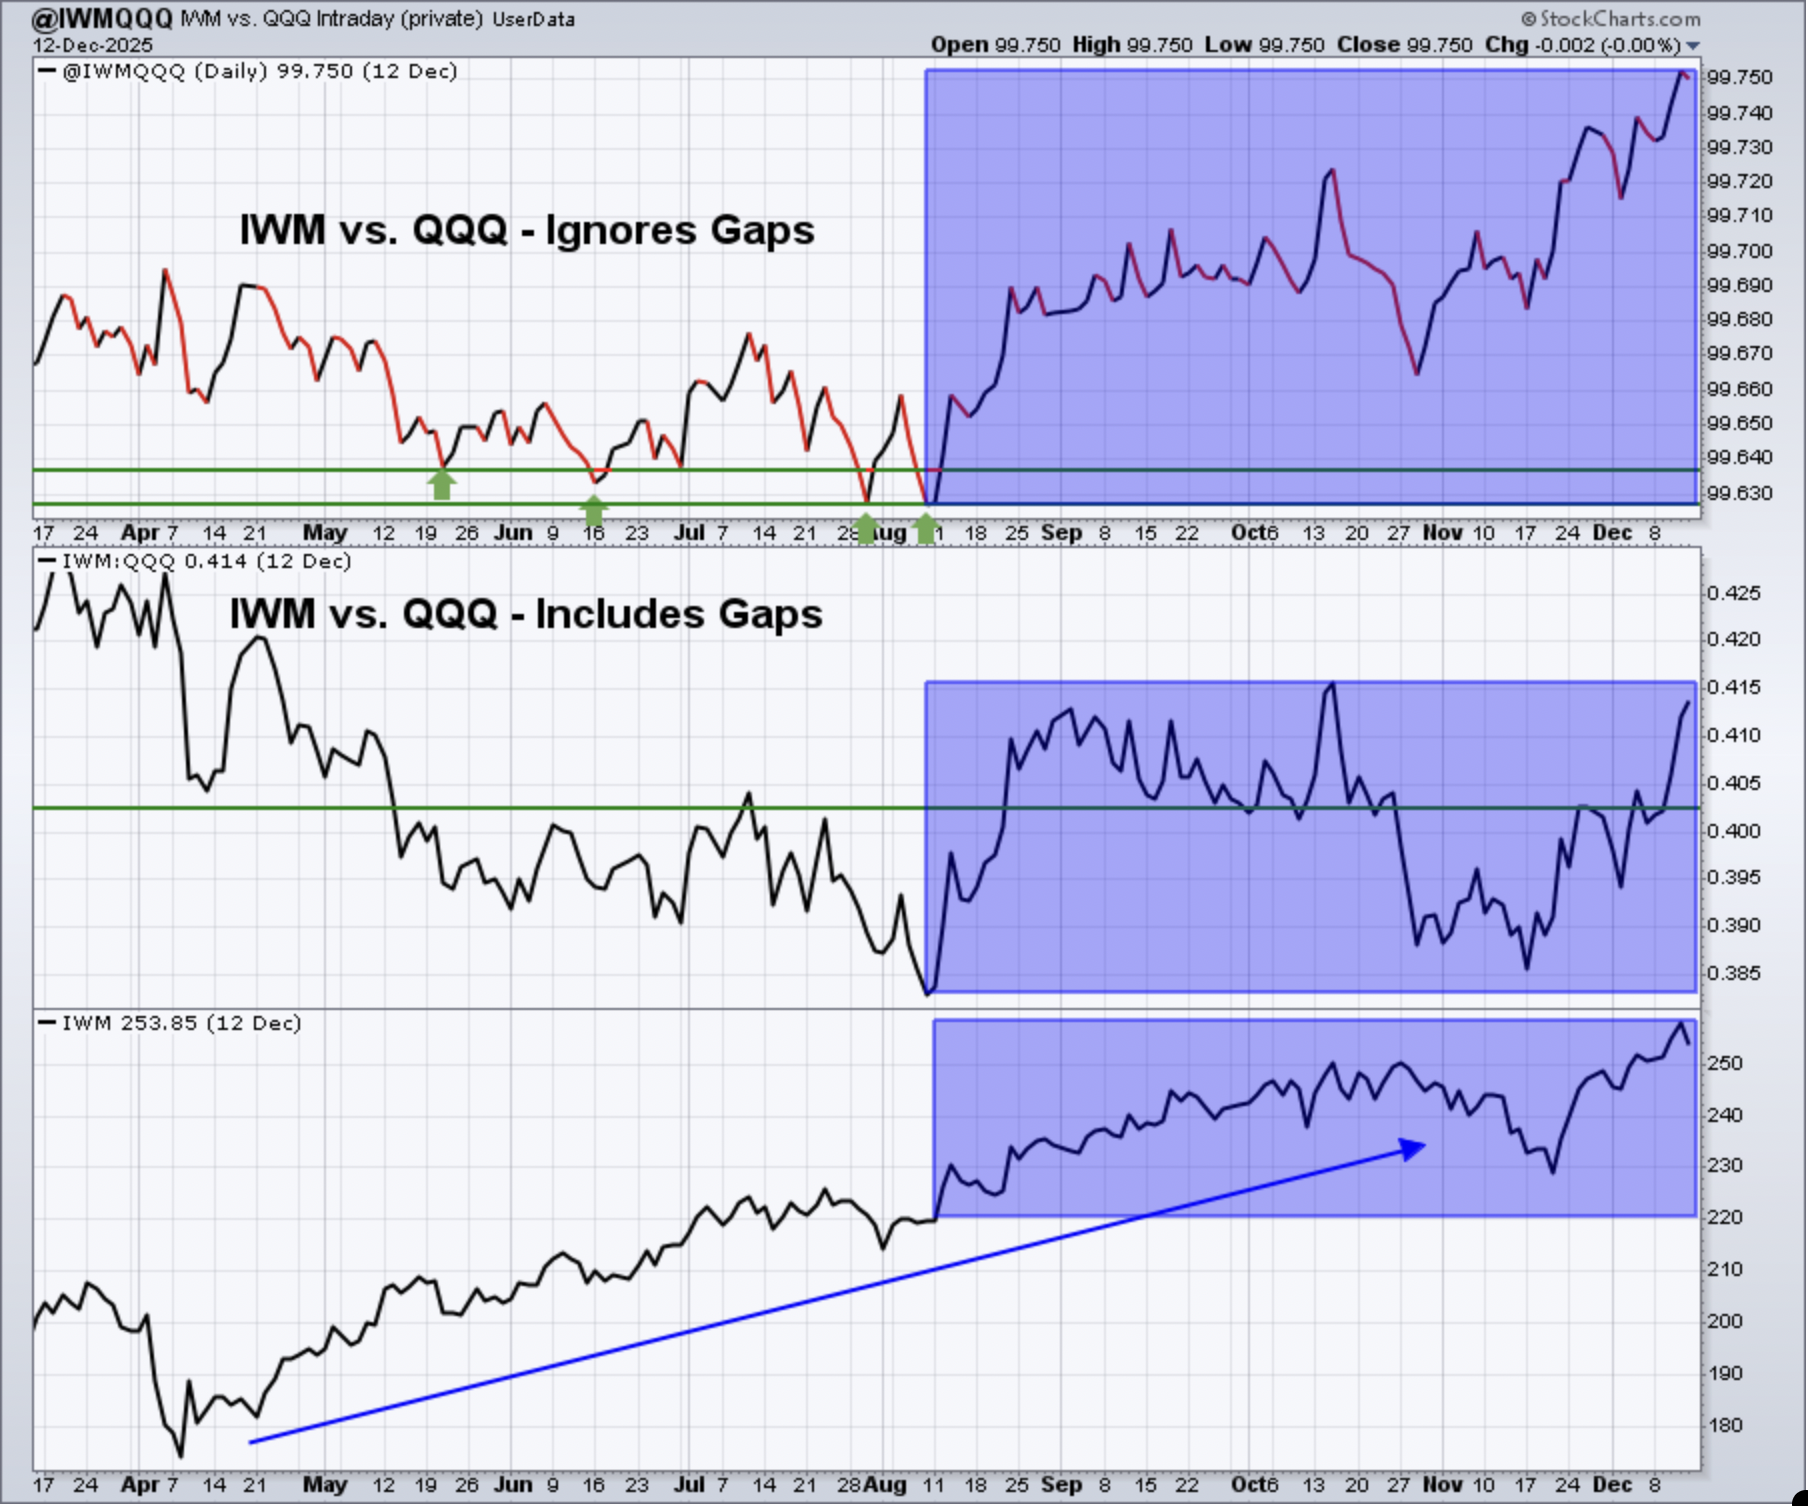
Small caps (IWM) have been solid technically after breaking out last week to a fresh all-time high. I'll continue to monitor developments and report on them here. But for now, small caps clearly look like the stronger area of the market (vs. large caps).
XLY:XLP
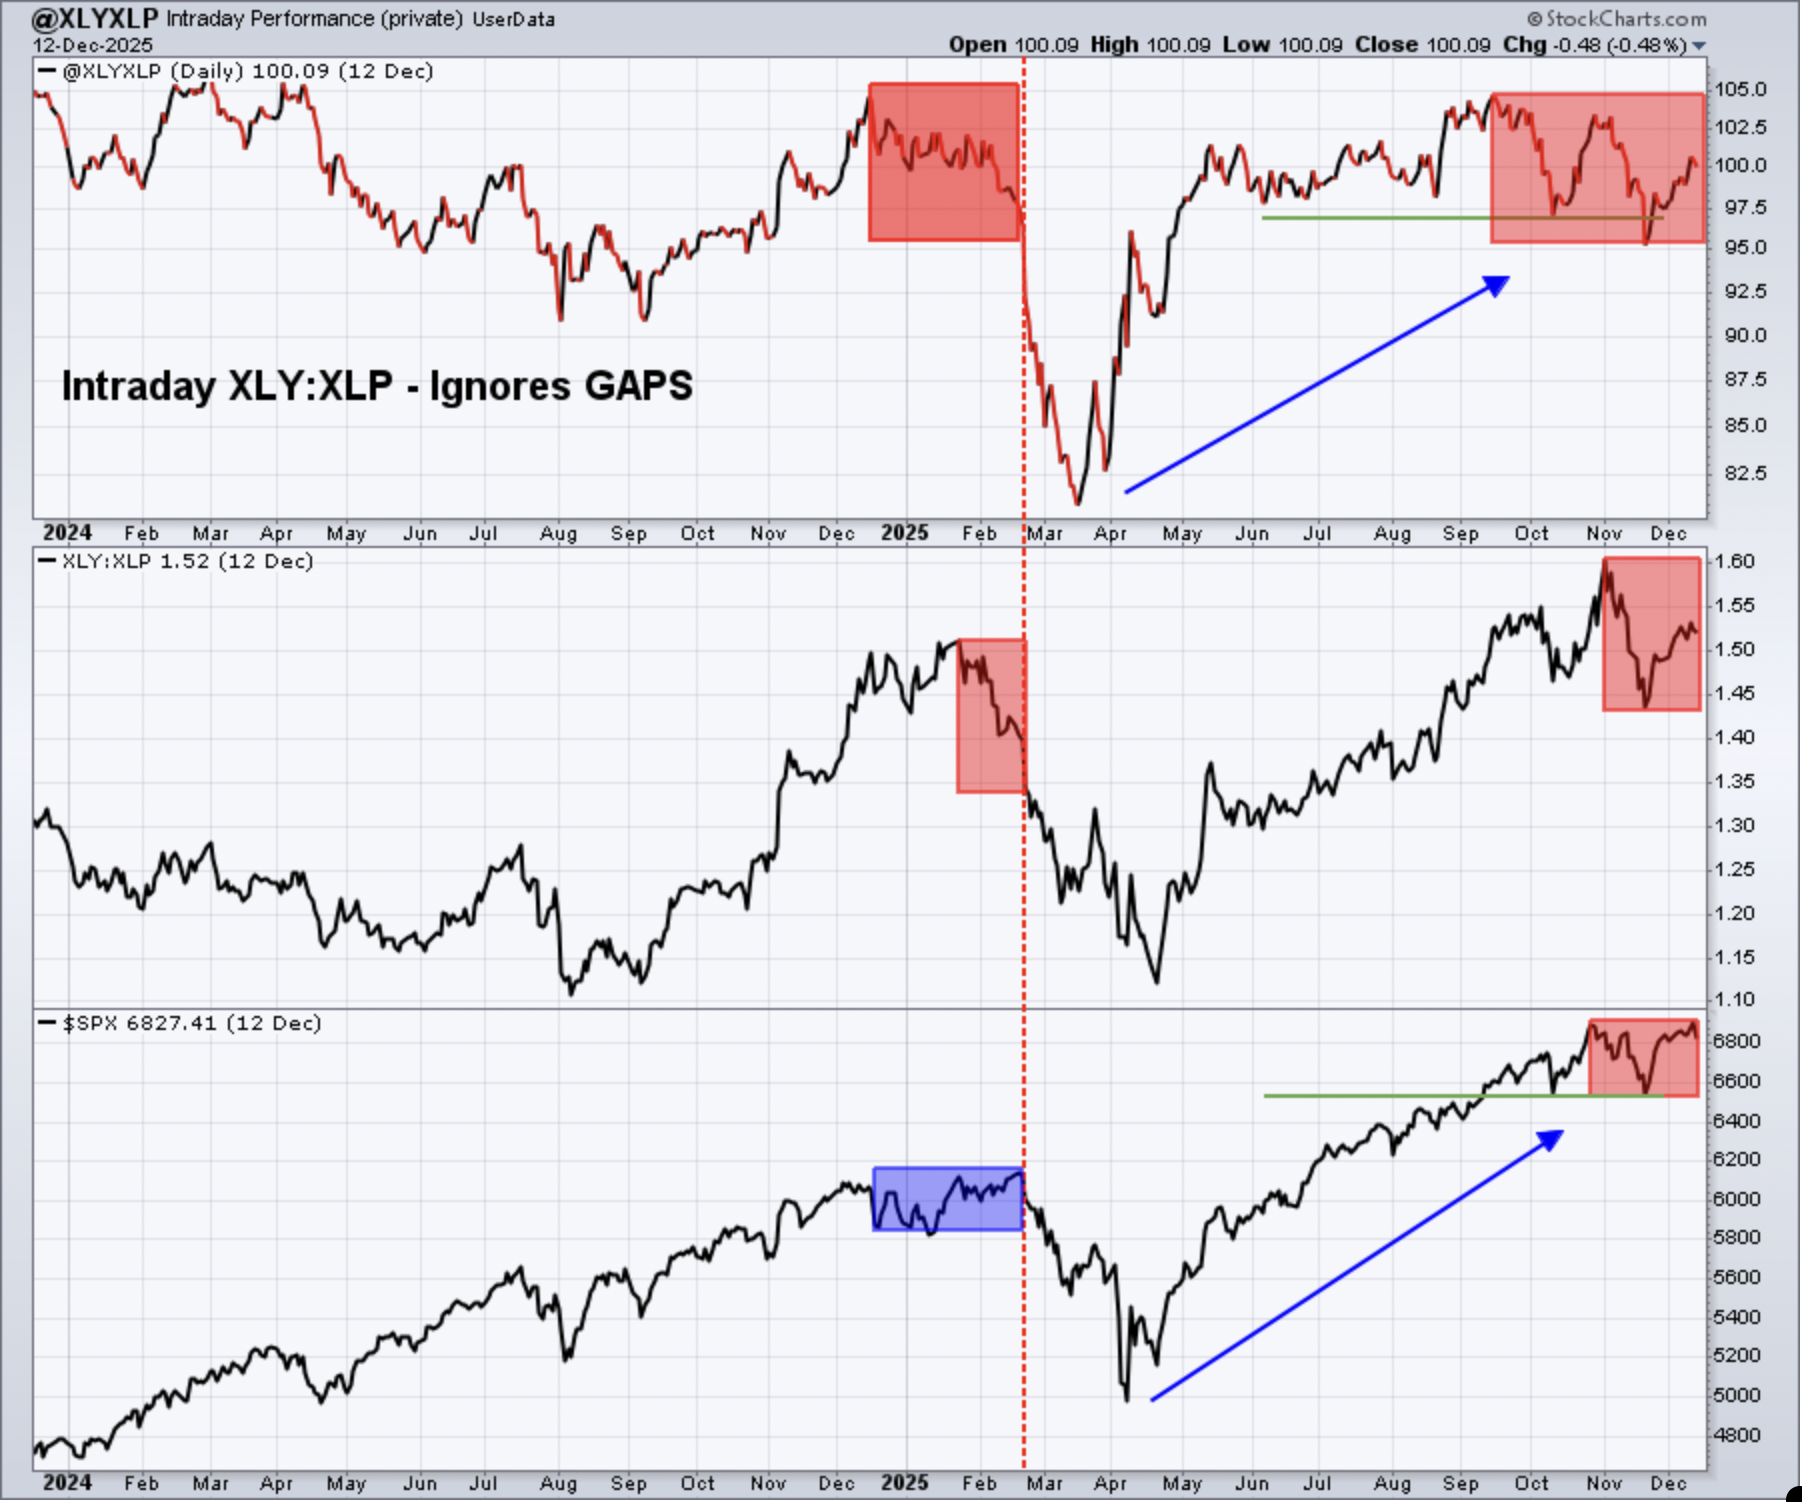
Both "including gaps" and "excluding gaps" charts remain in a long-term uptrend, which is good news overall, especially for my longer-term bullish forecast. The short-term is a bit dicier though. The XLY:XLP is one of my favorite ratios and what I consider to be one of my highest ranking secondary indicators. I pay close attention to it. The XLY:XLP ratio is still rising, though it remains well off its September high.
Until I see a break above the September high, I still view this as a potential warning sign.
Sentiment
5-day SMA ($CPCE)
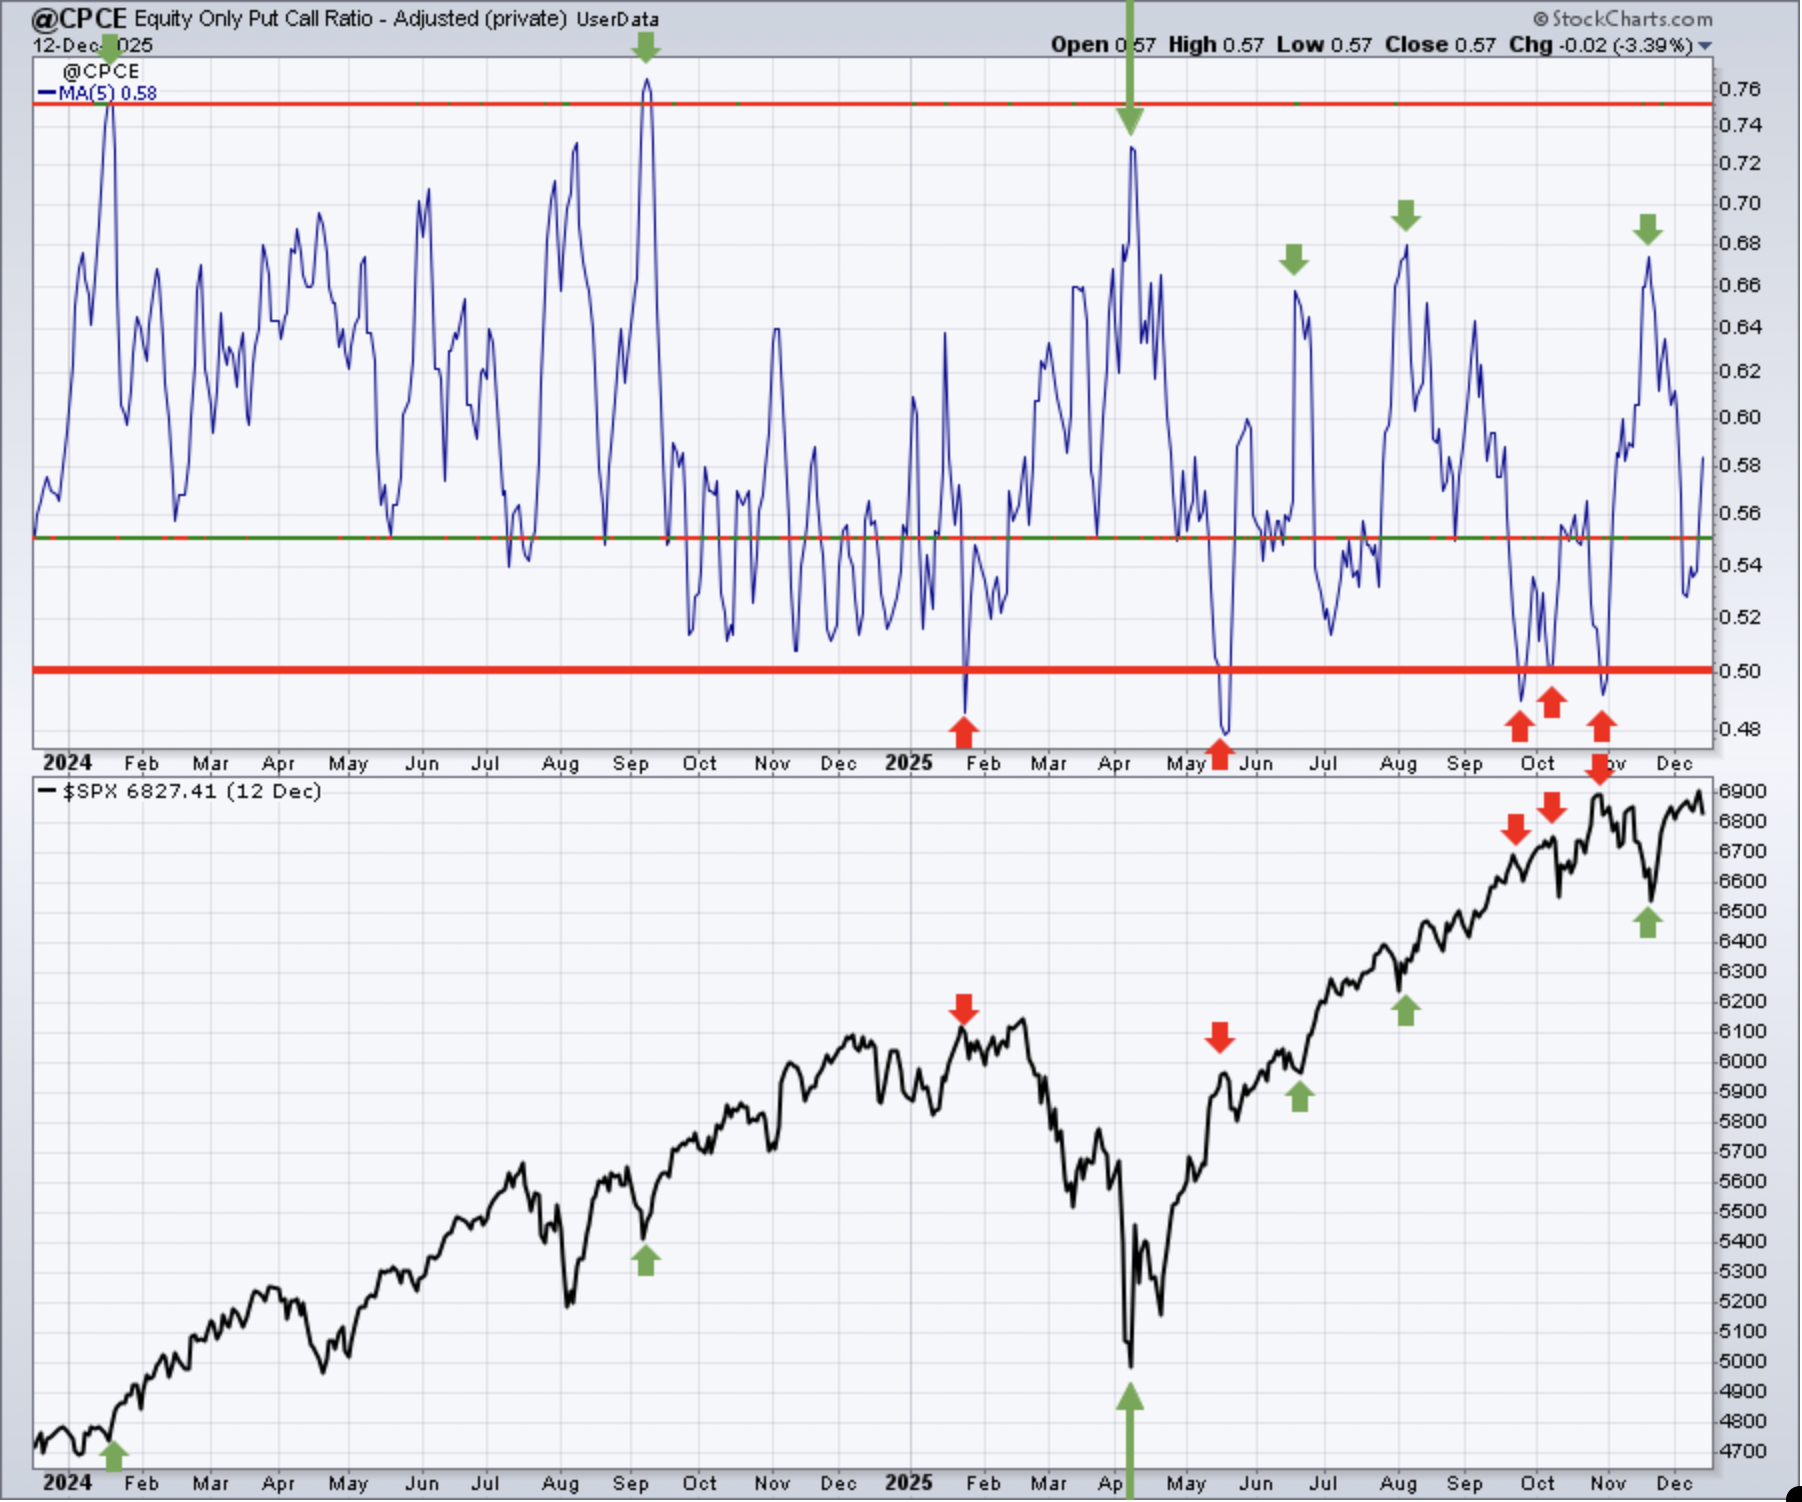
Sentiment indicators are contrarian indicators. When they show extreme bullishness, we need to be a bit cautious and when they show extreme pessimism, it could be time to become much more aggressive. Major market bottoms are carved out when pessimism is at its absolute highest level.
Keep in mind that the above 5-day SMA reading of the CPCE is our "speed boat" sentiment indicator that changes quite frequently. This sentiment indicator moved back below 0.55 just as we saw our last market top. It's since moved back into neutral territory.
253-day SMA ($CPCE)
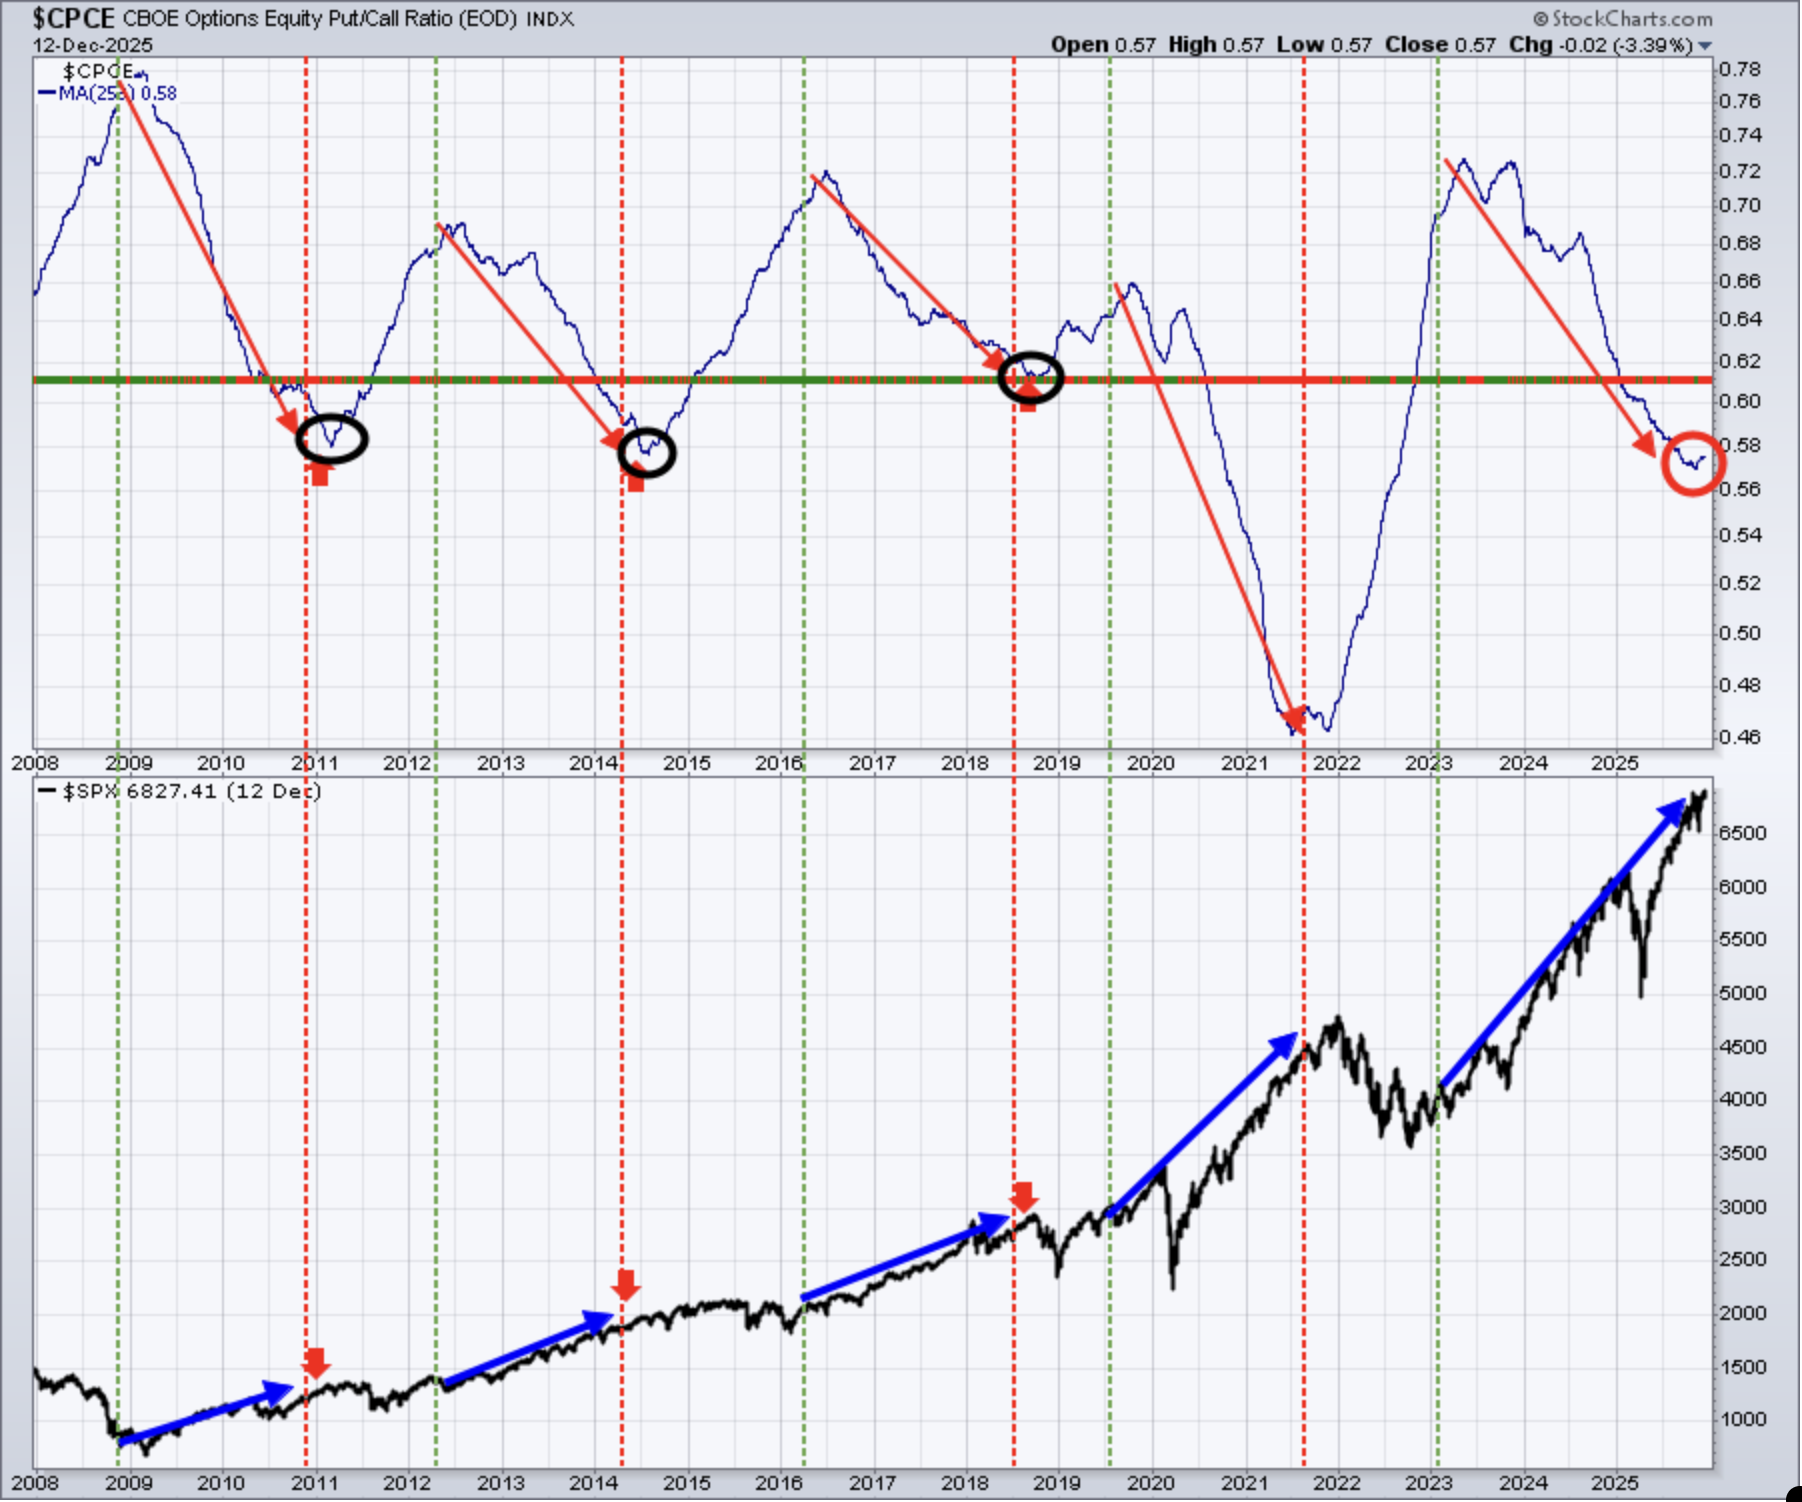
This longer-term 253-day SMA of the CPCE is our "ocean-liner" signal, unlike our short-term speedboat indicator. It's a little early to change any medium-term to long-term portfolio strategies, but it is absolutely noteworthy that this 253-day signal appears to be turning back higher (red circle). I'm sure I'll have plenty to say about this, if it continues, at MarketVision 2026 in early January.
Long-Term Trade Setup
Since beginning this Weekly Market Report in September 2023, I've discussed the long-term trade candidates below that I really like. Generally, these stocks have excellent long-term track records, and many pay nice dividends that mostly grow every year. Only in specific cases (exceptions) would I consider a long-term entry into a stock that has a poor or limited long-term track record and/or pays no dividends. I try to review the long-term picture once a month or so. Below is a quick recap of how these stocks looked as of Monday, December 5th:
- JPM – it's still quite strong, but extended
- BA – has rebounded to test its 20-week EMA from underneath
- FFIV – tested its April low and now bouncing
- MA – I'd keep an eye on price support near 525
- GS – very strong uptrend continues; great performance and overbought
- FDX – has been surging off its early-October low
- AAPL – seen profit taking last week or so, but lots of new highs set recently
- CHRW – has nearly doubled off its April low
- JBHT – now challenging overhead resistance in 190-195 range
- STX - very hot stock, has now more than quadrupled off its April low
- HSY – held 160 and bounced; still needs to clear 200
- DIS – 125 resistance remains the key
- MSCI – drifting lower again, initial support close to 520
- SBUX - another in a lengthy consolidation period, needs to hold 70 on selling
- KRE – bounced off 57.50 support, now staring at price resistance in 67-68 area
- ED – 95 is the support I'm watching on the weekly chart and it's perilously close
- AJG – after years of uninterrupted strength, AJG is rapidly descending
- NSC – 270 support held, now comes 300 resistance
- RHI – found buyers at 25, still not out of the woods from all the sellers
- ADM – I think solid support near 55 has been established
- BG – combination of 87 bucks and 20-week EMA should provide support
- CVS – testing rising 20-week EMA
- IPG – weakening again, another trip to 22-23 range is increasing
- HRL - losing 25 was bad technically, now that's key resistance
- DE – struggling at 20-week EMA, a break above would be bullish
- LULU - rallied to test falling 20-week EMA, but failing thus far to clear
- TTD - trying to hang onto multi-year price support near 39-40
- META - had a solid week after being added, but can it clear its 20-week EMA?
Keep in mind that our Weekly Market Reports favor those who are more interested in the long-term market picture. Therefore, the list of stocks above are stocks that we believe are safer (but nothing is ever 100% safe) to own with the long-term in mind. Nearly everything else we do at EarningsBeats.com favors short-term momentum trading, so I wanted to explain what we're doing with this list and why it's different.
Also, please keep in mind that I'm not a Registered Investment Advisor (and neither is EarningsBeats.com nor any of its employees) and am only providing (mostly) what I believe to be solid dividend-paying stocks for the long term. Companies periodically go through adjustments, new competition, restructuring, management changes, etc. that can have detrimental long-term impacts. Neither the stock price nor the dividend is ever guaranteed. I simply point out interesting stock candidates for longer-term investors. Do your own due diligence and please consult with your financial advisor before making any purchases or sales of securities.
International Markets
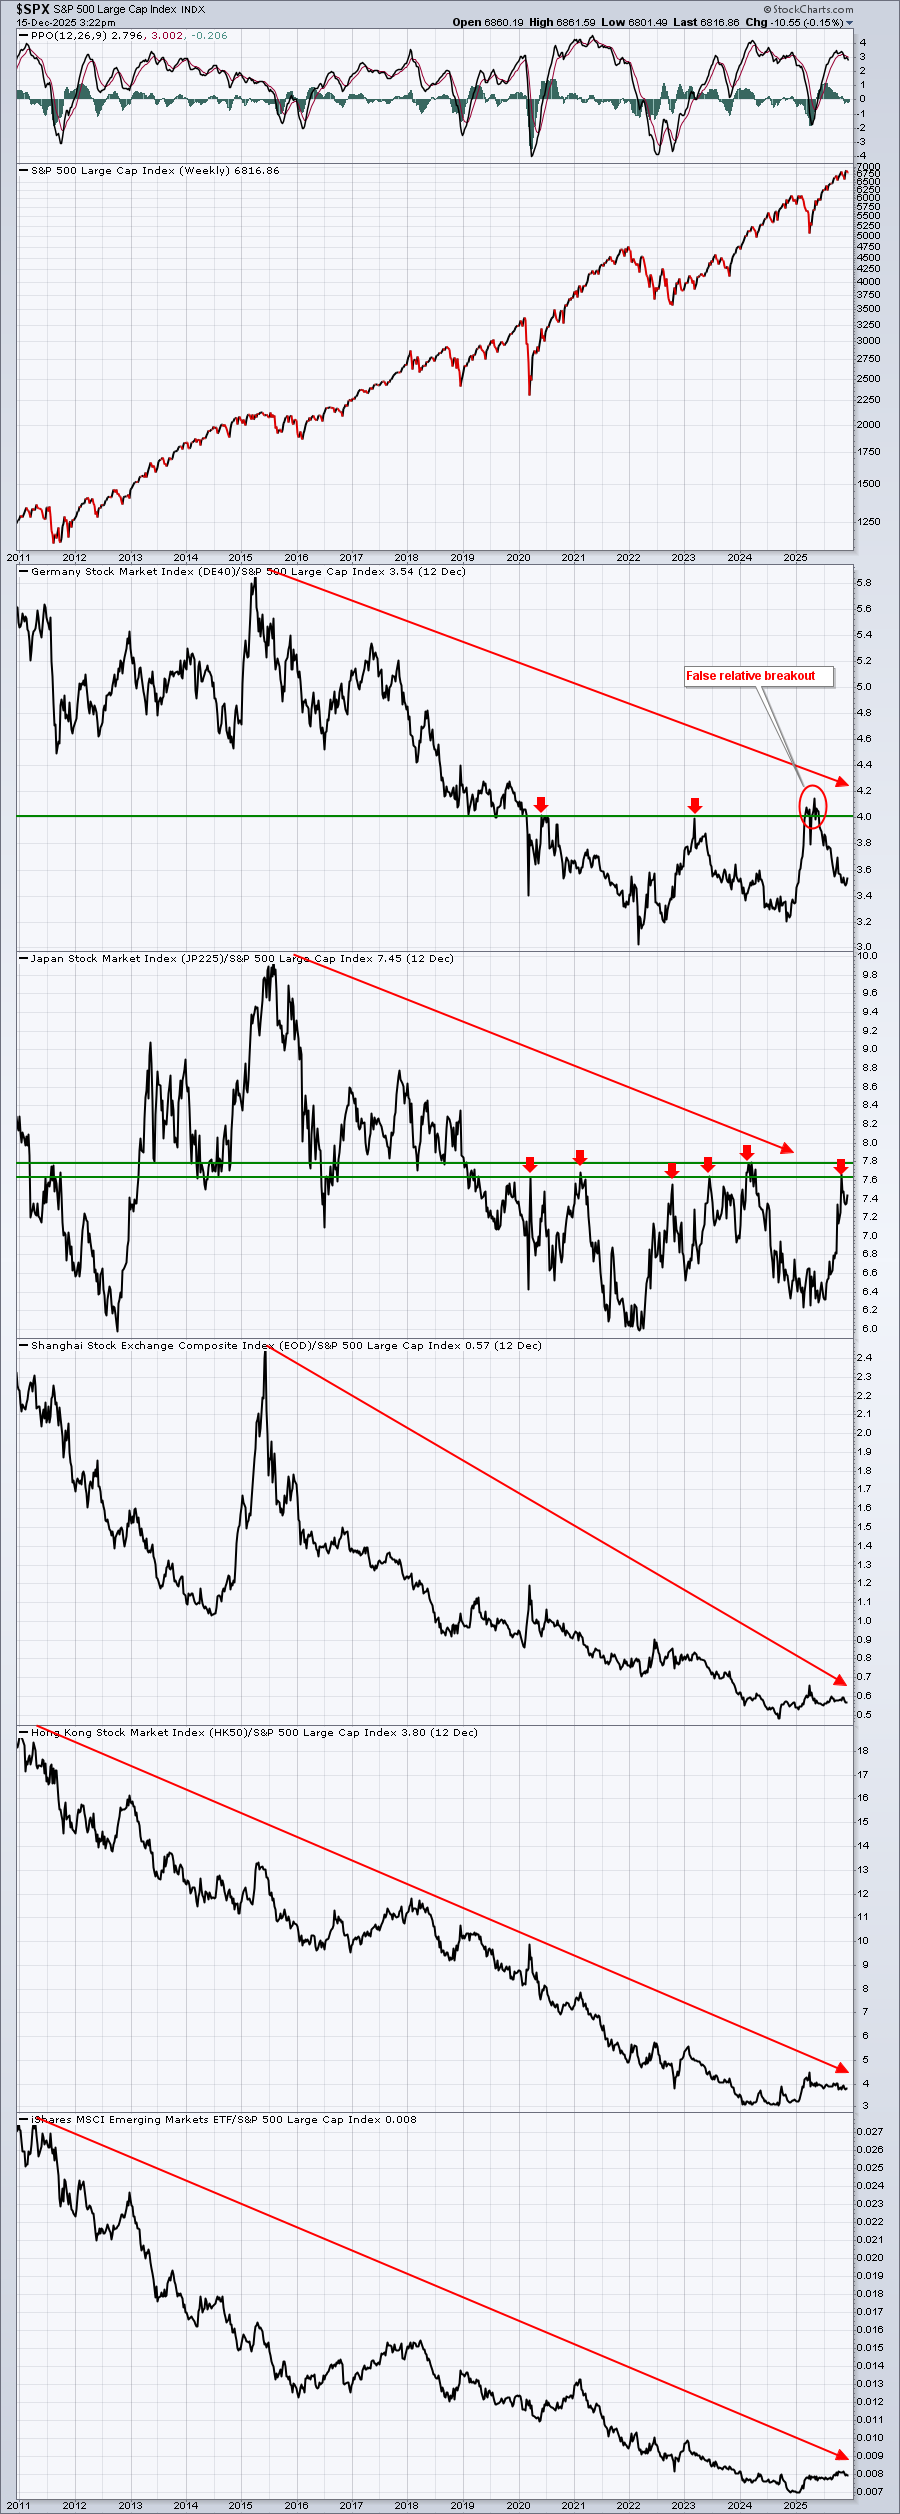
I've had several questions recently about whether now is the time to shift a significant portion of assets into international funds. I don't really see the need to do that just yet. In the chart below, I still see most international indices trailing the S&P 500 on a relative basis. The German DAX ($DAX) printed a false relative breakout and the Tokyo Nikkei ($NIKK) is approaching a key relative resistance level, but I feel the S&P 500 remains the best investment choice, even with the short-term warning signs present.
Here's the chart:
Looking Ahead
Upcoming Earnings
The following list of companies is NOT a list of all companies scheduled to report quarterly earnings, however, just key reports, so please be sure to check for earnings dates of any companies that you own. Any company in BOLD represents a stock in one of our portfolios and the amount in parenthesis represents the market capitalization of each company listed:
- Monday: None
- Tuesday: LEN ($30 billion)
- Wednesday: MU ($291 billion), JBL ($25 billion), GIS ($25 billion)
- Thursday: ACN ($178 billion), NKE ($100 billion), CTAS ($76 billion), FDX ($67 billion)
- Friday: PAYX ($41 billion), CCL ($33 billion)
Key Economic Reports
- Monday: December empire state manufacturing survey
- Tuesday: November nonfarm payrolls (delayed), November unemployment rate (delayed), October retail sales (delayed), September business inventories
- Wednesday: None
- Thursday: Initial jobless claims, November CPI, December Philadelphia Fed manufacturing survey
- Friday: November existing home sales, December consumer sentiment
Historical Data
I'm a true stock market historian. I am absolutely PASSIONATE about studying stock market history to provide us more clues about likely stock market direction and potential sectors/industries/stocks to trade. While I don't use history as a primary indicator, I'm always very aware of it as a secondary indicator. I love it when history lines up with my technical signals, providing me with much more confidence to make particular trades.
Below you'll find the next two weeks of historical data and tendencies across the three key indices that I follow most closely. The percentage for each calendar day represents the annualized return for that day. An example of how this is calculated is reflected next to the first day under the S&P 500 and in parenthesis:
S&P 500 (since 1950)
- Dec 15: -17.54% (Ex: cumulative gains = -3.61% over 52 trading days since 1950. -3.61% x 253/52 = -17.54%)
- Dec 16: +84.50%
- Dec 17: +8.06%
- Dec 18: +50.01%
- Dec 19: -4.49%
- Dec 20: -31.71%
- Dec 21: +75.04%
- Dec 22: +32.01%
- Dec 23: +19.83%
- Dec 24: +33.54%
- Dec 25: +0.00%
- Dec 26: +123.20%
- Dec 27: +34.59%
- Dec 28: -9.70%
NASDAQ (since 1971)
- Dec 15: -29.80%
- Dec 16: +95.48%
- Dec 17: +19.17%
- Dec 18: +28.22%
- Dec 19: -51.98%
- Dec 20: -43.06%
- Dec 21: +114.64%
- Dec 22: +86.55%
- Dec 23: +74.83%
- Dec 24: +19.23%
- Dec 25: +0.00%
- Dec 26: +141.83%
- Dec 27: +16.48%
- Dec 28: -17.64%
Russell 2000 (since 1987)
- Dec 15: -36.23%
- Dec 16: +126.18%
- Dec 17: +29.33%
- Dec 18: -5.49%
- Dec 19: -48.61%
- Dec 20: +30.86%
- Dec 21: +160.91%
- Dec 22: +72.84%
- Dec 23: +103.88%
- Dec 24: +28.09%
- Dec 25: +0.00%
- Dec 26: +181.98%
- Dec 27: +7.37%
- Dec 28: -6.43%
The S&P 500 data dates back to 1950, while the NASDAQ and Russell 2000 information date back to 1971 and 1987, respectively.
Final Thoughts
I receive lots of questions and comments regarding my current cautious market stance. Feel free to agree or disagree, I simply call what I see. I don't claim to have a crystal ball, though our track record has been rather stellar when it comes to calling for periods of market uncertainty and potential selloffs. I will once again say that I see elevated risks of a fairly significant short-term decline. I'm not trying to guarantee a selloff. There's also a very real possibility that the stock market keeps rising into 2026. History certainly supports that notion. But I don't ignore risks when I see them.
I do not have any plans at the moment to re-establish our portfolio positions, though many of the positions in the recently-closed Model and Aggressive portfolios continue to perform fairly well. My suggestion, if you want to remain invested in positions, is to keep stops in play or consider hedges (covered calls, protective S&P puts, etc).
Here are a few things I'll be watching this week:
Delayed Reports. Tuesday will be a big day for delayed economic reports, including November nonfarm payrolls and October retail sales. While I believe the stock market will focus more on what it sees down the road, as opposed to what happened in the recent past, I am interested to see if the government jobs report mirrors the negative ADP employment report from last week. Also, does the unemployment rate spike? If so, that could really spook traders near-term.
Seasonality. Today marks the end of the first half of December, which typically is fairly flat - exactly how we've traded thus far in December 2025. The second half of December tends to be much more bullish, especially beginning on December 21st, as the annual Santa Claus rally kicks in.
Technical Support. Recent lows established with the November selling will be key technically. While I see reasons to be more cautious right now, it's price action and breakdowns that ultimately dictate weakness ahead.
Inflation. The November CPI report will be released on Thursday and given the interest-rate-decision split at the last FOMC meeting, any uptick in inflation would almost guarantee that rates will stay put at the next Fed meeting, scheduled for January 27-28. Currently, the odds of another rate cut in January sit at roughly 25%.
Growth vs. Value. Rather quietly, the growth vs. value ratio (IWF:IWD) has moved down very close to a 5-month low, while the S&P 500 remains fairly close to its all-time high. Why is Wall Street bailing from growth stocks?
Happy trading!
Tom