
EB Weekly Market Report - Monday, December 22, 2025
ChartLists/Spreadsheets
The following ChartLists/Spreadsheets were updated over the weekend:
- Strong Earnings (SECL)
- Strong Future Earnings (SFECL)
- Raised Guidance (RGCL)
- Bullish Trifecta (BTCL)
- Short Squeeze (SSCL)
- Leading Stocks (LSCL)
- Hot Stocks (HTCL)
- Key Manipulation Spreadsheet
The above ChartLists and spreadsheet have been updated. You can read more about our ChartLists on our website.
Weekly Market Recap
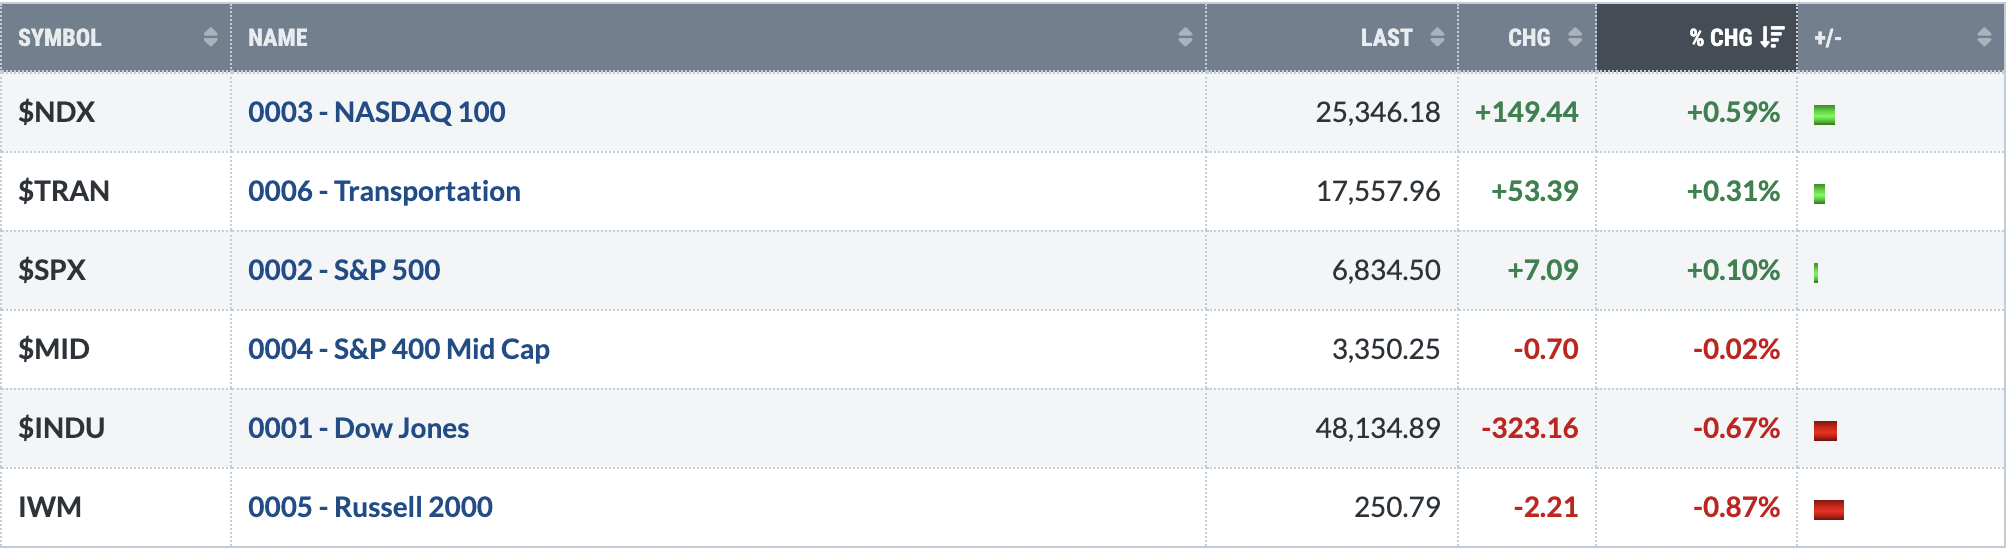
Major Indices
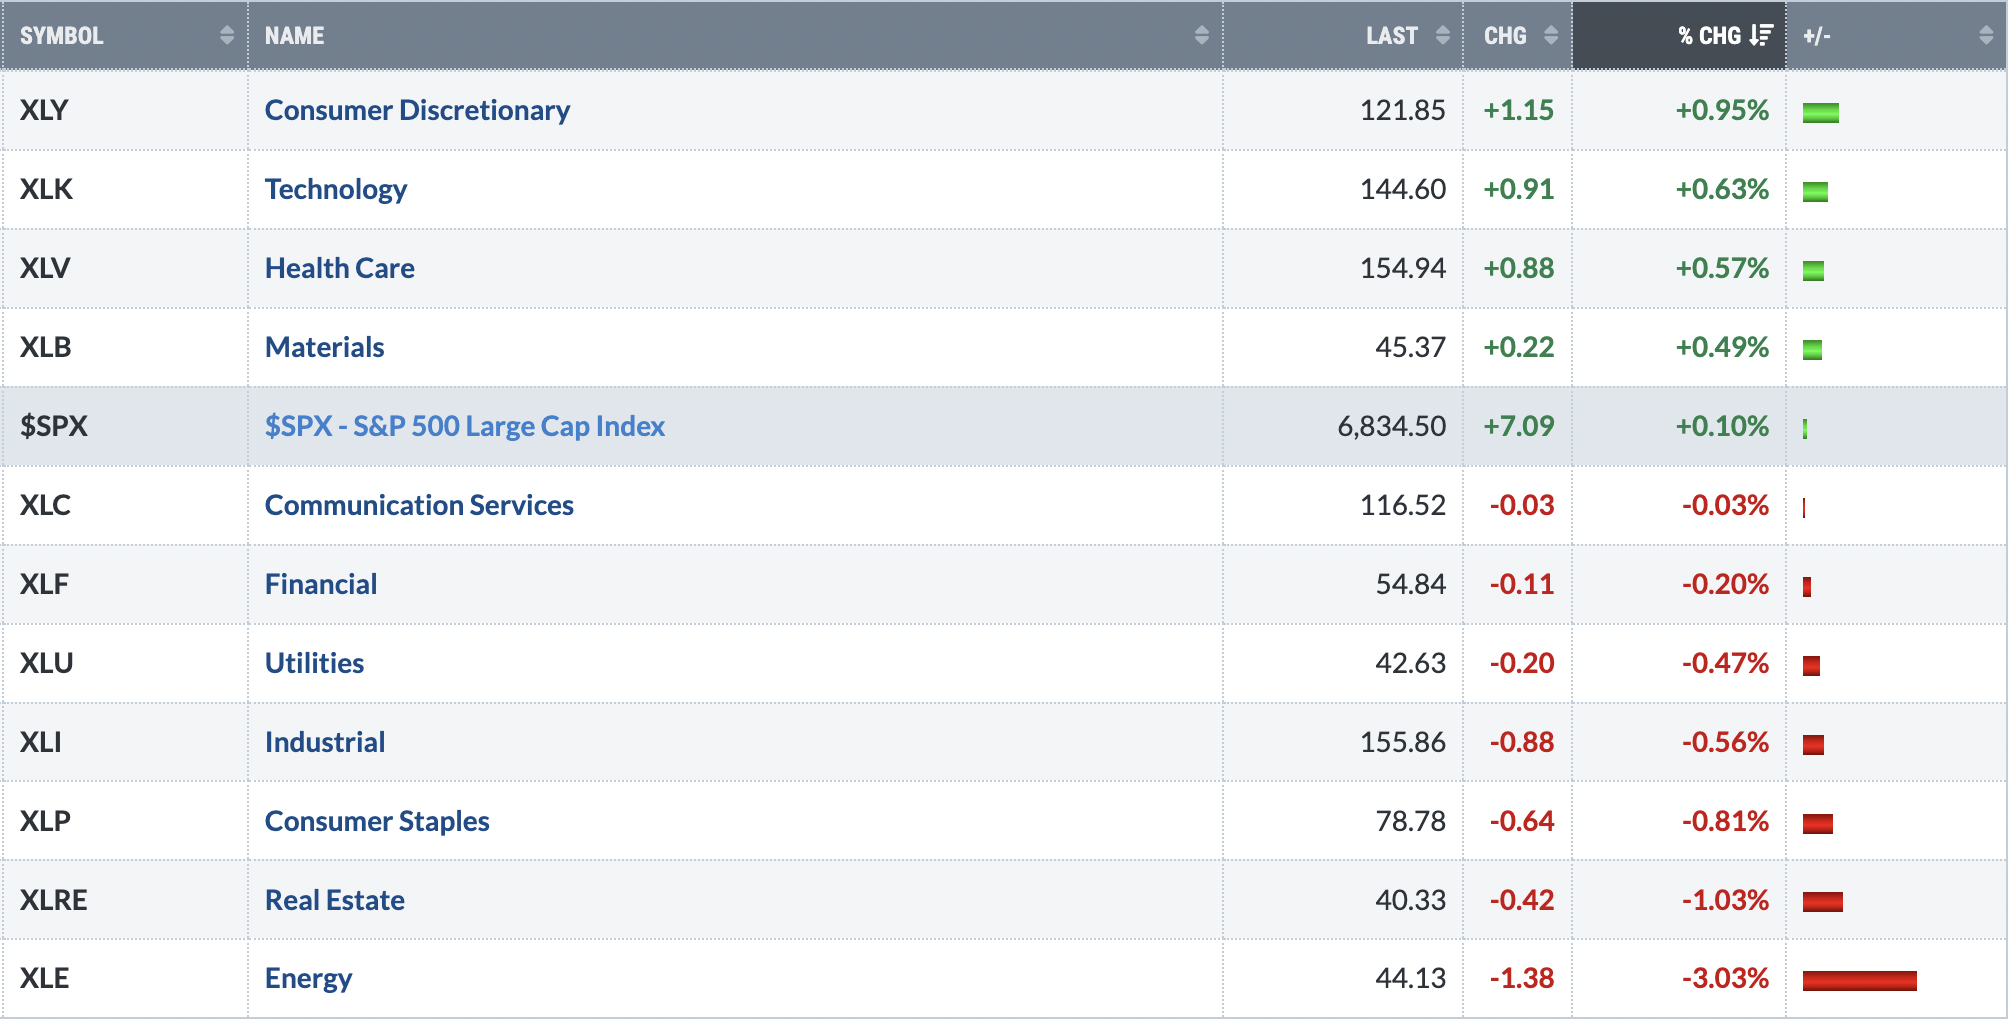
Sectors
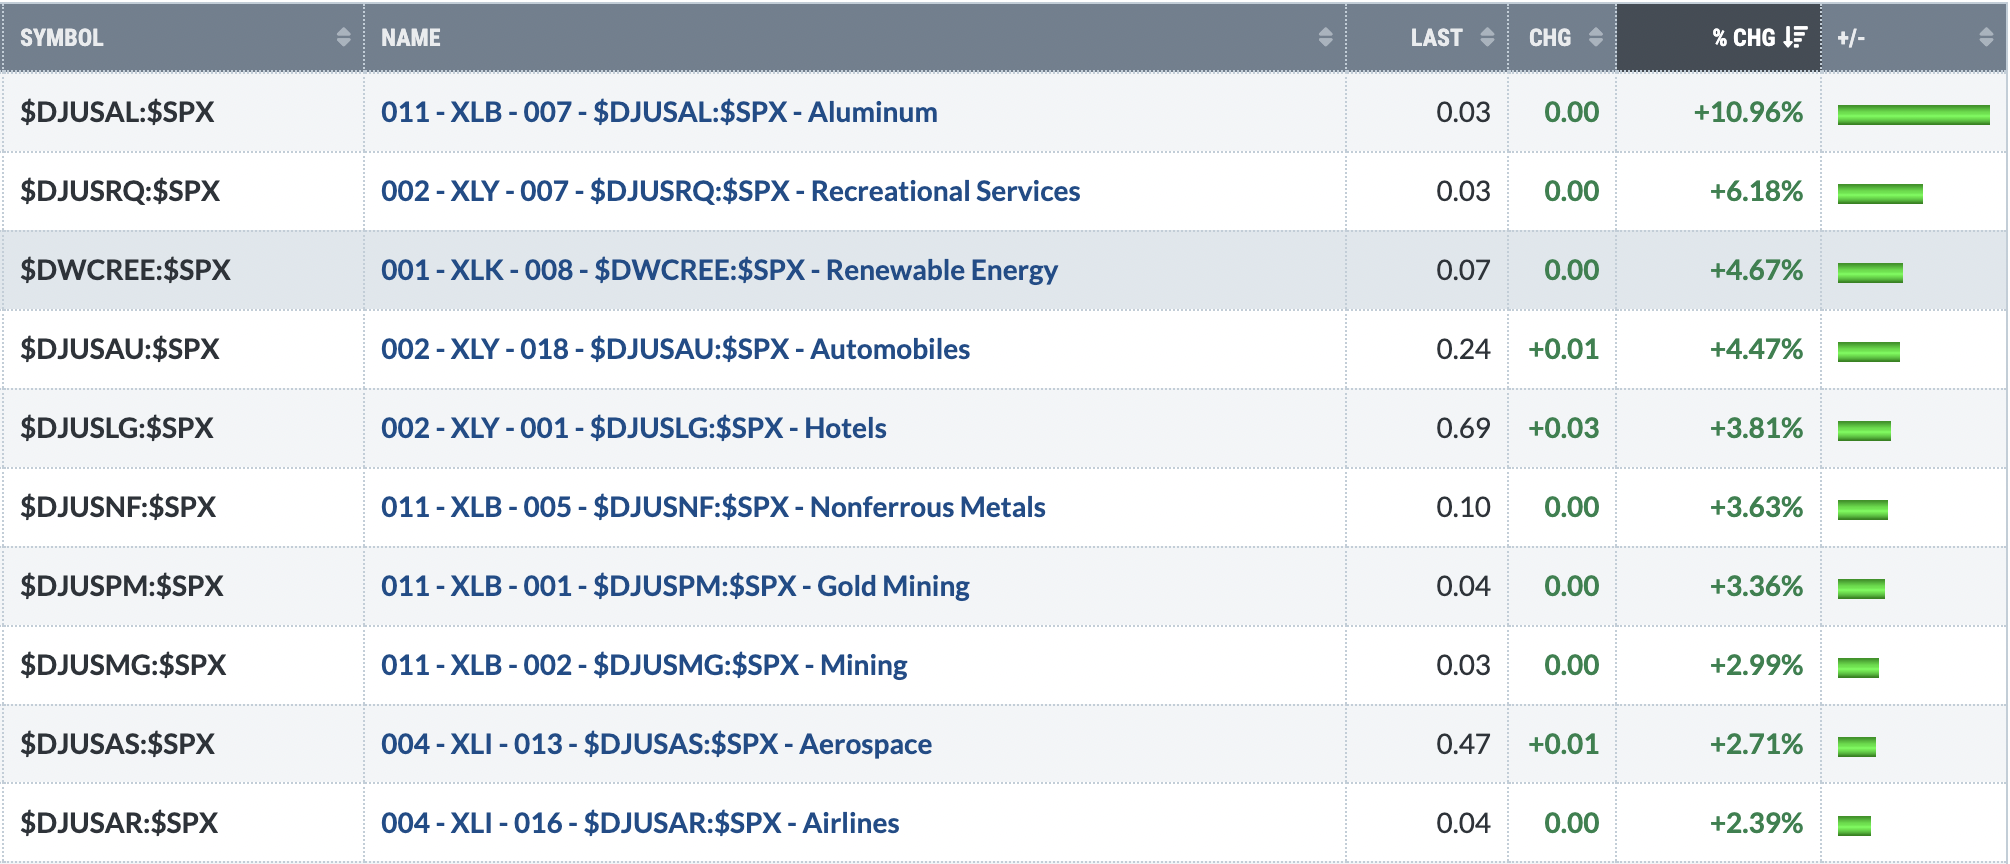
Top 10 Industries Last Week
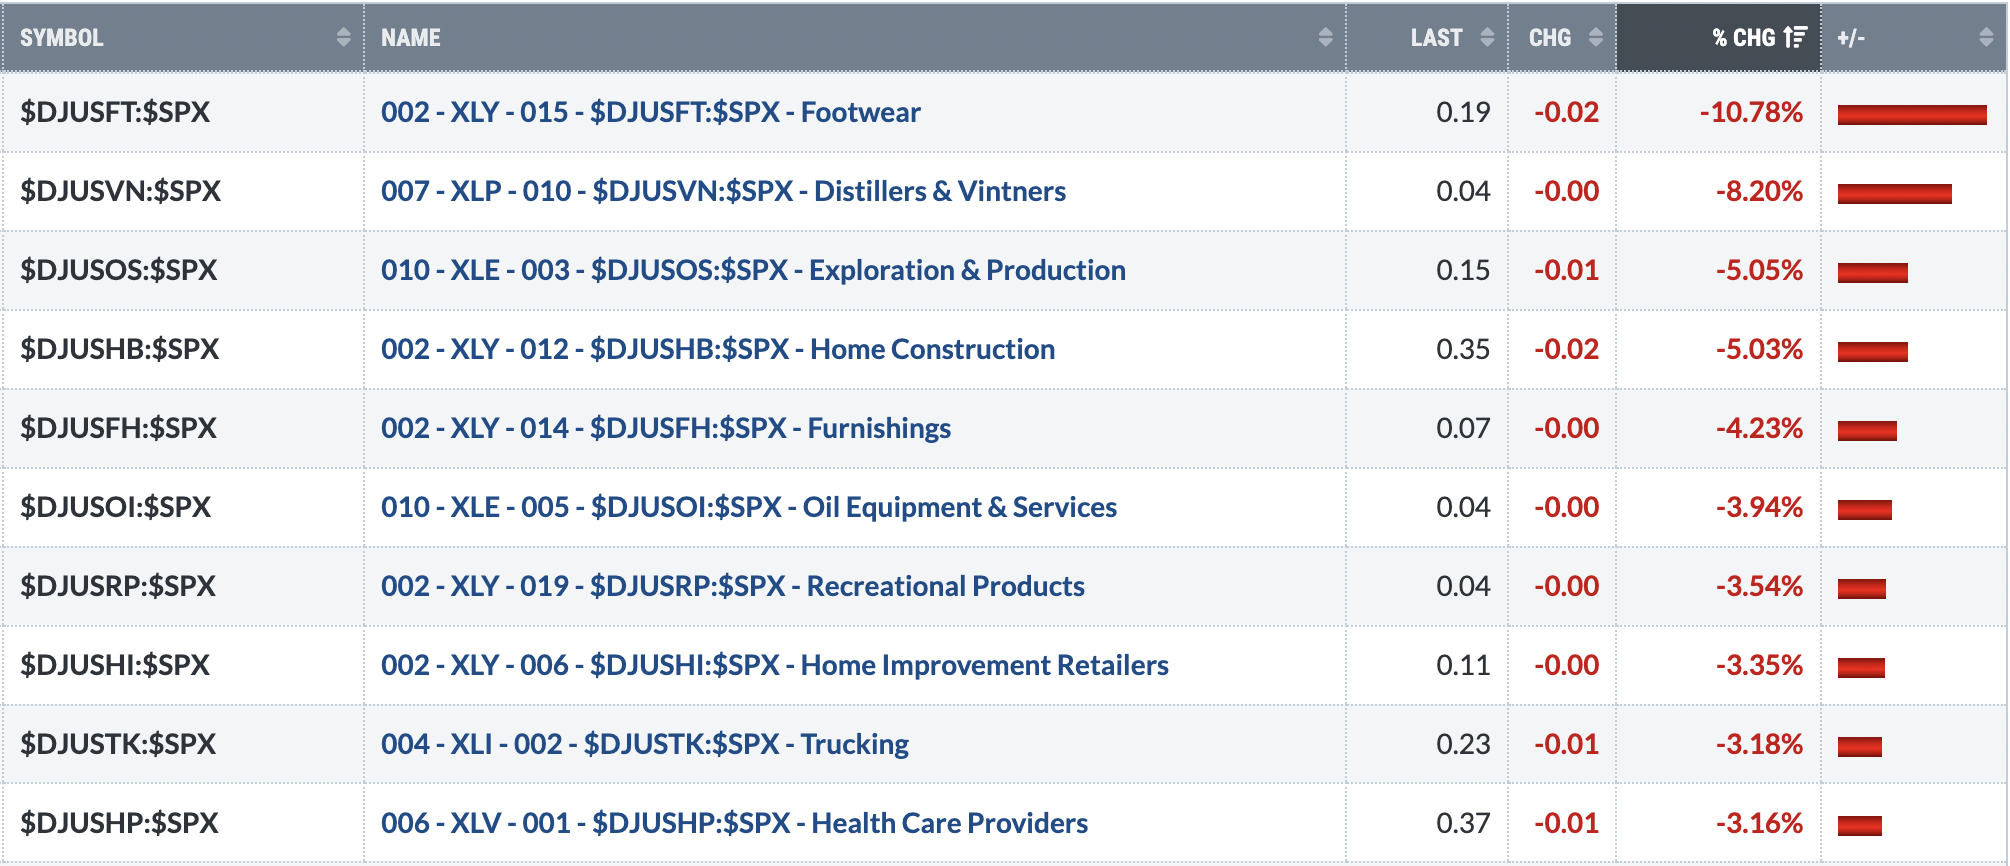
Bottom 10 Industries Last Week
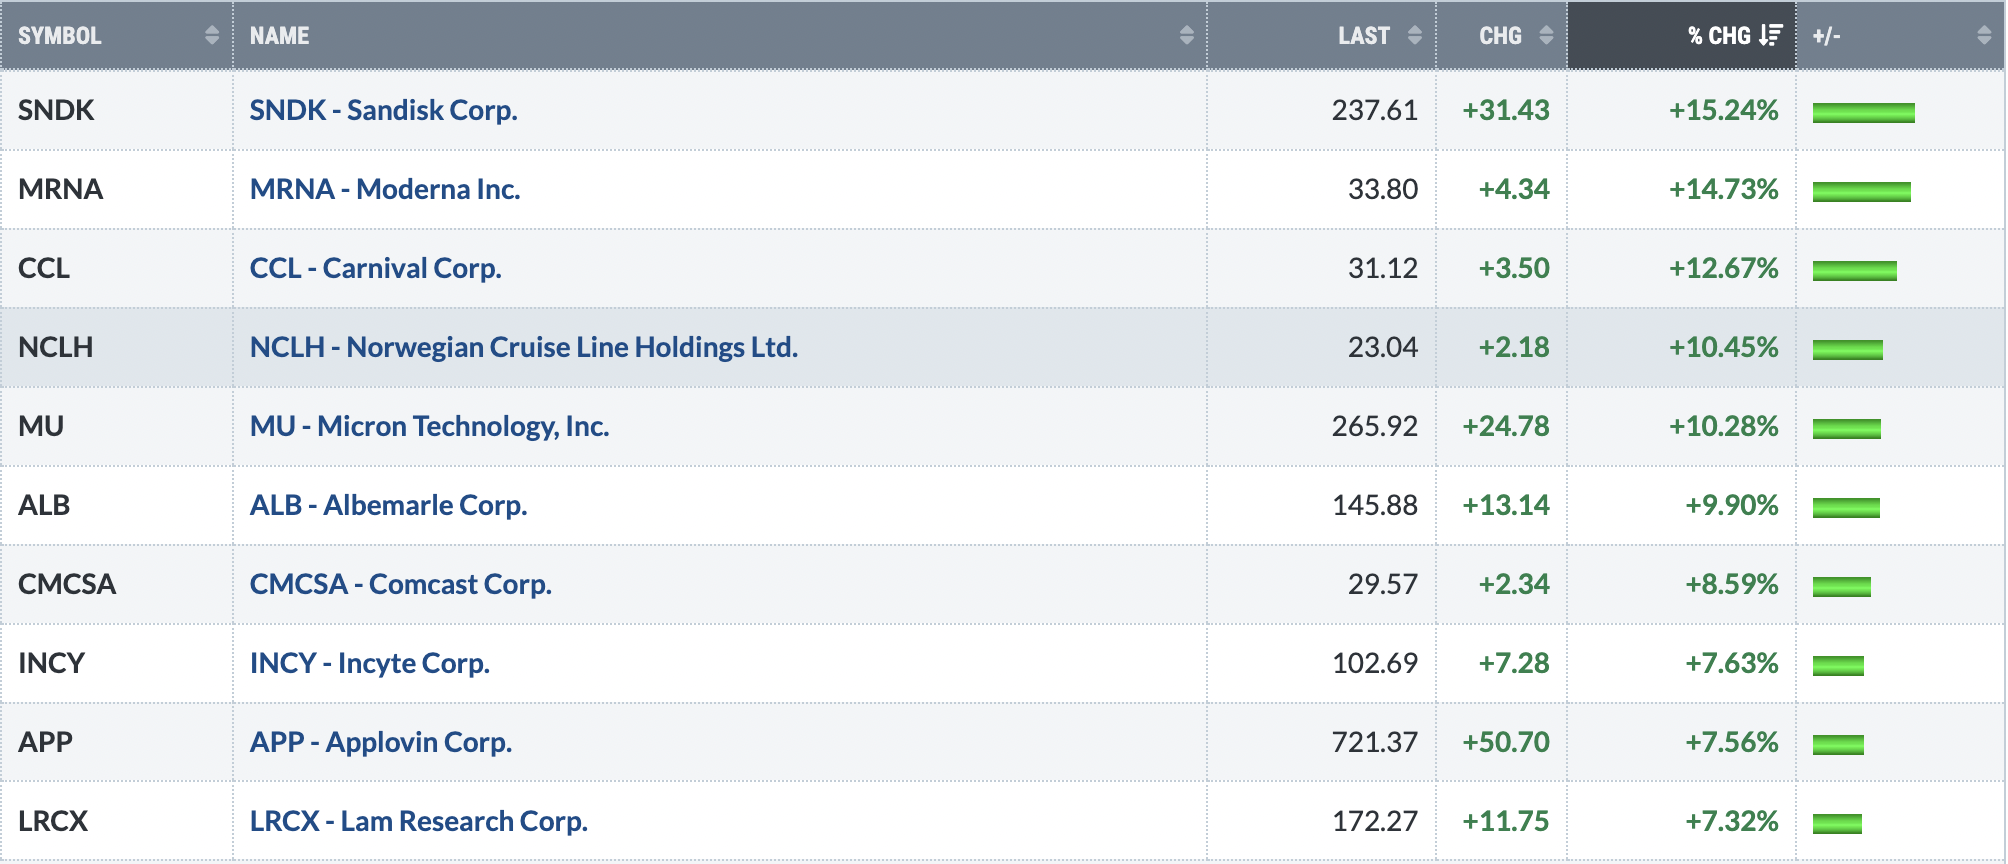
Top 10 Stocks - S&P 500/NASDAQ 100
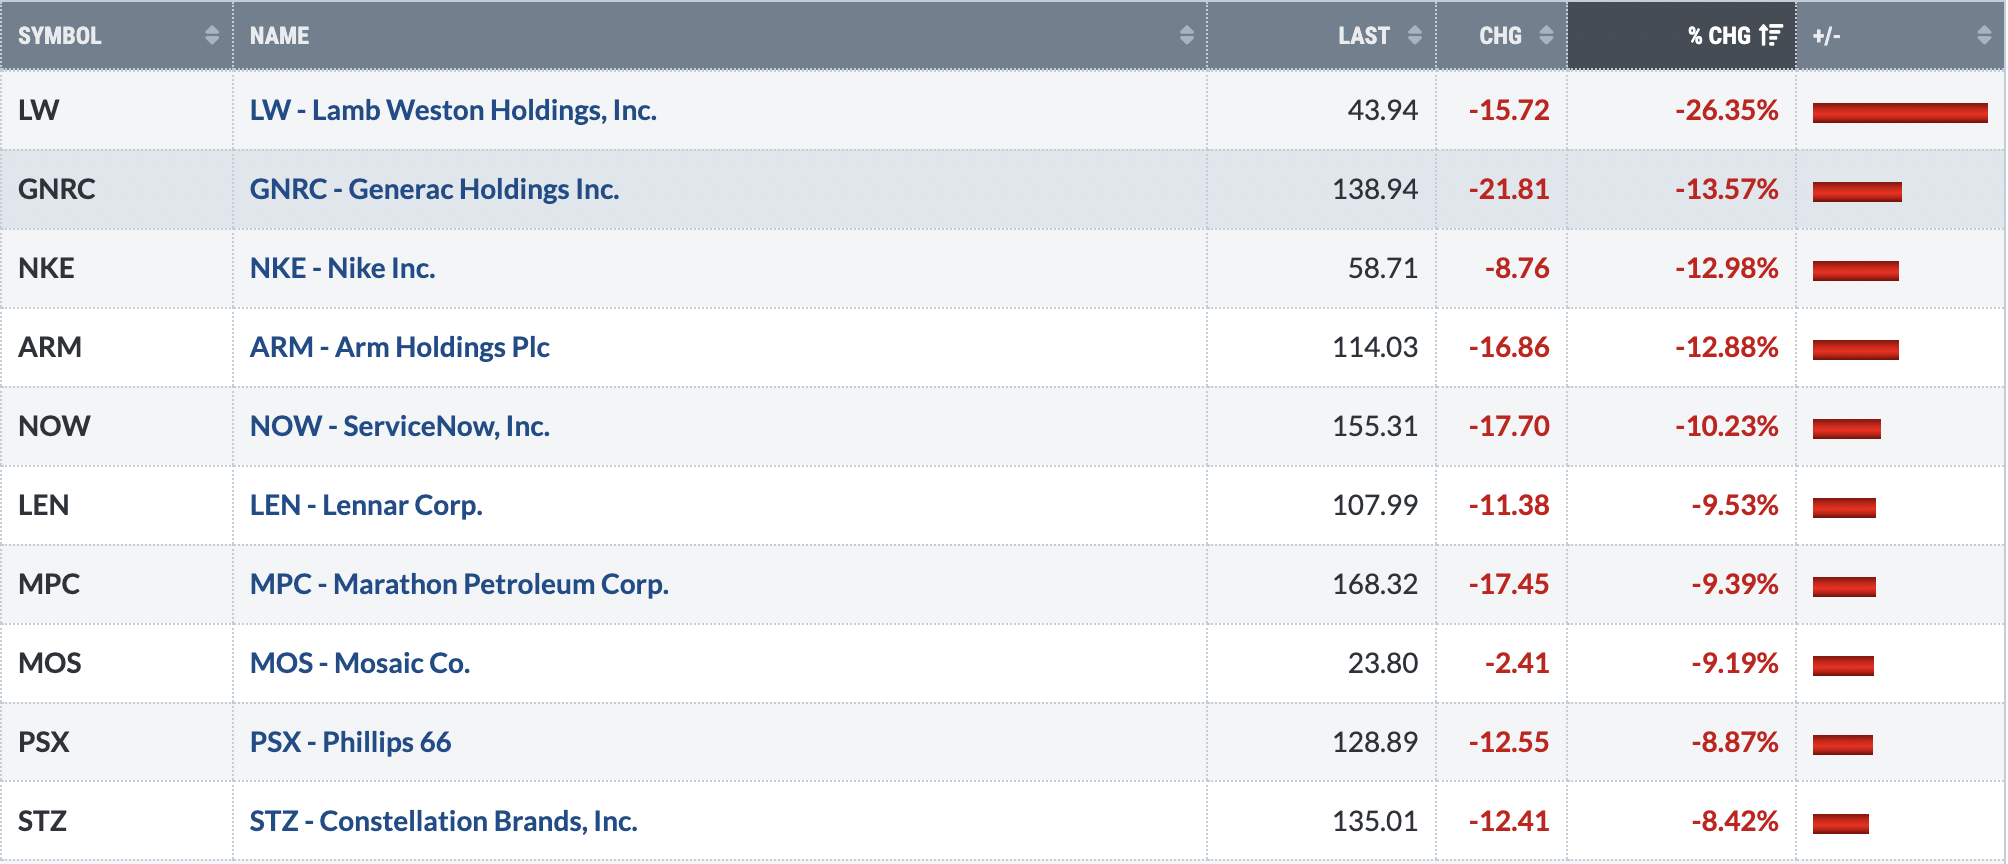
Bottom 10 Stocks - S&P 500/NASDAQ 100
Big Picture
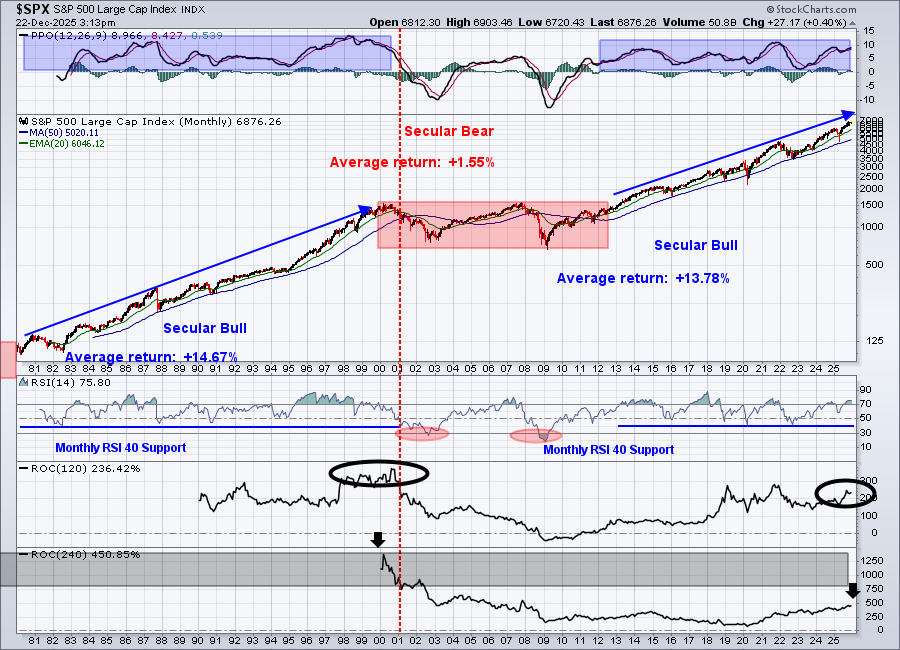
Well, we're about to watch another year come and go. For the past several years, it's made sense to ride out periods of weakness to enjoy the longer-term uptrend. Despite several warning signs that I'm currently seeing, none of it deters me from my longer-term bullish view. I believe it's prudent for long-term investors to simply stay the course.
Sustainability Ratios
Here's the latest look at our key intraday ratios as we follow where the money is traveling on an INTRADAY basis (ignoring gaps):
QQQ:SPY
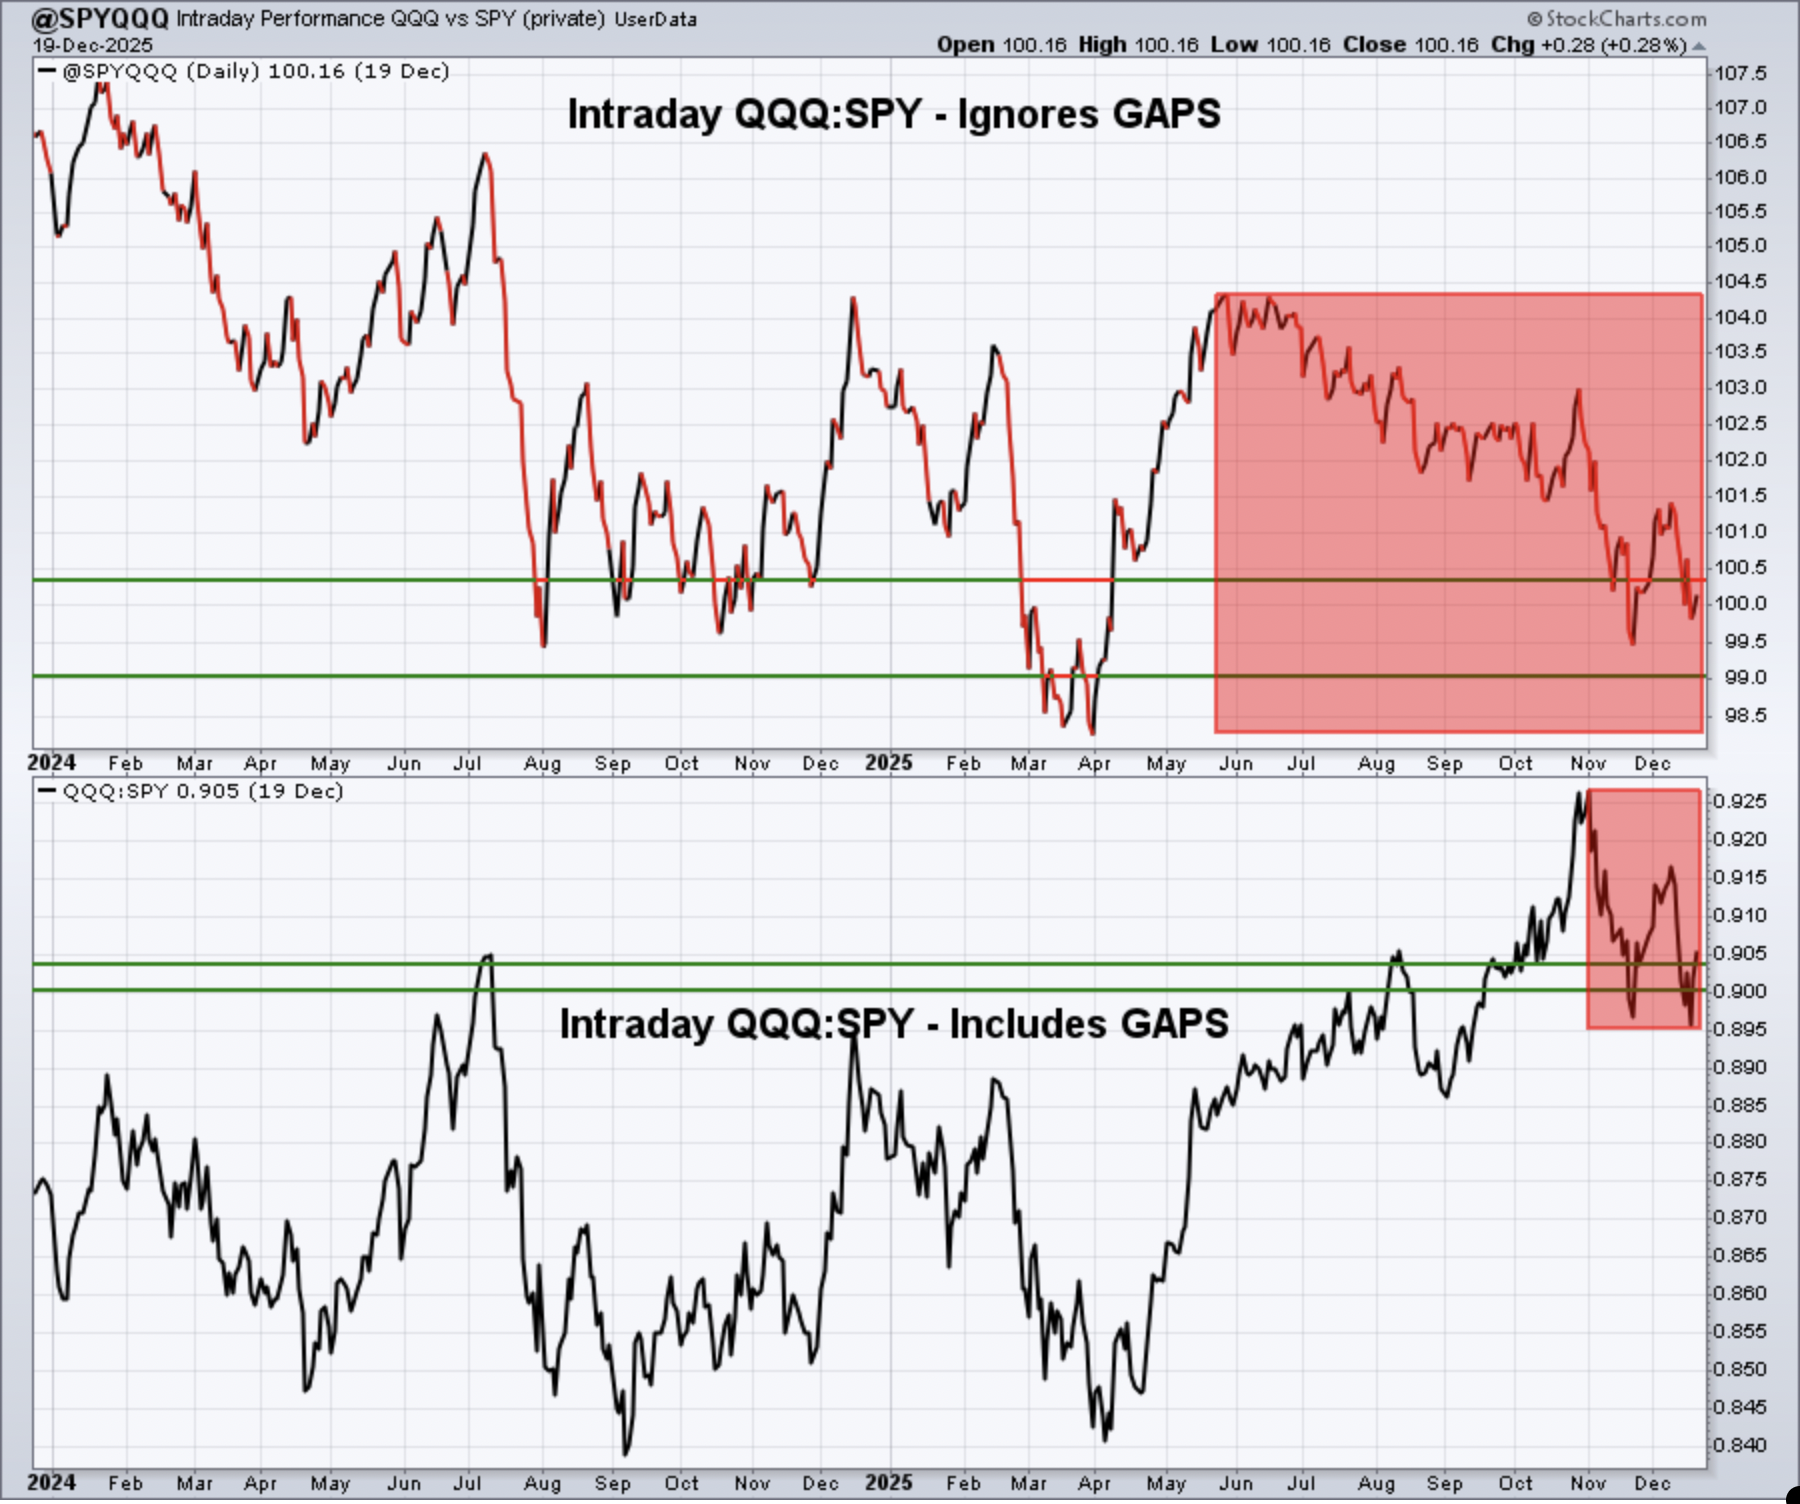
Keep in mind that the intraday analysis provided is a "work in progress". I continue to analyze this data to see if it helps provide us clues about calling market direction. It makes common sense to me that it should help in some sense, but it'll require a much longer-term study to determine its worth. I don't the like the steady decline in that top panel, which ignores gaps. For the past 7-8 months, it appears as though money has rotated rather heavily toward the more value-oriented S&P 500. That could take its toll on the S&P 500 in time.
IWM:QQQ
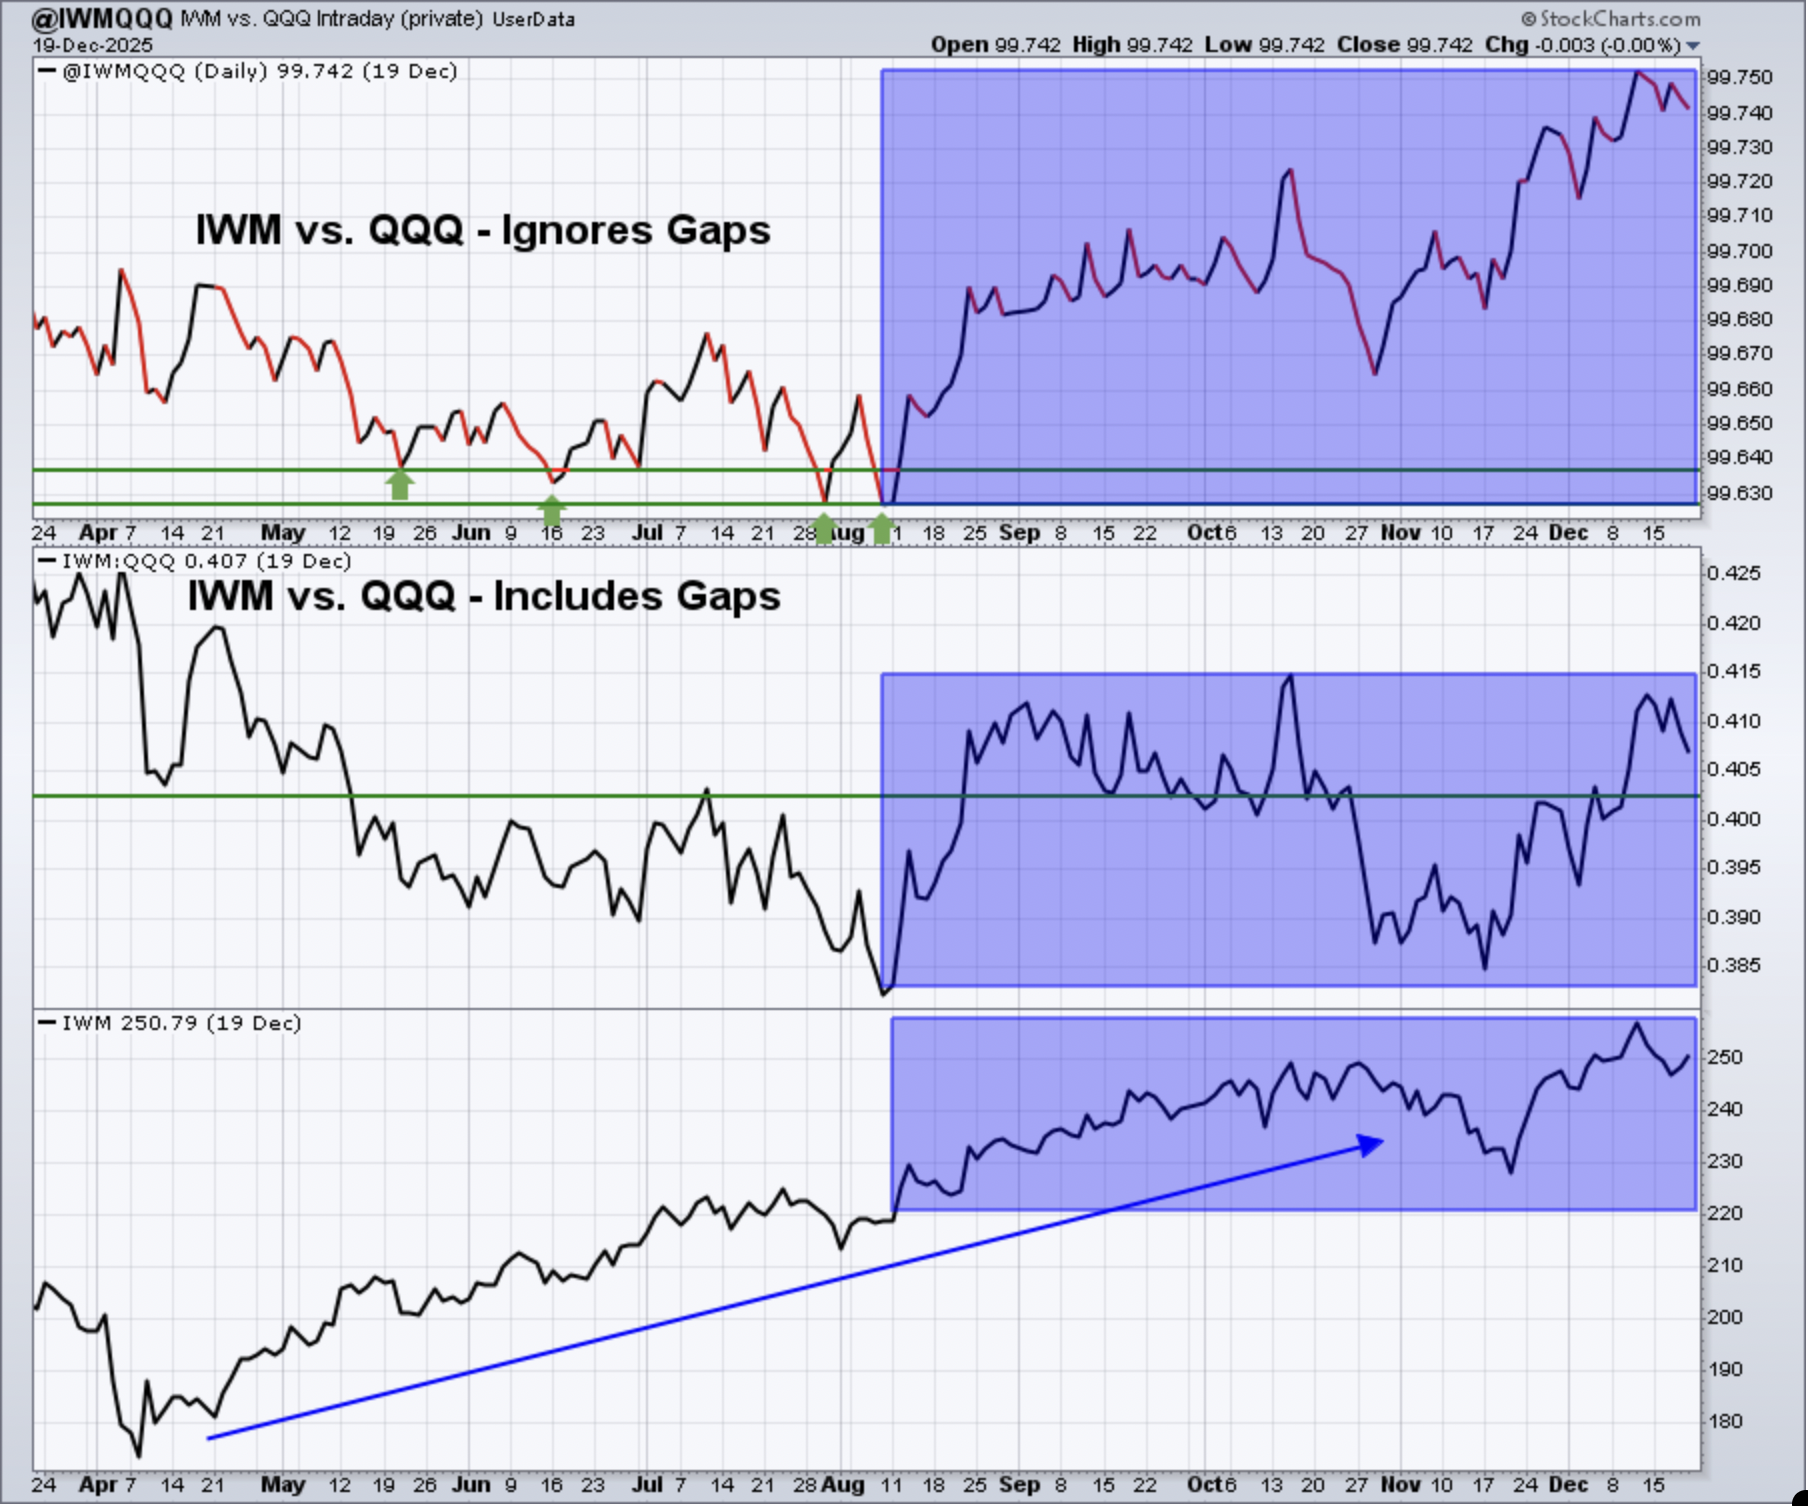
For the past four months, money also has rotated intraday into the small cap Russell 2000 (IWM) and away from the large-cap, growth-oriented NASDAQ 100 (QQQ). This definitely could be an indication that small caps will outperform in the year ahead, or at least to start the year.
XLY:XLP
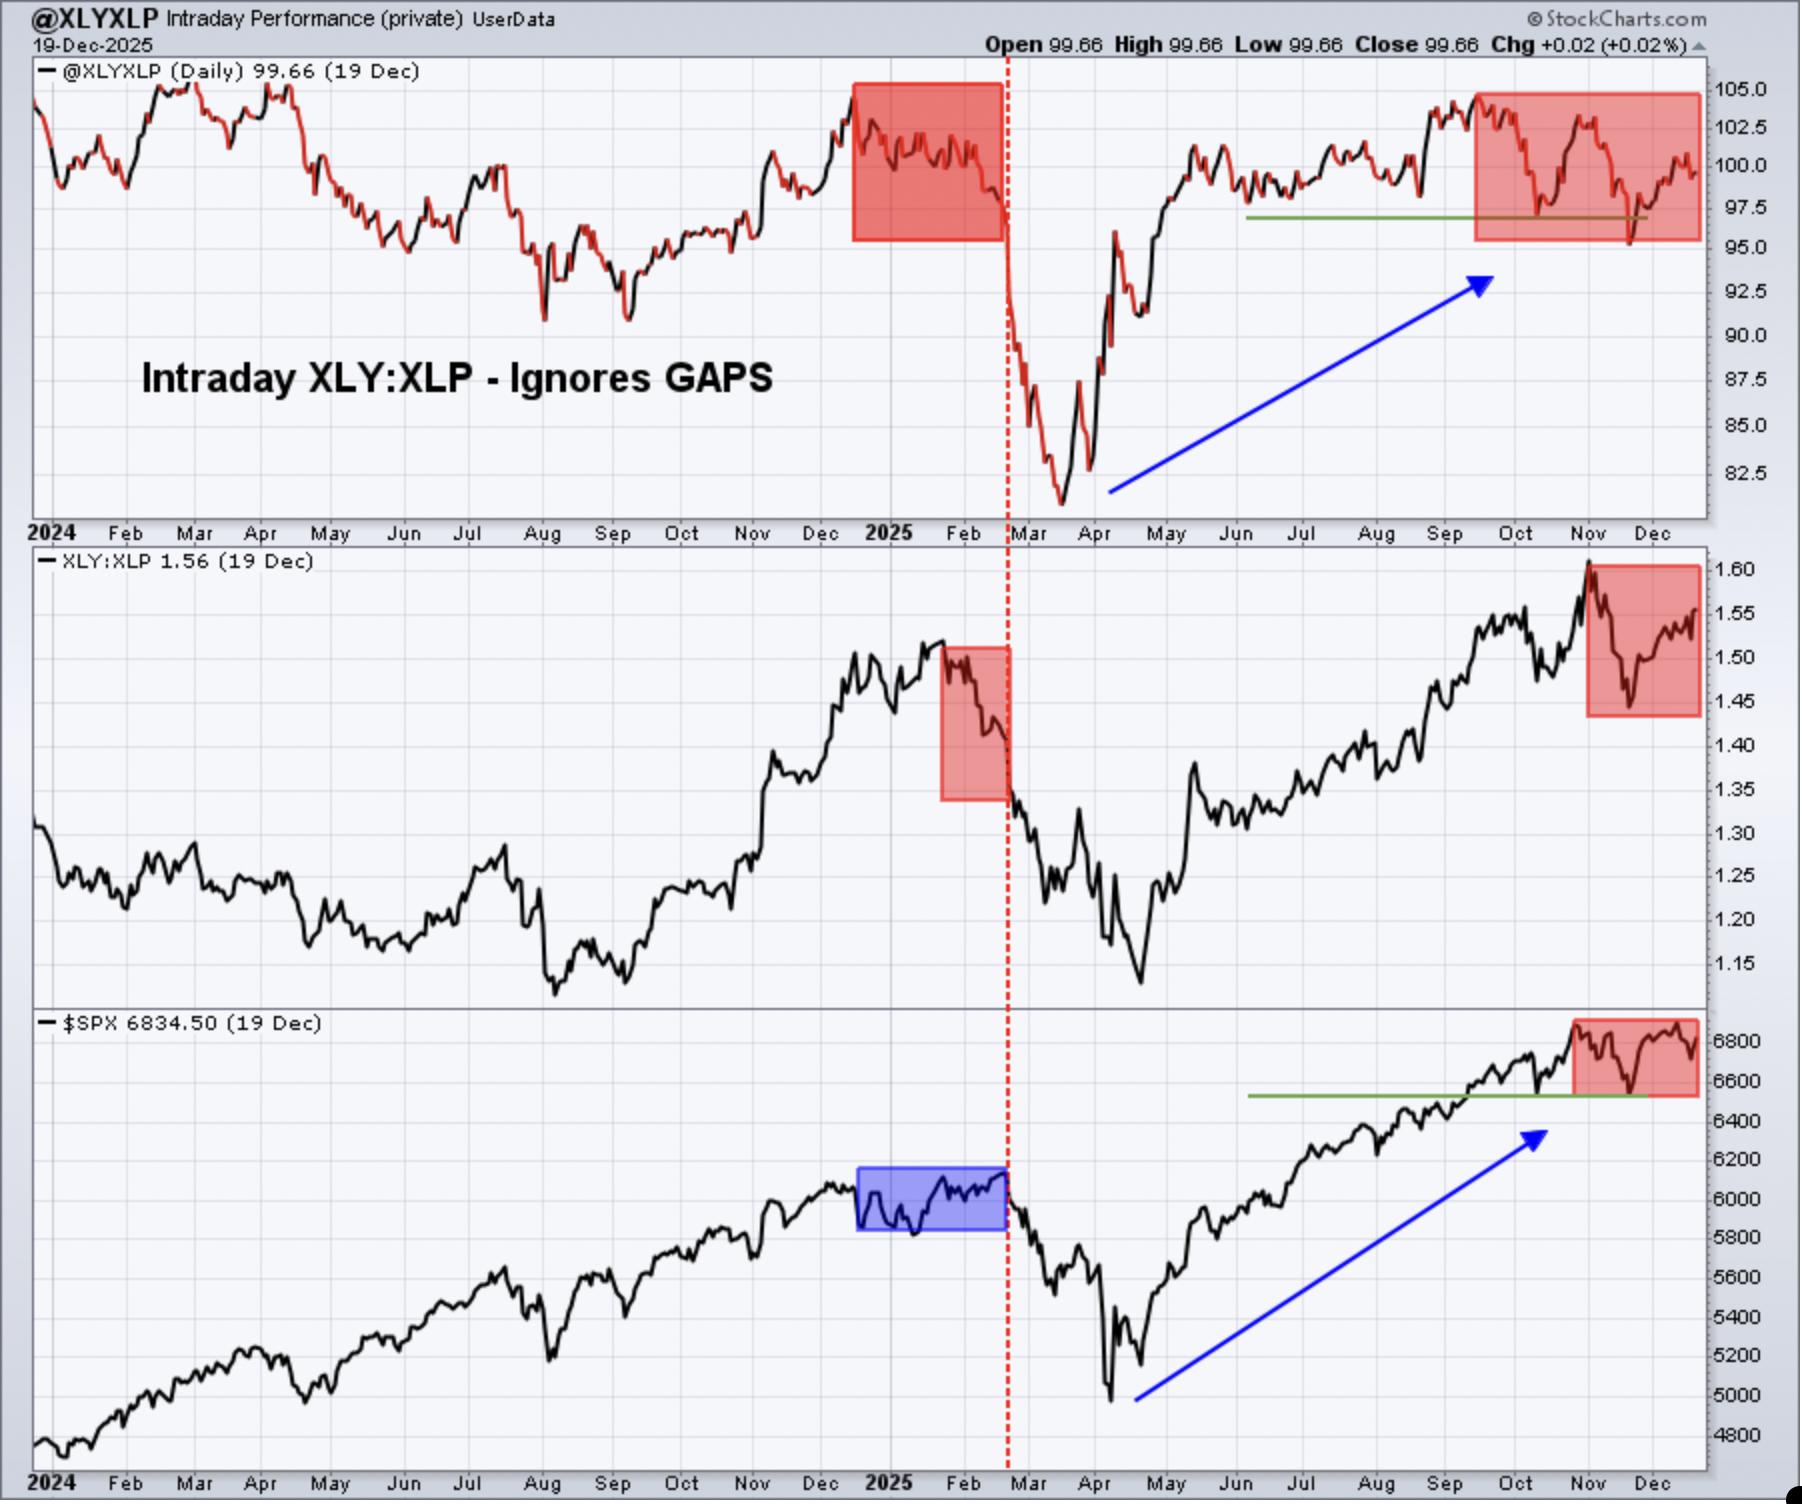
While the rebound continues on the XLY vs. XLP ratio that includes gaps, the intraday XLY:XLP ratio that ignores gaps is beginning to roll over again and is much more suspicious.
Sentiment
5-day SMA ($CPCE)
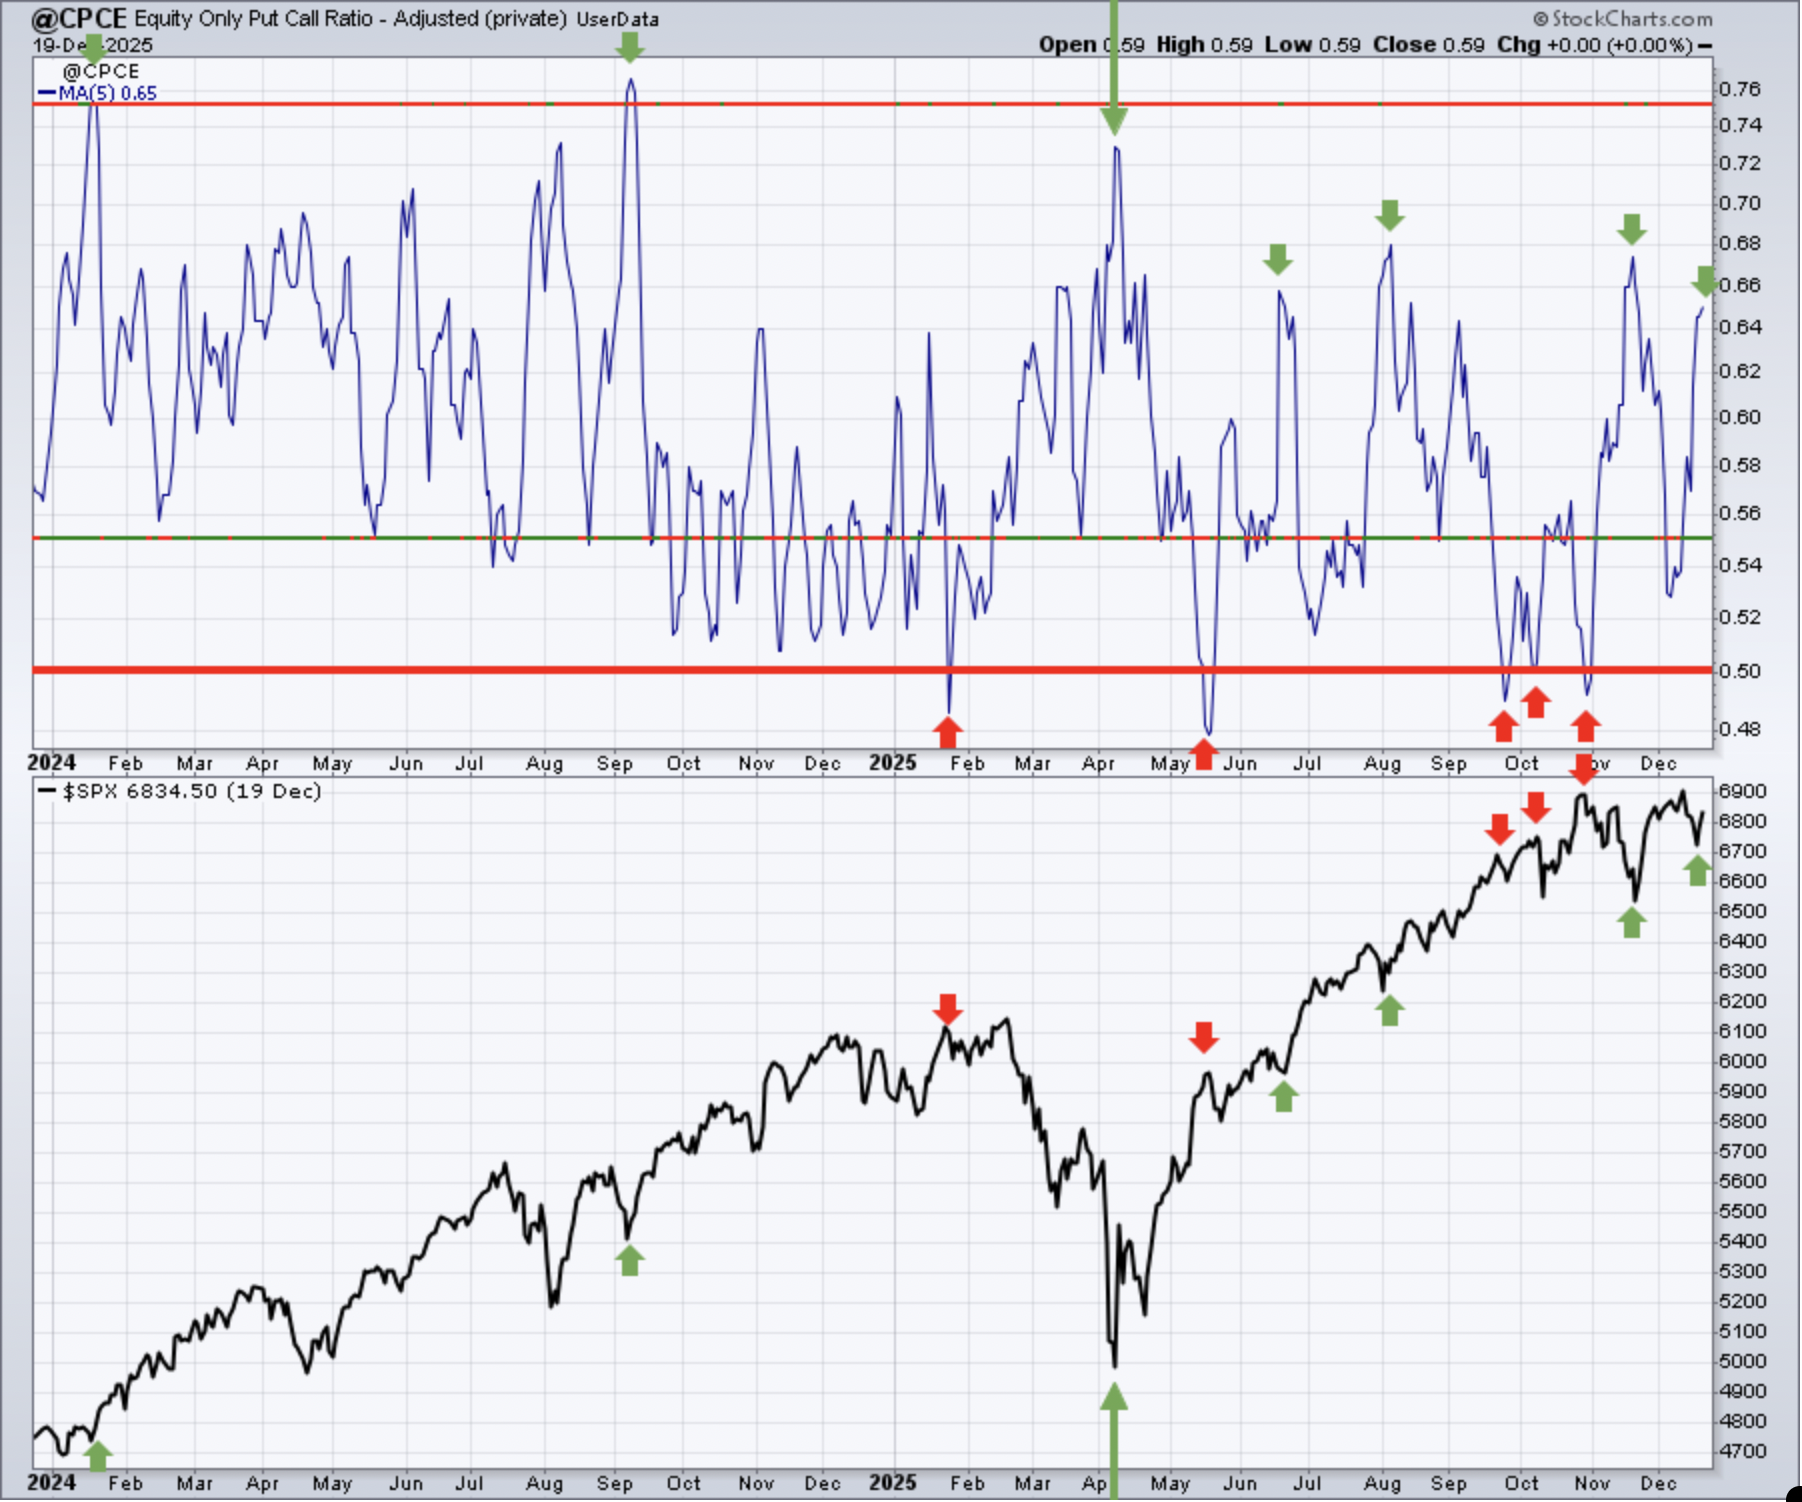
Sentiment indicators are contrarian indicators. When they show extreme bullishness, we need to be a bit cautious and when they show extreme pessimism, it could be time to become much more aggressive. Major market bottoms are carved out when pessimism is at its absolute highest level.
Keep in mind that the above 5-day SMA reading of the CPCE is our "speed boat" sentiment indicator that changes quite frequently. This sentiment indicator moved back into the mid-.60s and that small surge in pessimism among options traders marked the most recent bottom. We remain in the mid-.60s, which is a bit surprising given the fact that we've seen a decent rebound off the December low from last week.
253-day SMA ($CPCE)
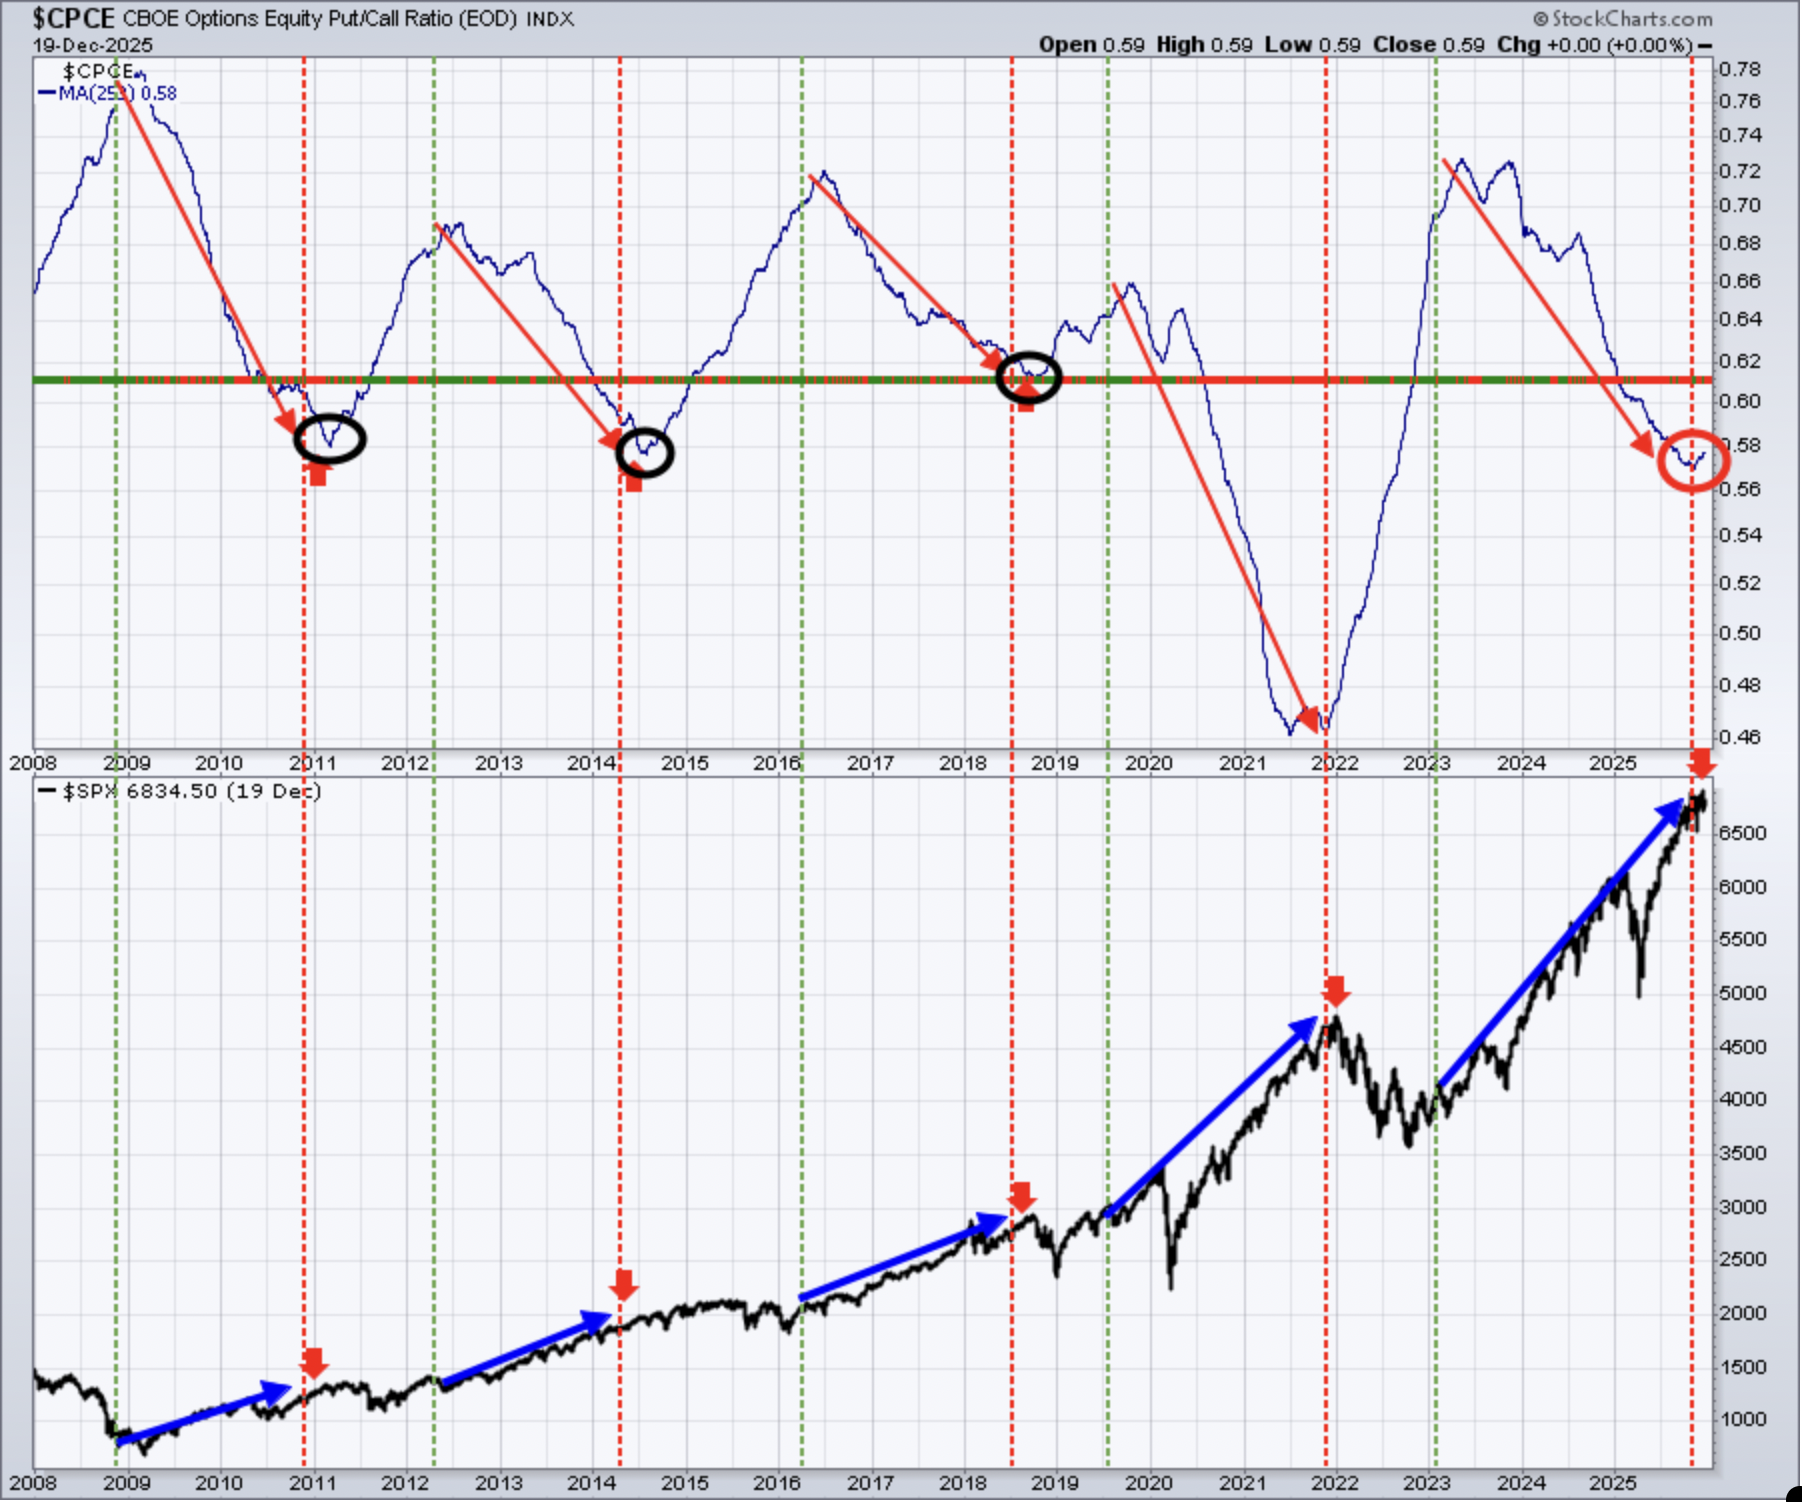
This longer-term 253-day SMA of the CPCE is our "ocean-liner" signal, unlike our short-term speedboat indicator. Any significant change in direction in this 253-day CPCE, in the past, has had profound effects on the S&P 500. I wouldn't want to bet against what this indicator is telling us, which is that we should be cautious heading into 2026.
Long-Term Trade Setup
Since beginning this Weekly Market Report in September 2023, I've discussed the long-term trade candidates below that I really like. Generally, these stocks have excellent long-term track records, and many pay nice dividends that mostly grow every year. Only in specific cases (exceptions) would I consider a long-term entry into a stock that has a poor or limited long-term track record and/or pays no dividends. I try to review the long-term picture once a month or so. Below is a quick recap of how these stocks looked as of Monday, December 5th:
- JPM – it's still quite strong, but extended
- BA – has rebounded to test its 20-week EMA from underneath
- FFIV – tested its April low and now bouncing
- MA – I'd keep an eye on price support near 525
- GS – very strong uptrend continues; great performance and overbought
- FDX – has been surging off its early-October low
- AAPL – seen profit taking last week or so, but lots of new highs set recently
- CHRW – has nearly doubled off its April low
- JBHT – now challenging overhead resistance in 190-195 range
- STX - very hot stock, has now more than quadrupled off its April low
- HSY – held 160 and bounced; still needs to clear 200
- DIS – 125 resistance remains the key
- MSCI – drifting lower again, initial support close to 520
- SBUX - another in a lengthy consolidation period, needs to hold 70 on selling
- KRE – bounced off 57.50 support, now staring at price resistance in 67-68 area
- ED – 95 is the support I'm watching on the weekly chart and it's perilously close
- AJG – after years of uninterrupted strength, AJG is rapidly descending
- NSC – 270 support held, now comes 300 resistance
- RHI – found buyers at 25, still not out of the woods from all the sellers
- ADM – I think solid support near 55 has been established
- BG – combination of 87 bucks and 20-week EMA should provide support
- CVS – testing rising 20-week EMA
- IPG – weakening again, another trip to 22-23 range is increasing
- HRL - losing 25 was bad technically, now that's key resistance
- DE – struggling at 20-week EMA, a break above would be bullish
- LULU - rallied to test falling 20-week EMA, but failing thus far to clear
- TTD - trying to hang onto multi-year price support near 39-40
- META - had a solid week after being added, but can it clear its 20-week EMA?
We are adding Adobe Systems (ADBE) to our list. ADBE is beginning to show signs of accumulation after a few years of poor performance. Monthly RSI is turning back up, but still only resides at 41, a favorable level for long-term entry, in my opinion. We could see a bit more near-term weakness, but I believe the potential upside reward now significantly outweighs the potential downside risk.
Here's the long-term chart of ADBE:
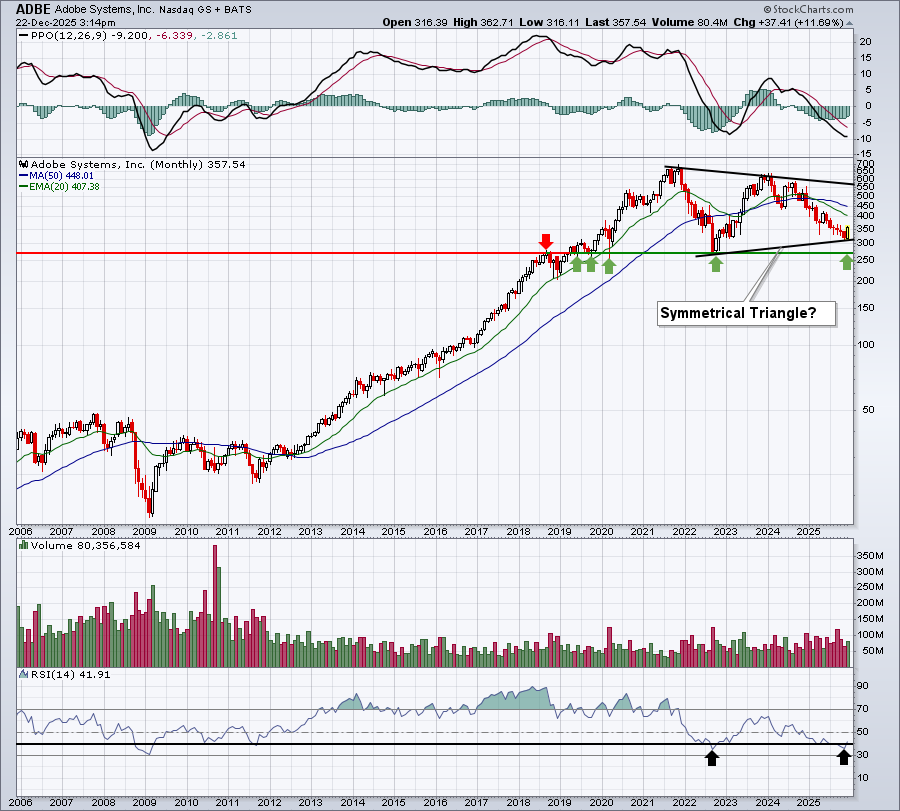
We could be starting a bullish symmetrical triangle, which has lower highs and higher lows, squeezing into a triangle. These types of patterns tend to break out in the direction of the prior trend, which clearly was higher.
Keep in mind that our Weekly Market Reports favor those who are more interested in the long-term market picture. Therefore, the list of stocks above are stocks that we believe are safer (but nothing is ever 100% safe) to own with the long-term in mind. Nearly everything else we do at EarningsBeats.com favors short-term momentum trading, so I wanted to explain what we're doing with this list and why it's different.
Also, please keep in mind that I'm not a Registered Investment Advisor (and neither is EarningsBeats.com nor any of its employees) and am only providing (mostly) what I believe to be solid dividend-paying stocks for the long term. Companies periodically go through adjustments, new competition, restructuring, management changes, etc. that can have detrimental long-term impacts. Neither the stock price nor the dividend is ever guaranteed. I simply point out interesting stock candidates for longer-term investors. Do your own due diligence and please consult with your financial advisor before making any purchases or sales of securities.
Looking Ahead
Upcoming Earnings
The following list of companies is NOT a list of all companies scheduled to report quarterly earnings, however, just key reports, so please be sure to check for earnings dates of any companies that you own. Any company in BOLD represents a stock in one of our portfolios and the amount in parenthesis represents the market capitalization of each company listed:
- Monday: None
- Tuesday: None
- Wednesday: None
- Thursday: None
- Friday: None
Key Economic Reports
- Monday: None
- Tuesday: Q3 GDP (delayed), October durable goods (delayed), October industrial production & capacity utilization, December consumer confidence
- Wednesday: Initial jobless claims
- Thursday: None
- Friday: None
Historical Data
I'm a true stock market historian. I am absolutely PASSIONATE about studying stock market history to provide us more clues about likely stock market direction and potential sectors/industries/stocks to trade. While I don't use history as a primary indicator, I'm always very aware of it as a secondary indicator. I love it when history lines up with my technical signals, providing me with much more confidence to make particular trades.
Below you'll find the next two weeks of historical data and tendencies across the three key indices that I follow most closely. The percentage for each calendar day represents the annualized return for that day. An example of how this is calculated is reflected next to the first day under the S&P 500 and in parenthesis:
S&P 500 (since 1950)
- Dec 22: +32.01% (Ex: cumulative gains = +6.71% over 53 trading days since 1950. +6.71% x 253/53 = +32.01%)
- Dec 23: +19.83%
- Dec 24: +33.54%
- Dec 25: +0.00%
- Dec 26: +123.20%
- Dec 27: +34.59%
- Dec 28: -9.70%
- Dec 29: +42.91%
- Dec 30: +24.00%
- Dec 31: +35.73%
- Jan 1: +0.00%
- Jan 2: +68.84%
- Jan 3: +47.93%
- Jan 4: +21.92%
NASDAQ (since 1971)
- Dec 22: +86.55%
- Dec 23: +74.83%
- Dec 24: +19.23%
- Dec 25: +0.00%
- Dec 26: +141.83%
- Dec 27: +16.48%
- Dec 28: -17.64%
- Dec 29: +54.26%
- Dec 30: +35.41%
- Dec 31: +82.80%
- Jan 1: +0.00%
- Jan 2: +59.78%
- Jan 3: +129.27%
- Jan 4: -17.83%
Russell 2000 (since 1987)
- Dec 22: +72.84%
- Dec 23: +103.88%
- Dec 24: +28.09%
- Dec 25: +0.00%
- Dec 26: +181.98%
- Dec 27: +7.37%
- Dec 28: -6.43%
- Dec 29: +48.50%
- Dec 30: +68.88%
- Dec 31: +91.46%
- Jan 1: +0.00%
- Jan 2: -10.05%
- Jan 3: +21.97%
- Jan 4: -30.37%
The S&P 500 data dates back to 1950, while the NASDAQ and Russell 2000 information date back to 1971 and 1987, respectively.
Final Thoughts
Nonfarm payrolls came in better than expected last week, helping to reassure traders that the economic house is not crumbling. Then we saw excellent news on the inflation front. This all led to strong market action, overall, with our major indices moving back towards all-time highs. Still, many risk-on areas continue to struggle, even with excellent news on the economic and inflationary fronts. That keeps me cautious.
Here are a few things I'll be watching this week:
Santa Claus Rally. Many market pundits define the dates of a potential Santa Claus rally a bit differently, but nearly everyone will agree that U.S. stocks have shown a very real tendency to move higher into year end. I'd be somewhat surprised if the S&P 500 didn't set another all-time high this week or next. I believe our 2025 S&P 500 target of 7000 is still very much in play.
Lack of Fundamental News. There will be few earnings reports out this week and very little economic news. Perhaps the biggest news will be Q3 GDP, which was delayed due to the government shutdown. The forecast is 3.2%, which is solid. The market might not react kindly to a lower number as many investors/traders are already nervous about the economy.
Growth vs. Value. I continue to watch the growth vs. value ratio (IWF:IWD) closely. Why haven't we seen a huge rotation back into growth following better-than-expected jobs data AND a flat print on Core CPI?
Happy trading!
Tom