
EB Weekly Market Report - Monday, February 9, 2026
ChartLists/Spreadsheets
The following ChartLists/Spreadsheets were updated over the weekend:
- Strong Earnings (SECL)
- Strong Future Earnings (SFECL)
- Raised Guidance (RGCL)
- Strong AD (SADCL)
- Bullish Trifecta (BTCL)
- Leading Stocks (LSCL)
- Matt's Hot Stocks (HTCL)
- Key Manipulation Spreadsheet
- Upcoming Earnings
- Upcoming Earnings Relative Strength
The above ChartLists and spreadsheet have been updated through Friday, February 6th. You can view and/or download these ChartLists from our website, and also read about them to gain a better understanding of how they can help in your trading success.
Weekly Market Recap
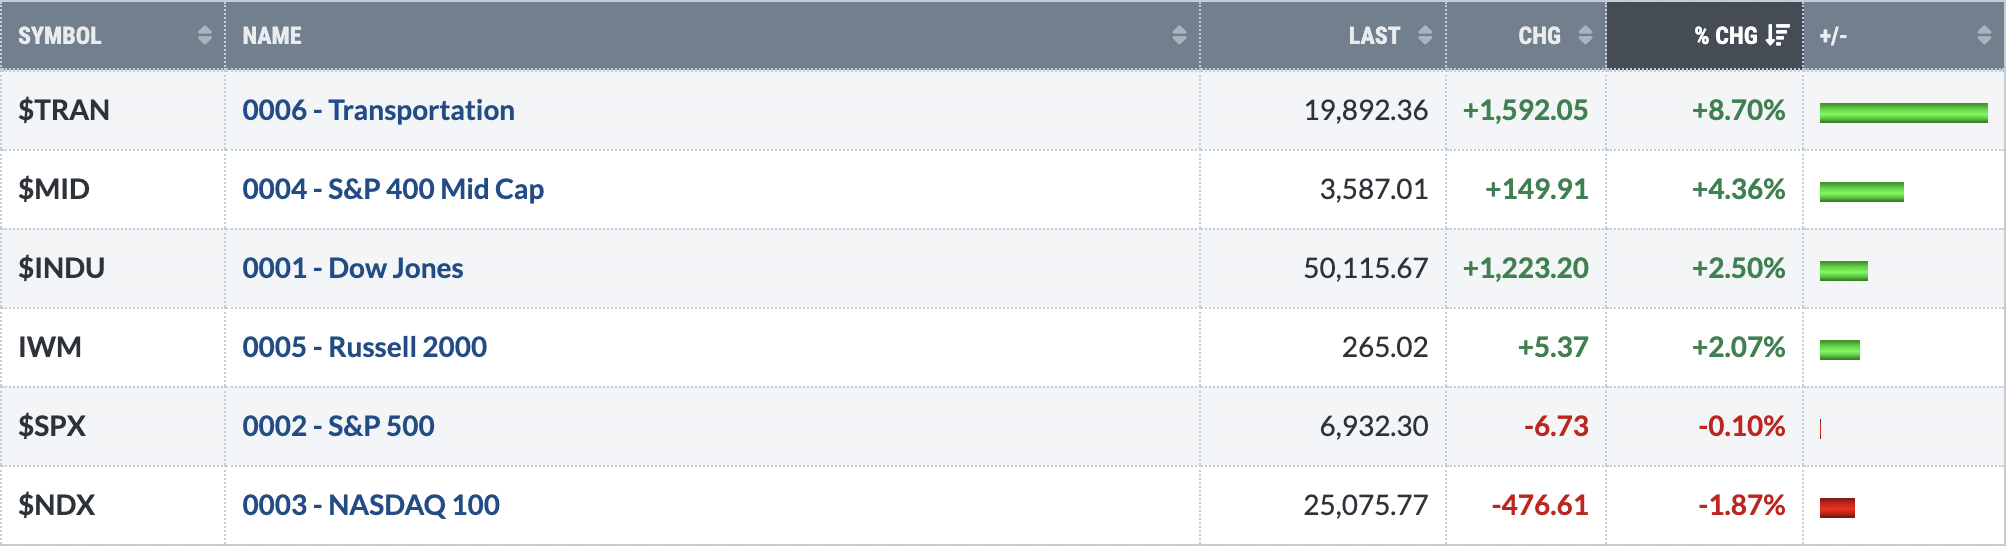
Major Indices
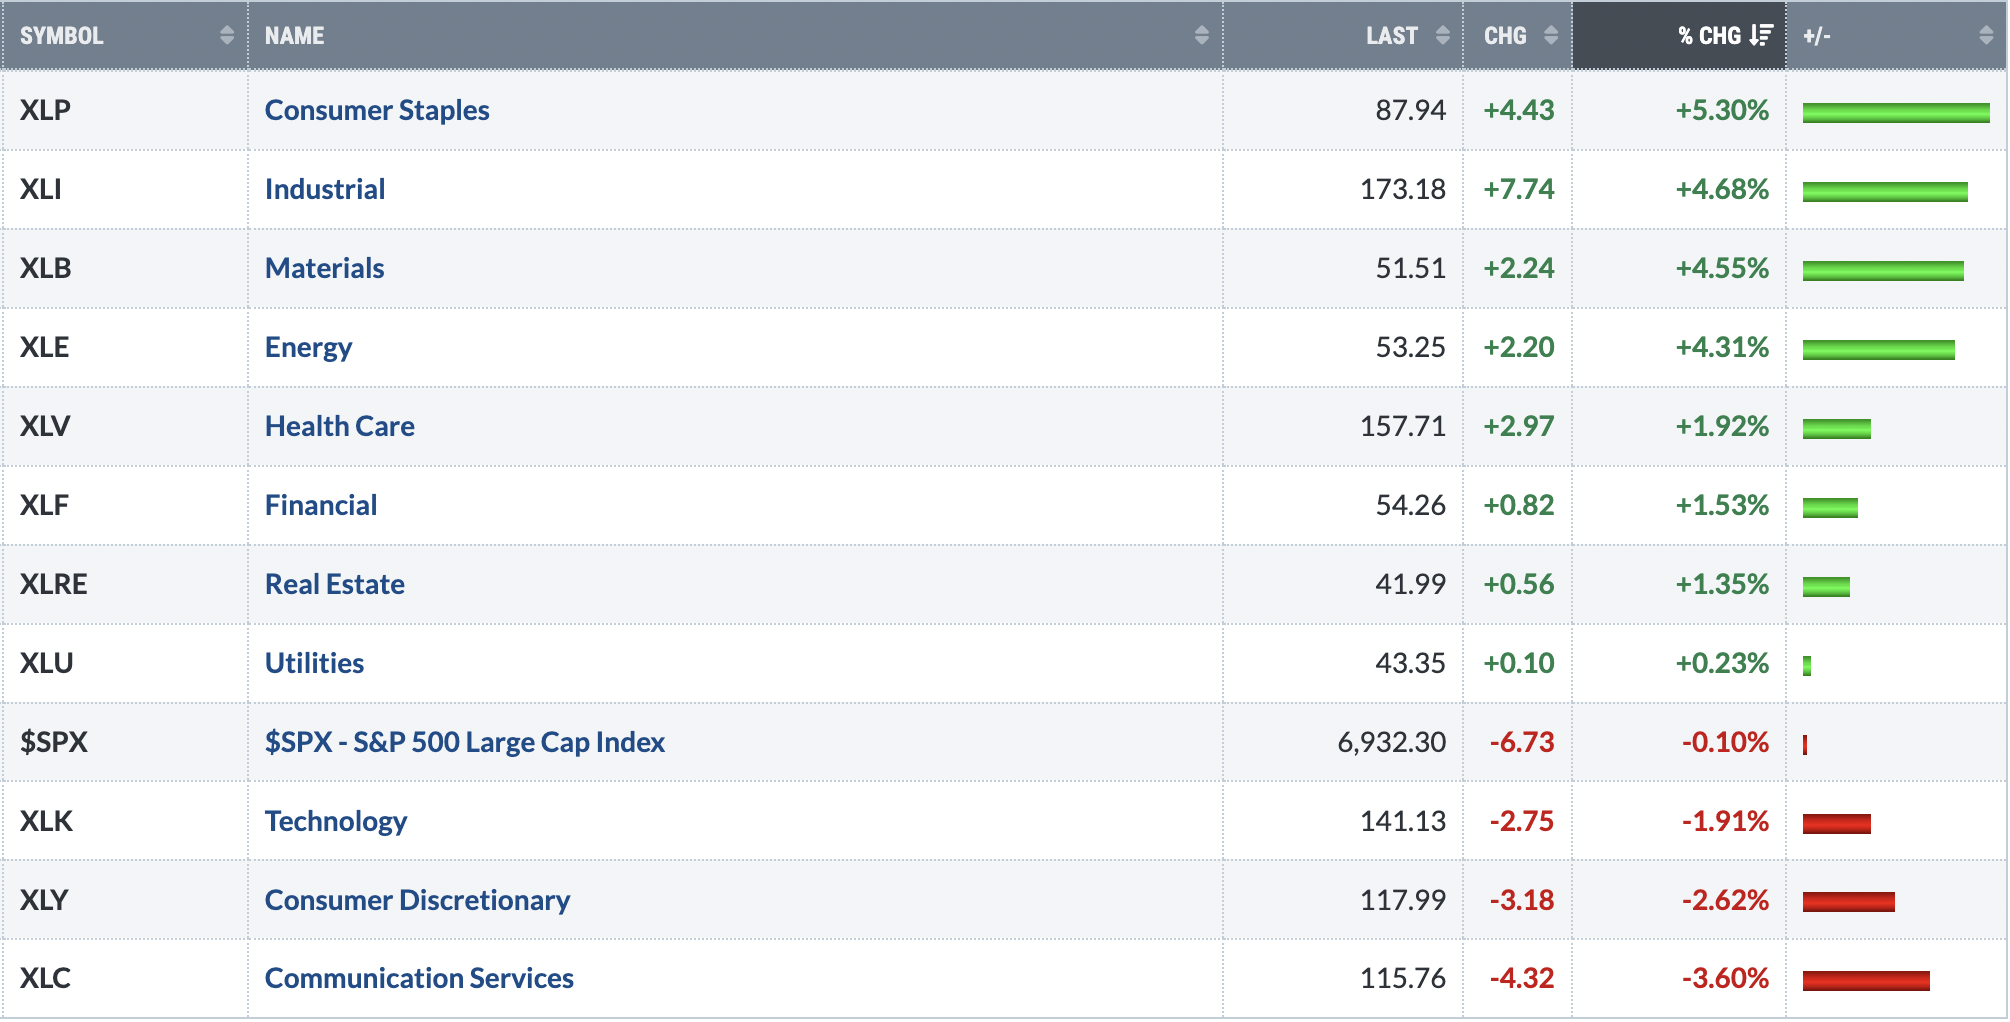
Sectors
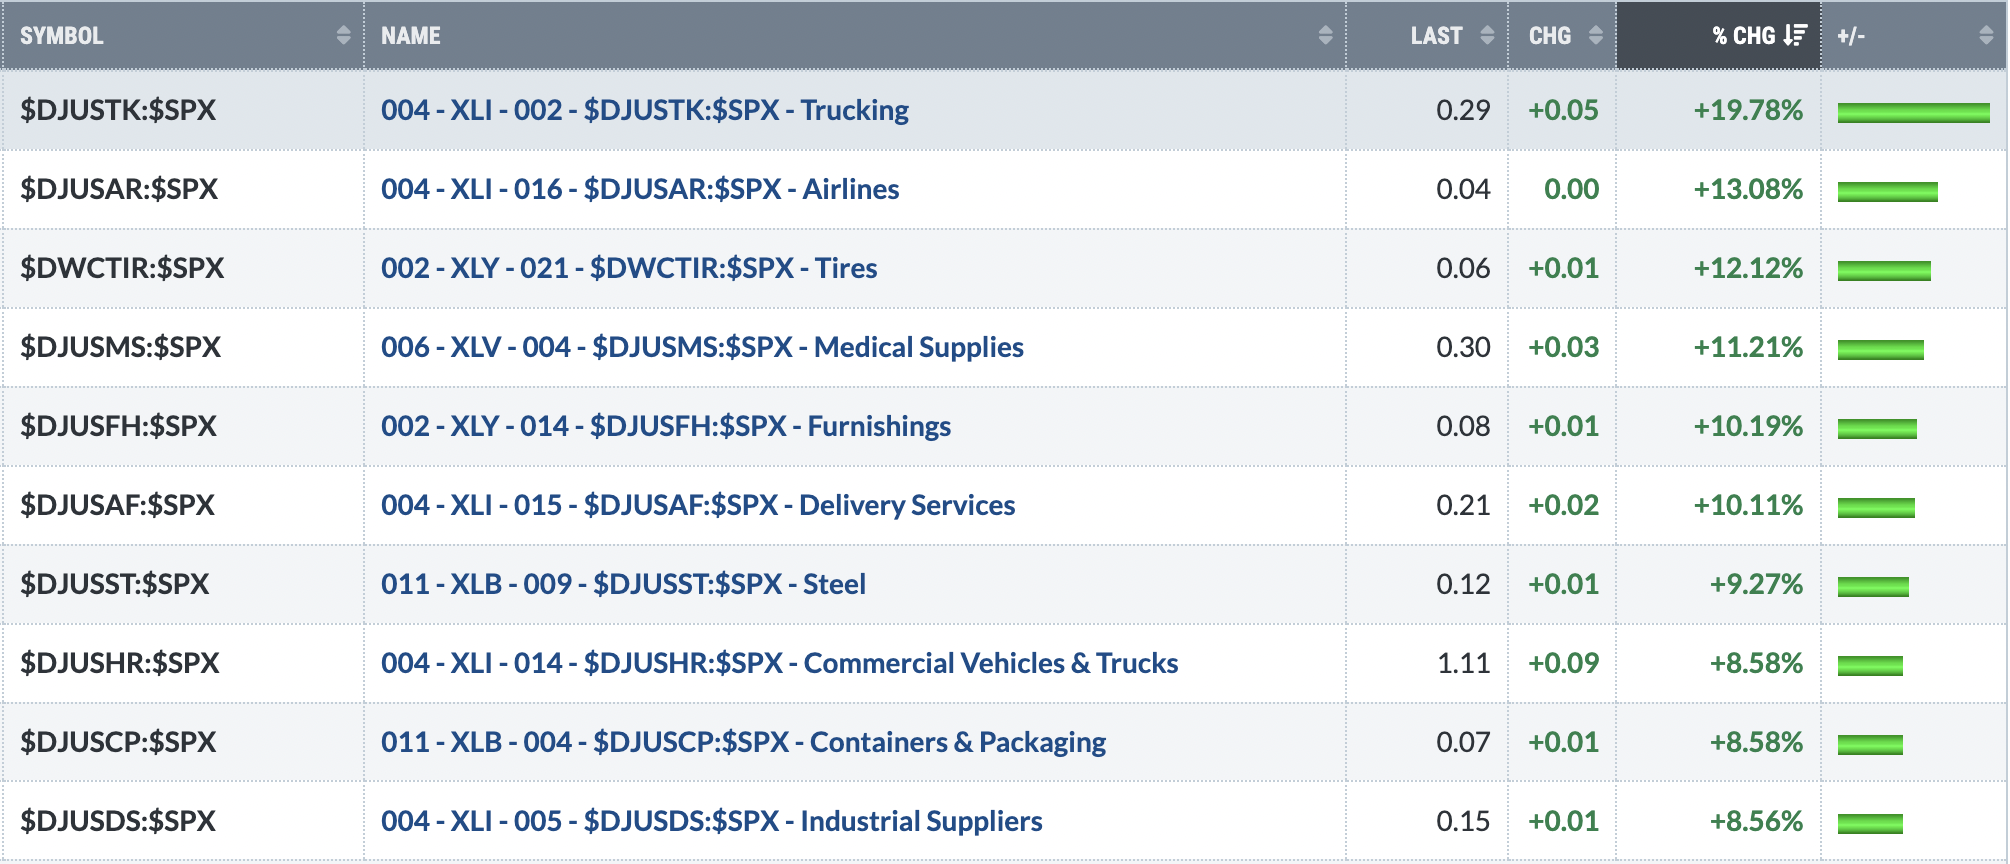
Top 10 Industries Last Week
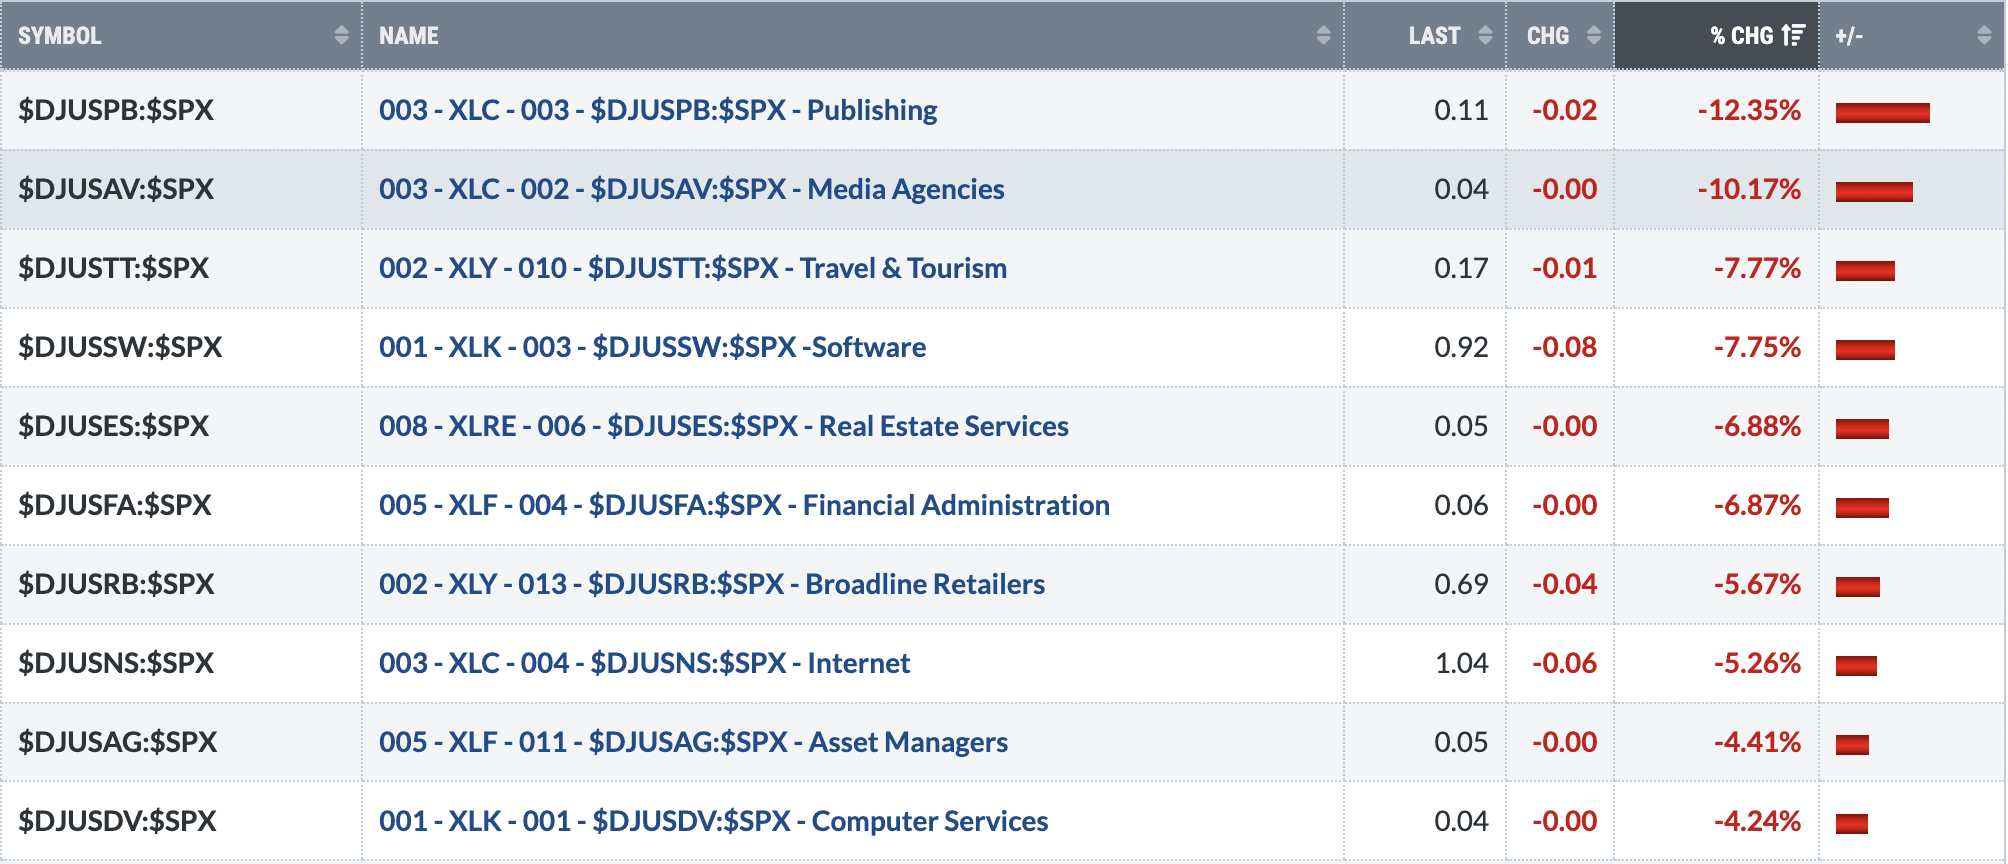
Bottom 10 Industries Last Week
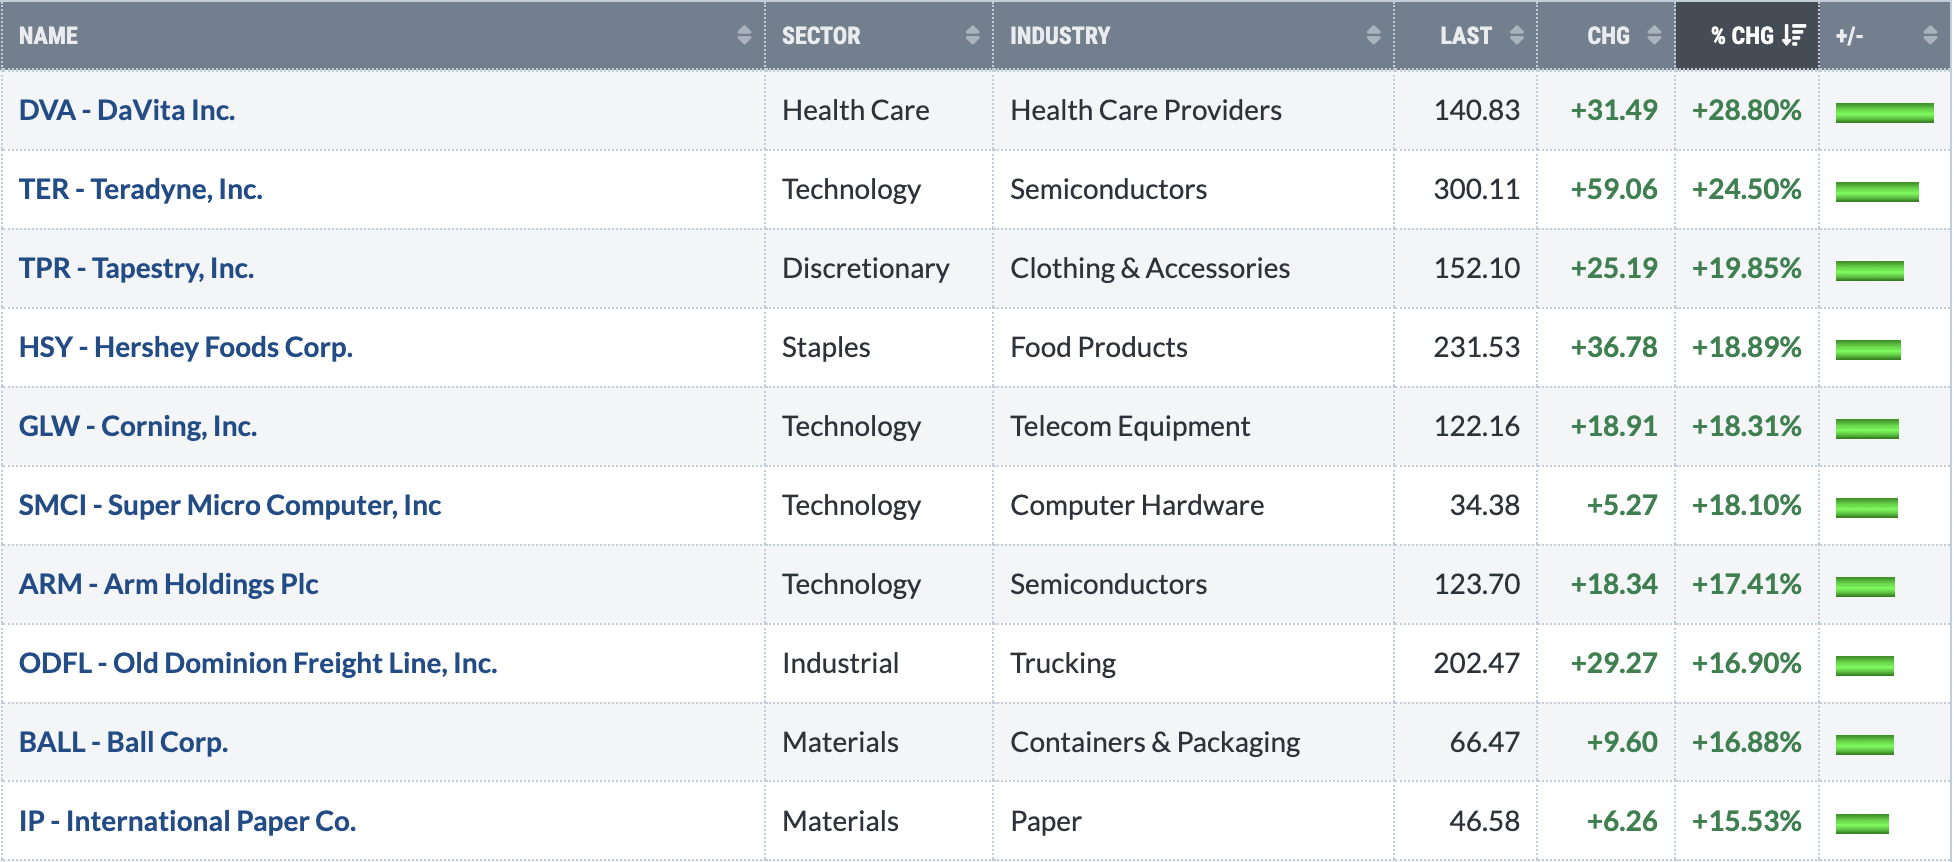
Top 10 Stocks - S&P 500/NASDAQ 100
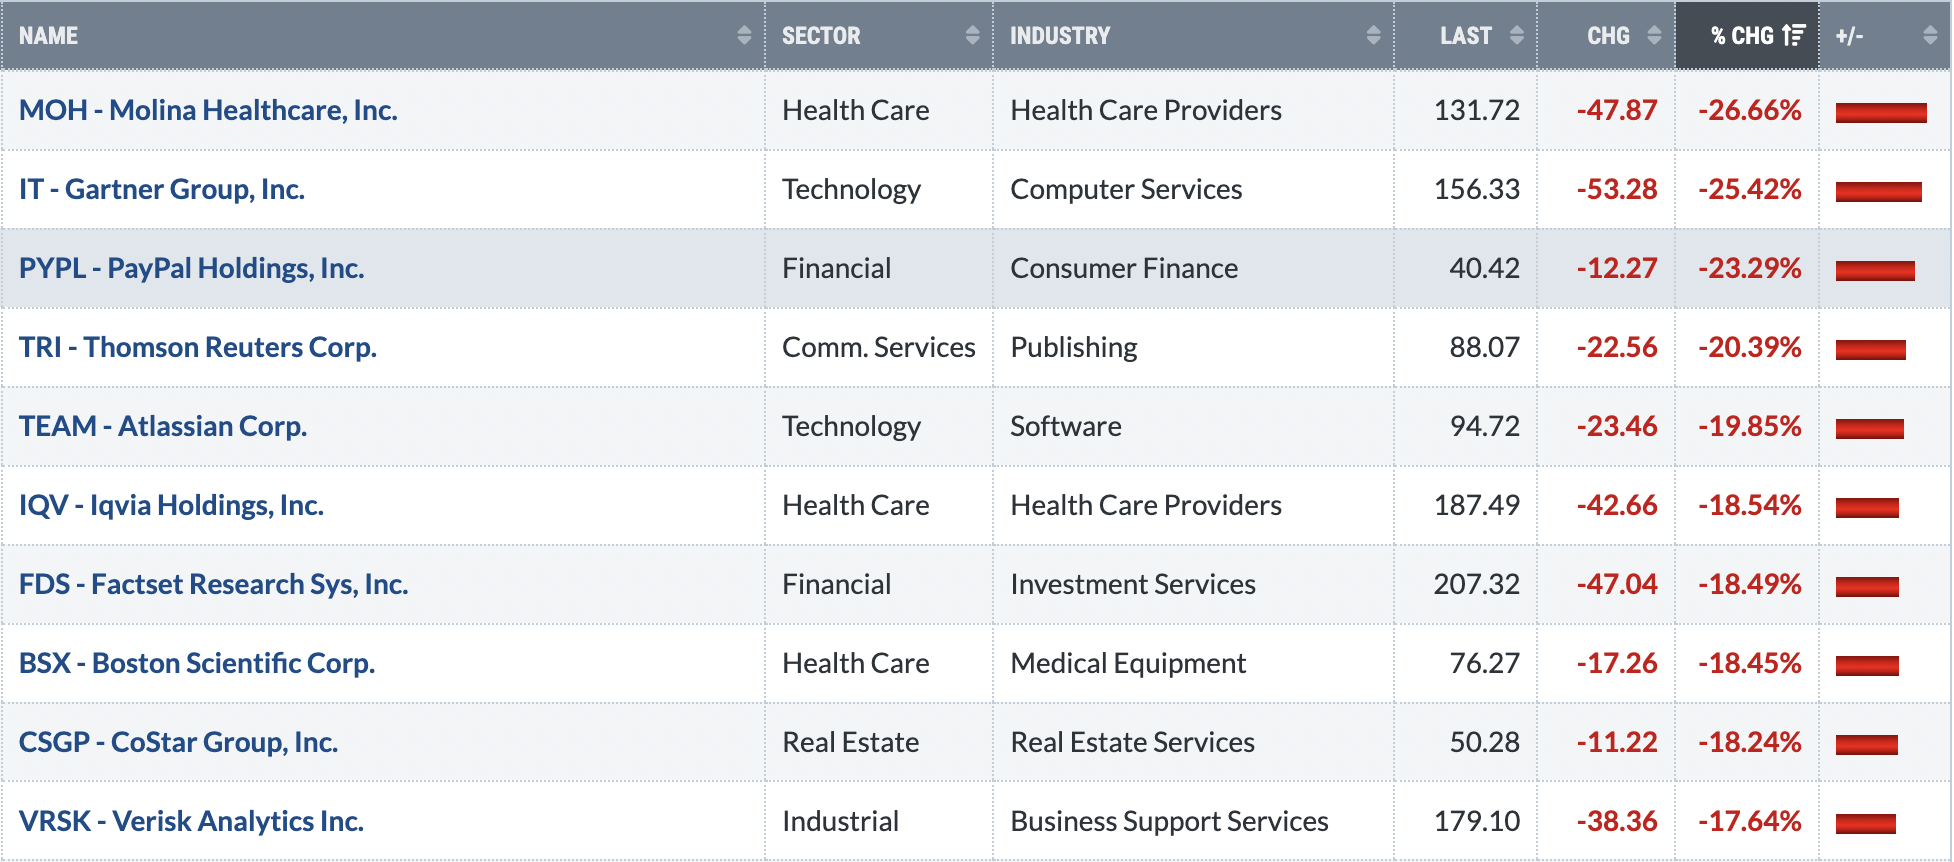
Bottom 10 Stocks - S&P 500/NASDAQ 100
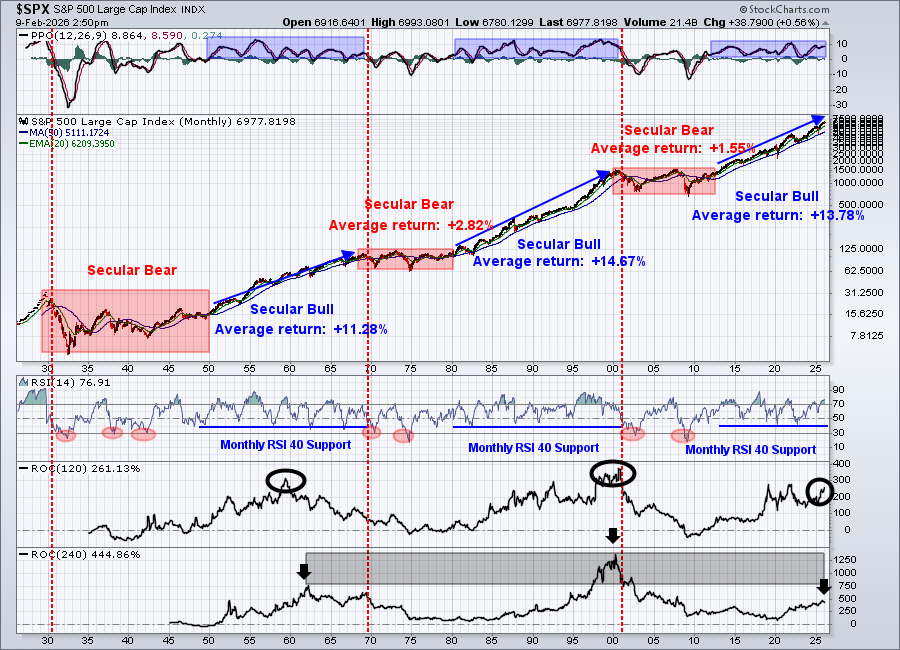
Big Picture
Everything continues to look very bullish to me long-term. Last week, the Dow Jones Industrial Average ($INDU) closed above 50,000 for the first time in its history. The Dow Jones Transportation Average ($TRAN) also closed at an all-time high, confirming the Dow Theory. Charles Dow asserted many, many decades ago that this combination was an indication of a very strong economy and that there was very likely further upside ahead for U.S. stocks. I'm a fan of the Dow Theory. I've shown on many occasions that when the transports are breaking out and rising, that it tends to have very bullish implications for the S&P 500 and broader market.
The relative performance of growth stocks (where much of the market cap lives) has been extremely weak and may limit market upside near-term, but the strength in the transports tells me that a cyclical bear market is very unlikely and even the chance of a correction is dwindling. Technology (XLK) will definitely hold the clue. As long as the XLK remains above the 134-136 range, the chance of a correction is remote. If it drops below, then we can reconsider.
I'm mentioning this, because at MarketVision 2026, I discussed the possibility of a correction in Q1. I'm beginning to back off of that, thinking weakness is more likely to be contained in the 5-7% range. I still do not believe that we're going to go screaming higher and I'm also not changing my year end target for the S&P 500 from 7000. There are still plenty of challenges ahead and I don't expect a significant rally until all growth stocks are clearly back in favor.
Can Value Lead Growth and the S&P 500 Still Move Higher?
I think this is maybe the biggest question that we face right now and one that I have been diligently researching. In my humble opinion, it is NOT ideal for value to lead growth when the stock market is rising and setting new all-time highs. But, at the same time, it would not be unprecedented for this to occur.
We actually began this secular bull market in April 2013 as the S&P 500 cleared its earlier highs from years 2000 and 2007. During the first few months of this breakout, value crushed growth and technology lagged badly. Check this out:
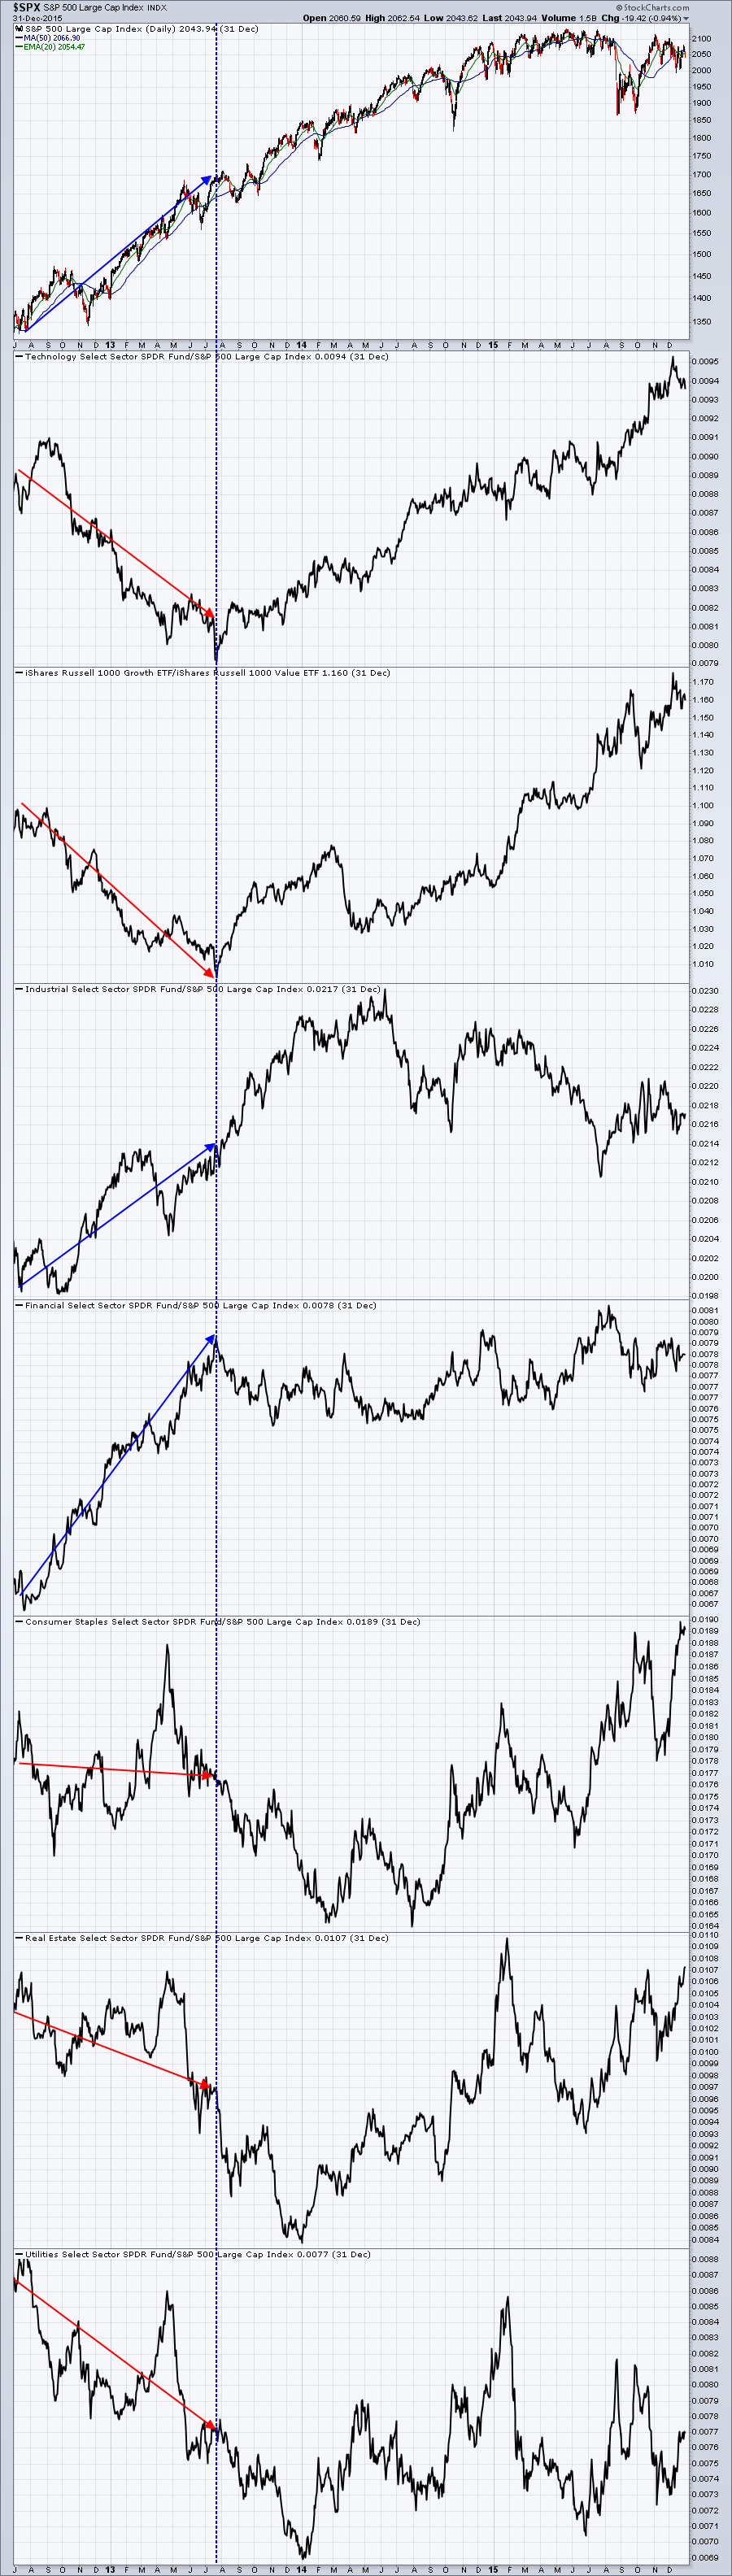
I think the important takeaway here is that money rotated into the "aggressive value" areas like industrials (XLI) and financials (XLF). We were NOT led by the "defensive value" areas like consumer staples (XLP), real estate (XLRE), and utilities (XLU). Those latter 3 sectors actually underperformed while technology was lagging. But it was the strength in industrials and financials that held up the market.
Now let's fast forward to the 2022 cyclical bear market and how that top formed:
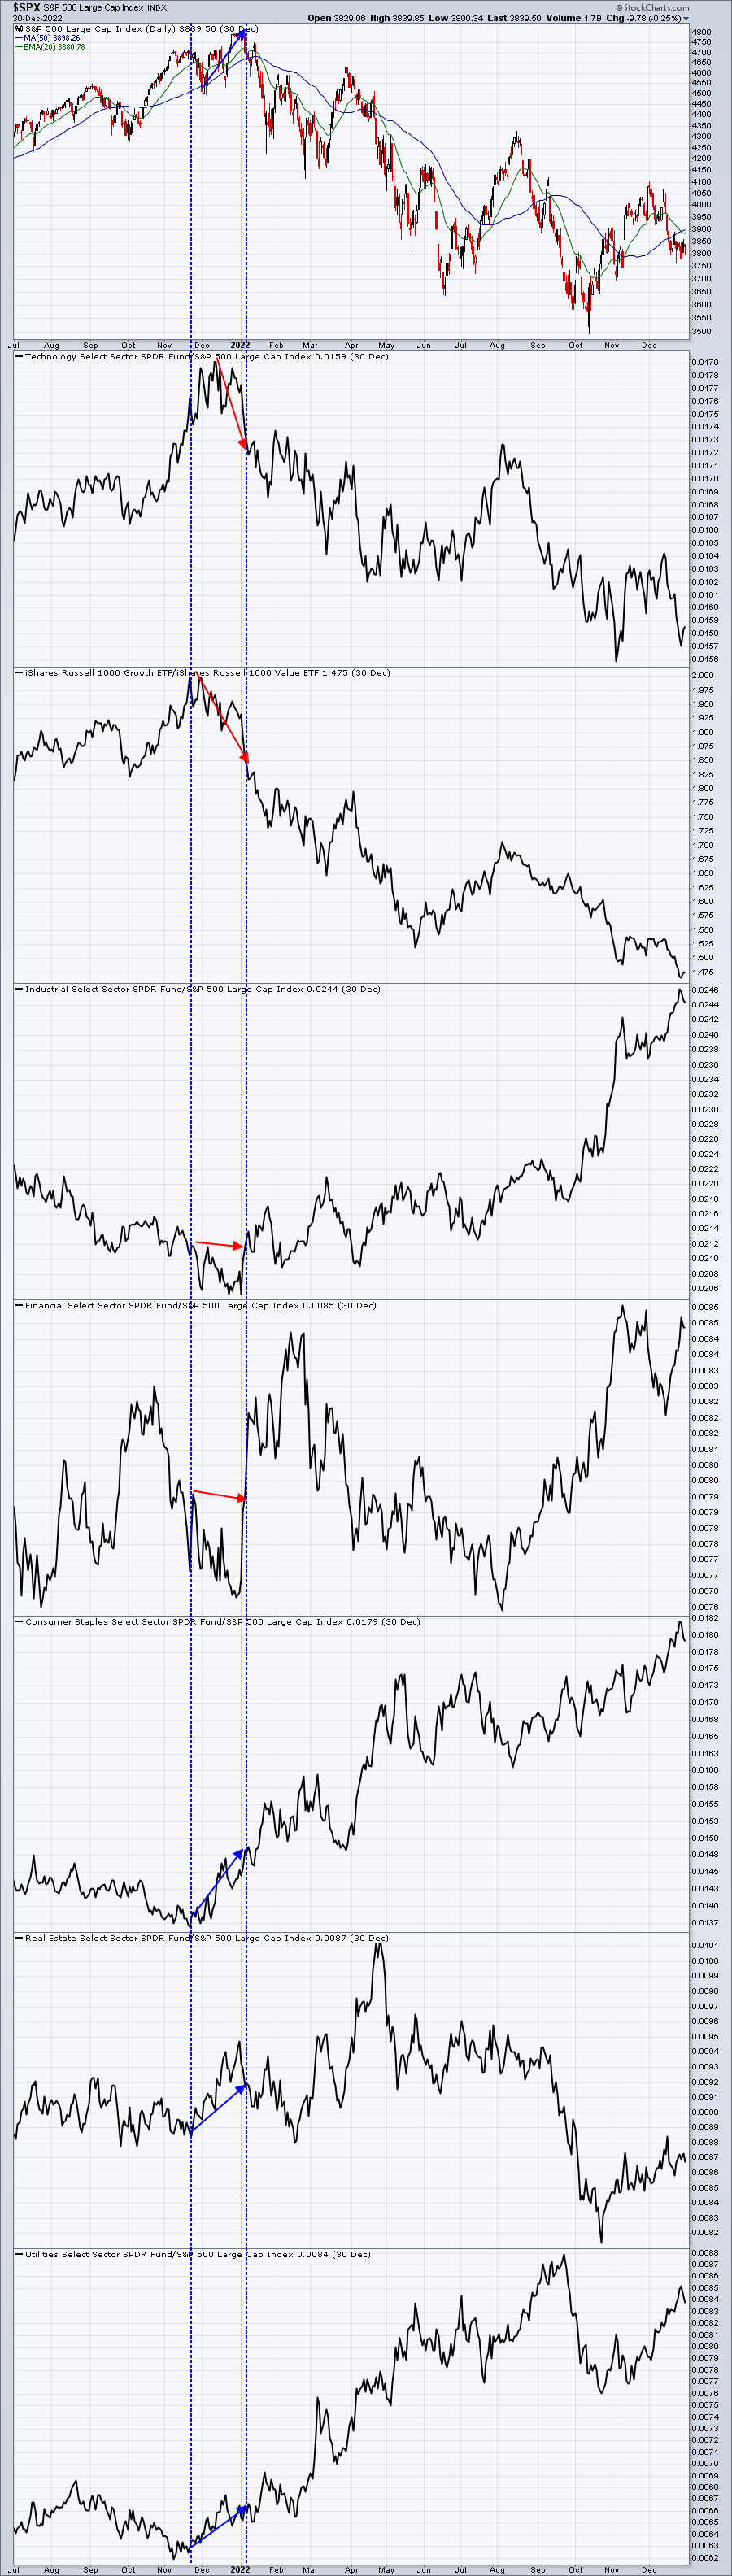
The S&P 500's last-ditch effort to move higher in early-January 2022 was accompanied by relative strength in the "defensive value" areas, unlike what we saw in 2013.
And then this is what this same chart looked like in 2025 as the final top printed in mid-February:
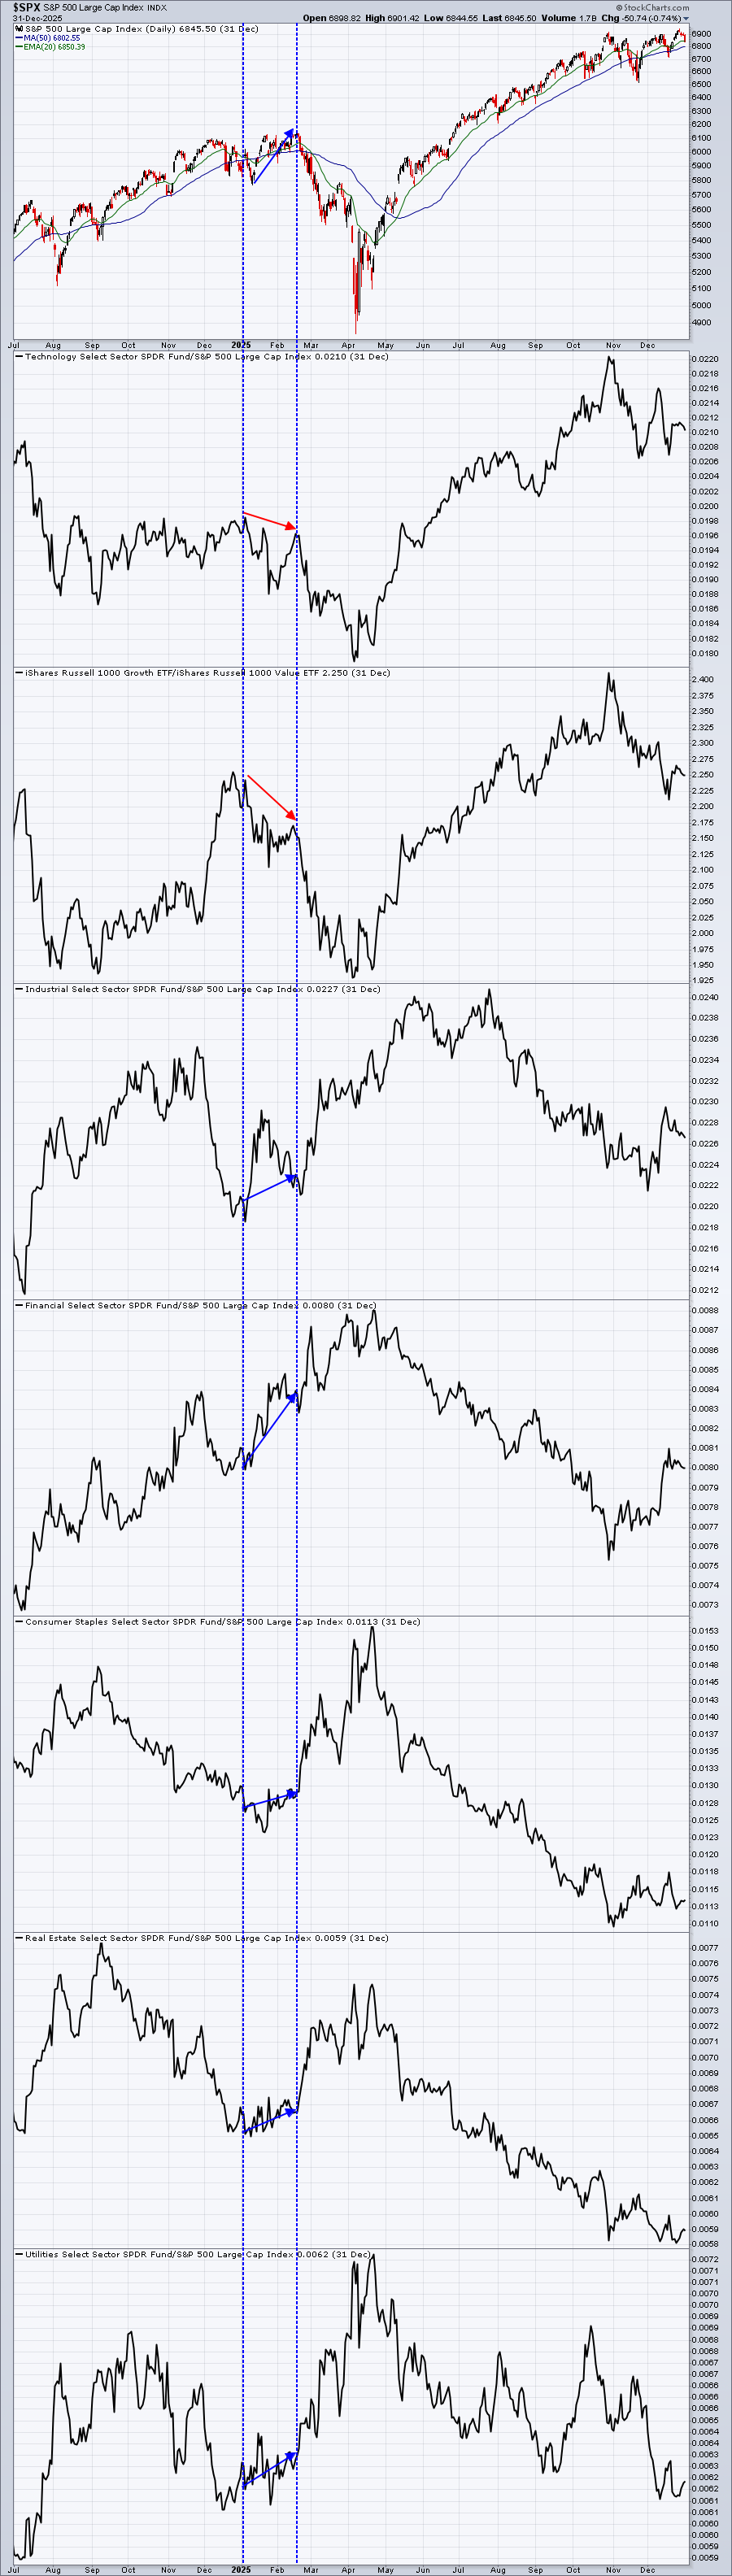
During both of the cyclical bear markets in 2022 and 2025, the defensive sectors (XLP, XLRE, and XLU) showed relative strength during the final bull phase, just before the market topped. Back in 2013, when the weakness in technology and growth stocks did NOT suggest a big decline ahead, money rotated more heavily into the XLI and XLF. The defensive sectors were not coveted by Wall Street.
So that leads us to today. Technology is faltering. Growth has lagged value massively and the S&P 500 is near an all-time high, just like the 3 examples above. Which scenario exists right now? Well, let's look at the chart:
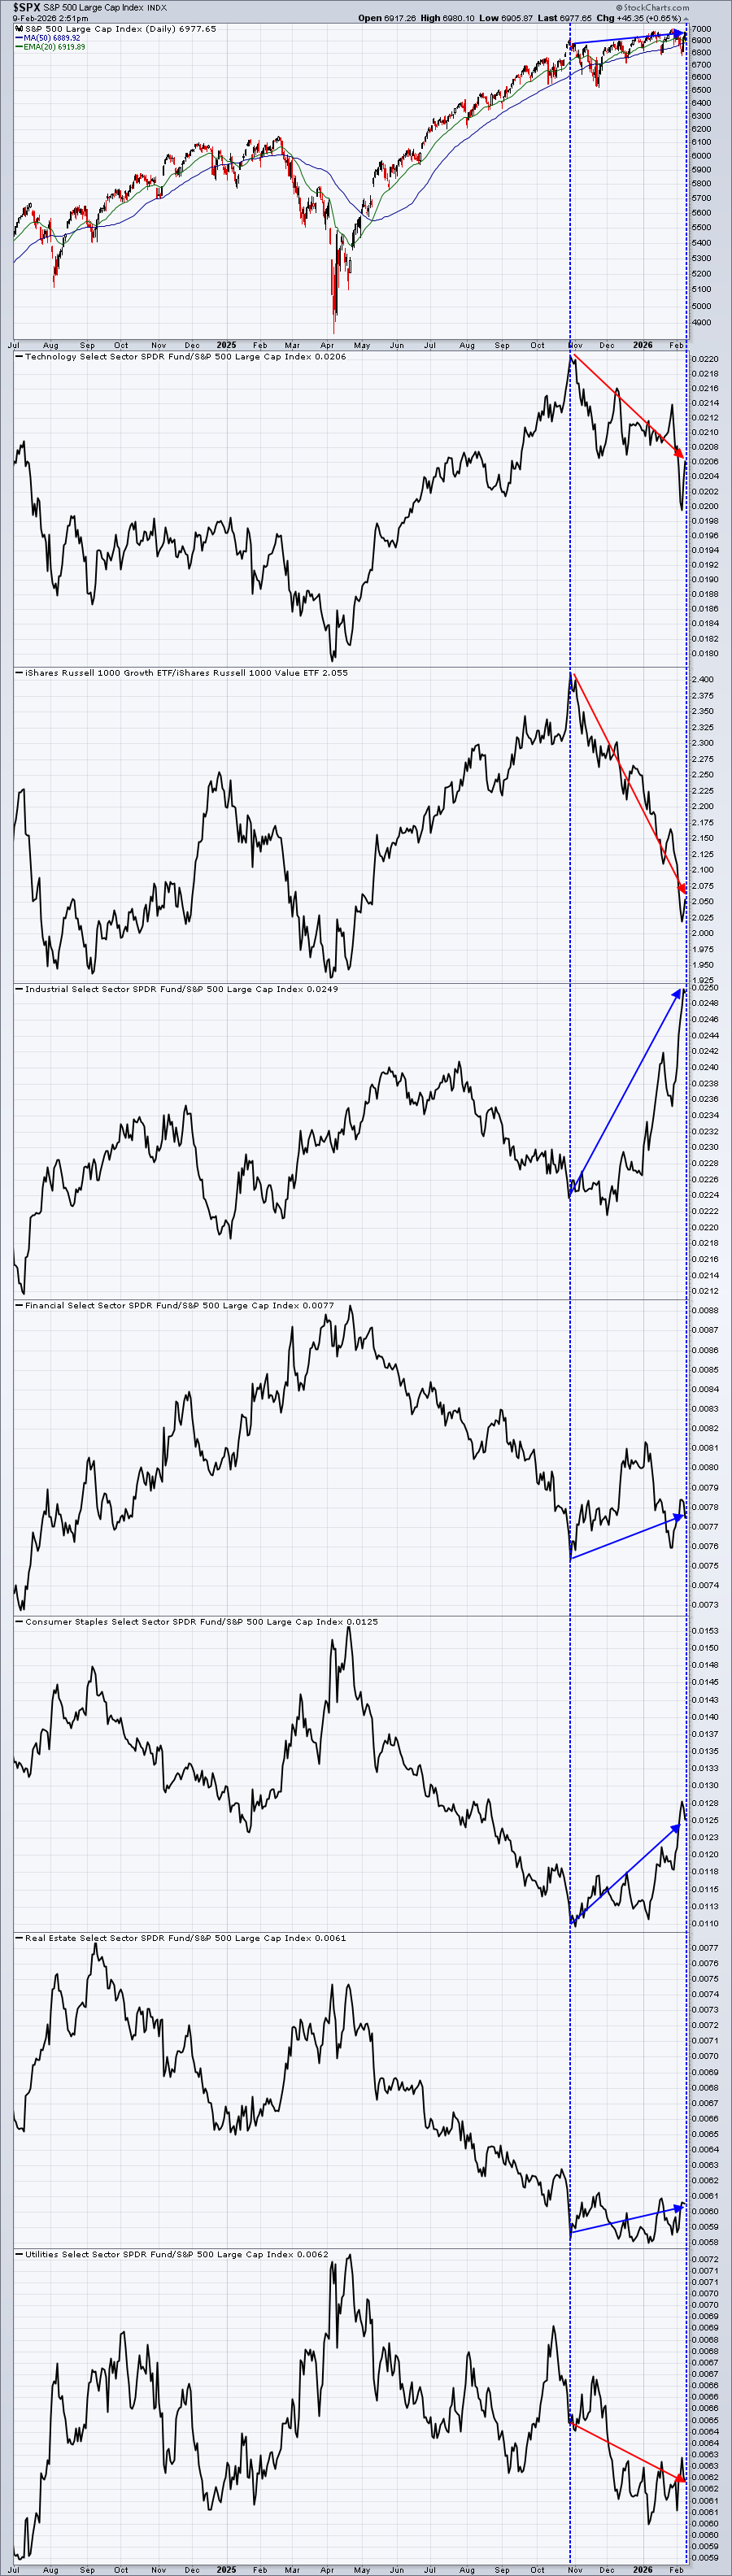
Quite honestly, I see a bit of a mixed bag. Industrials are behaving quite bullish, just like they did in 2013 to help offset the weakness in technology. Financials showed strength in Q4, but has backed off in 2026. Meanwhile, the purely defensive sectors didn't do much until 2026, but now staples (XLP) are seeing considerable strength, both absolute and relative.
Everyone can interpret these charts differently, I suppose, but I believe 2026 is setting up more like 2013. Back in 2013, the S&P 500 continued pushing higher and higher, finishing off 2013 in very bullish style. There's one important thing to note, however. Technology (XLK) roared back and led during the second half of 2013 in order to carry the S&P 500. That is EXACTLY what we'll need in 2026 in order to see a 10% gain or more. I'm just not so sure we're going to see that, given all of the other warning signs. Remember, calling the market is about putting together ALL of the puzzle pieces to see what story Wall Street is telling.
I believe that money rotating into the XLI and XLF, and not so much into the defensive value areas like the XLP, XLRE, and XLU, will help to hold the market up. Because of the breakout in transports (part of the industrials), I now believe the chance of a cyclical bear market (S&P 500 dropping more than 20%) is very unlikely. A correction is still possible (S&P 500 dropping more than 10%), though I'm not as convinced now that we'll see one. Instead, I see a very choppy 2026 ahead. It'll likely be very frustrating as money rotates back and forth.
I believe technology definitely holds the key. Watch price support on the XLK from 234-236. We've bounced beautifully off of that for now, but if we move back down and fail the next time, I would want to re-evaluate all of my signals.
Sustainability Ratios
Here's the latest look at our key intraday ratios as we follow where the money is traveling on an INTRADAY basis (ignoring gaps):
QQQ:SPY
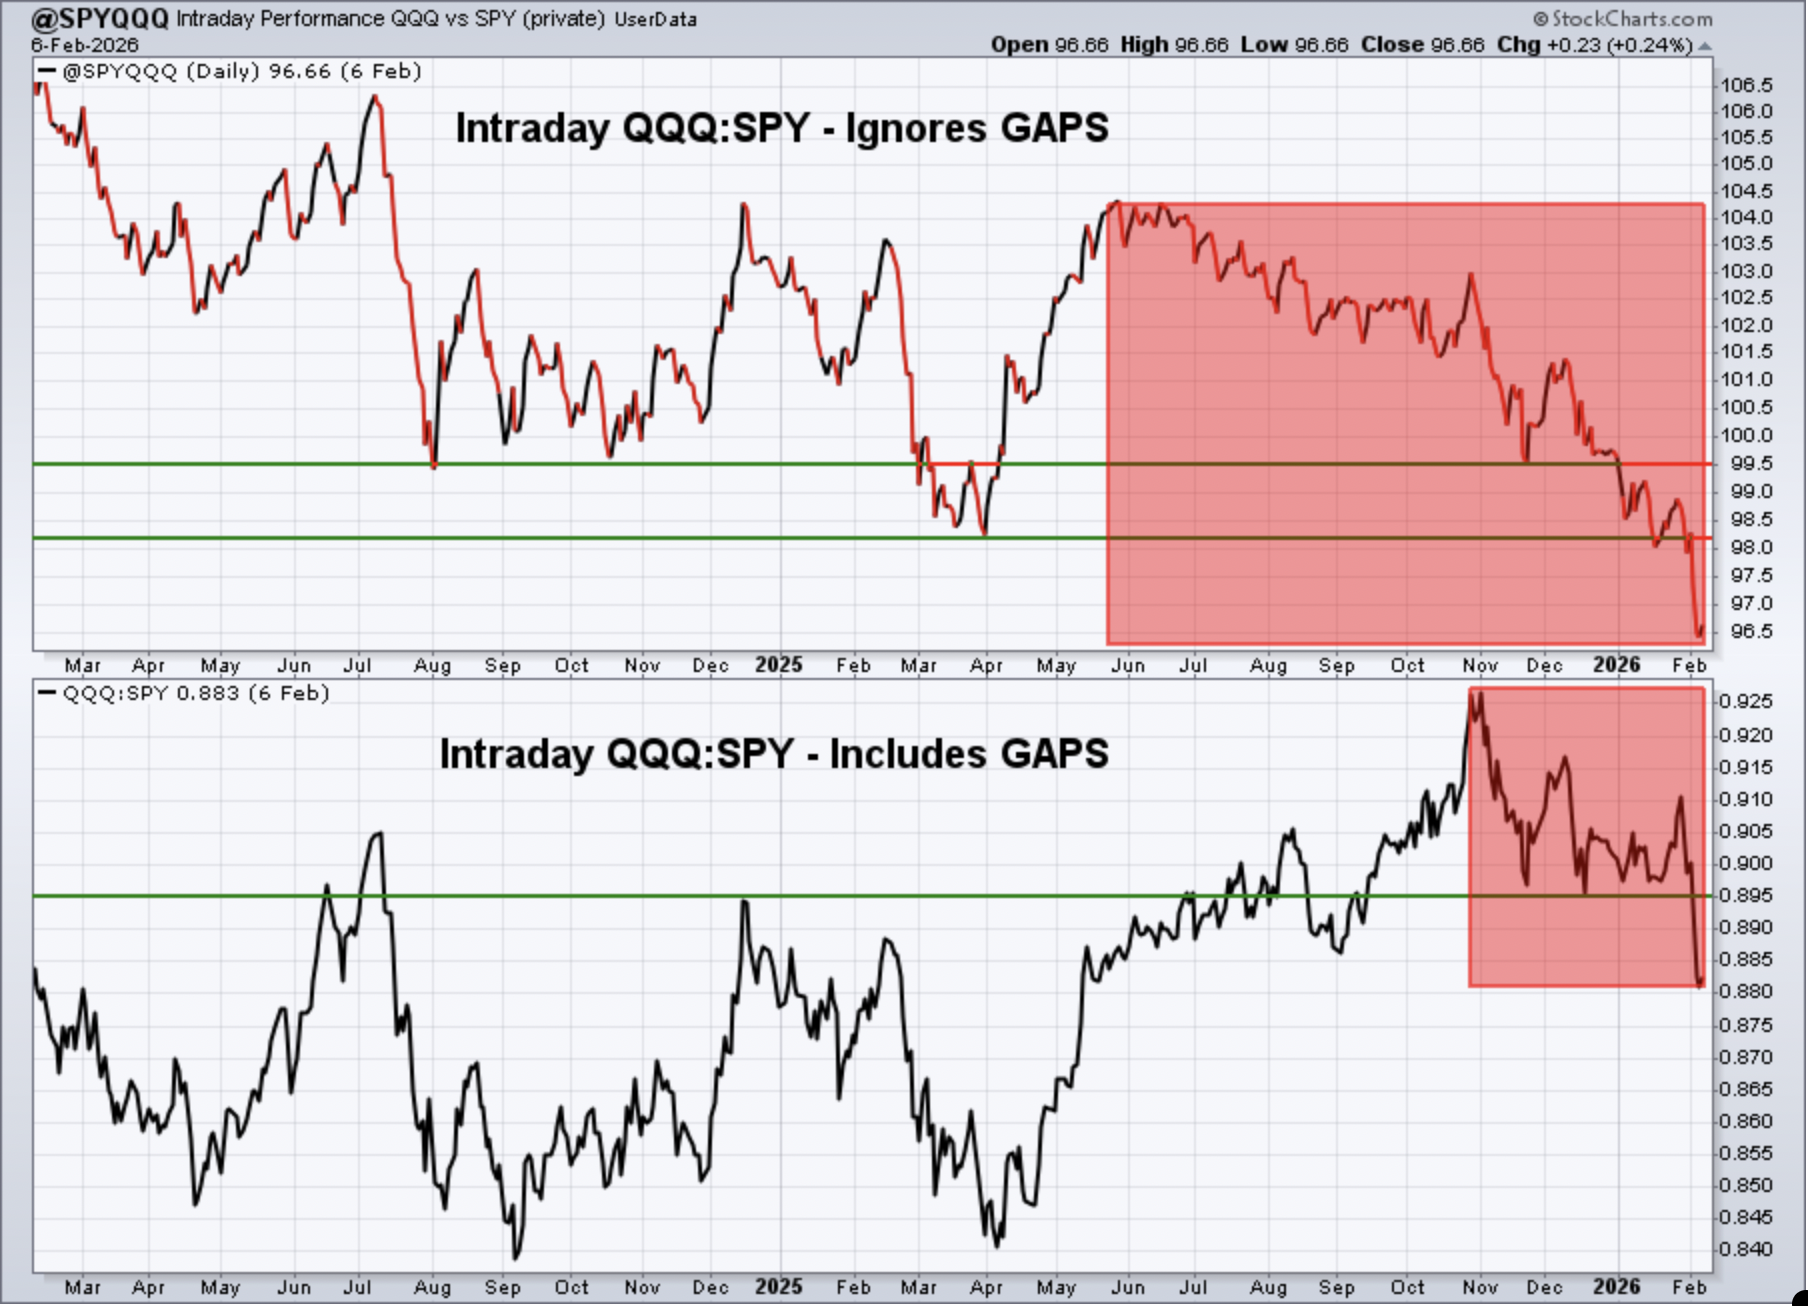
Keep in mind that the intraday analysis provided is a "work in progress". I continue to analyze this data to see if it helps provide us clues about calling market direction. It makes common sense to me that it should help in some sense, but it'll require a much longer-term study to determine its worth.
It was another rough week for this intermarket relationship. We did see a slight tick back up on Friday, but we're going to need to see a lot more relative strength in the QQQ before growing excited about the prospects of U.S. stocks.
IWM:QQQ
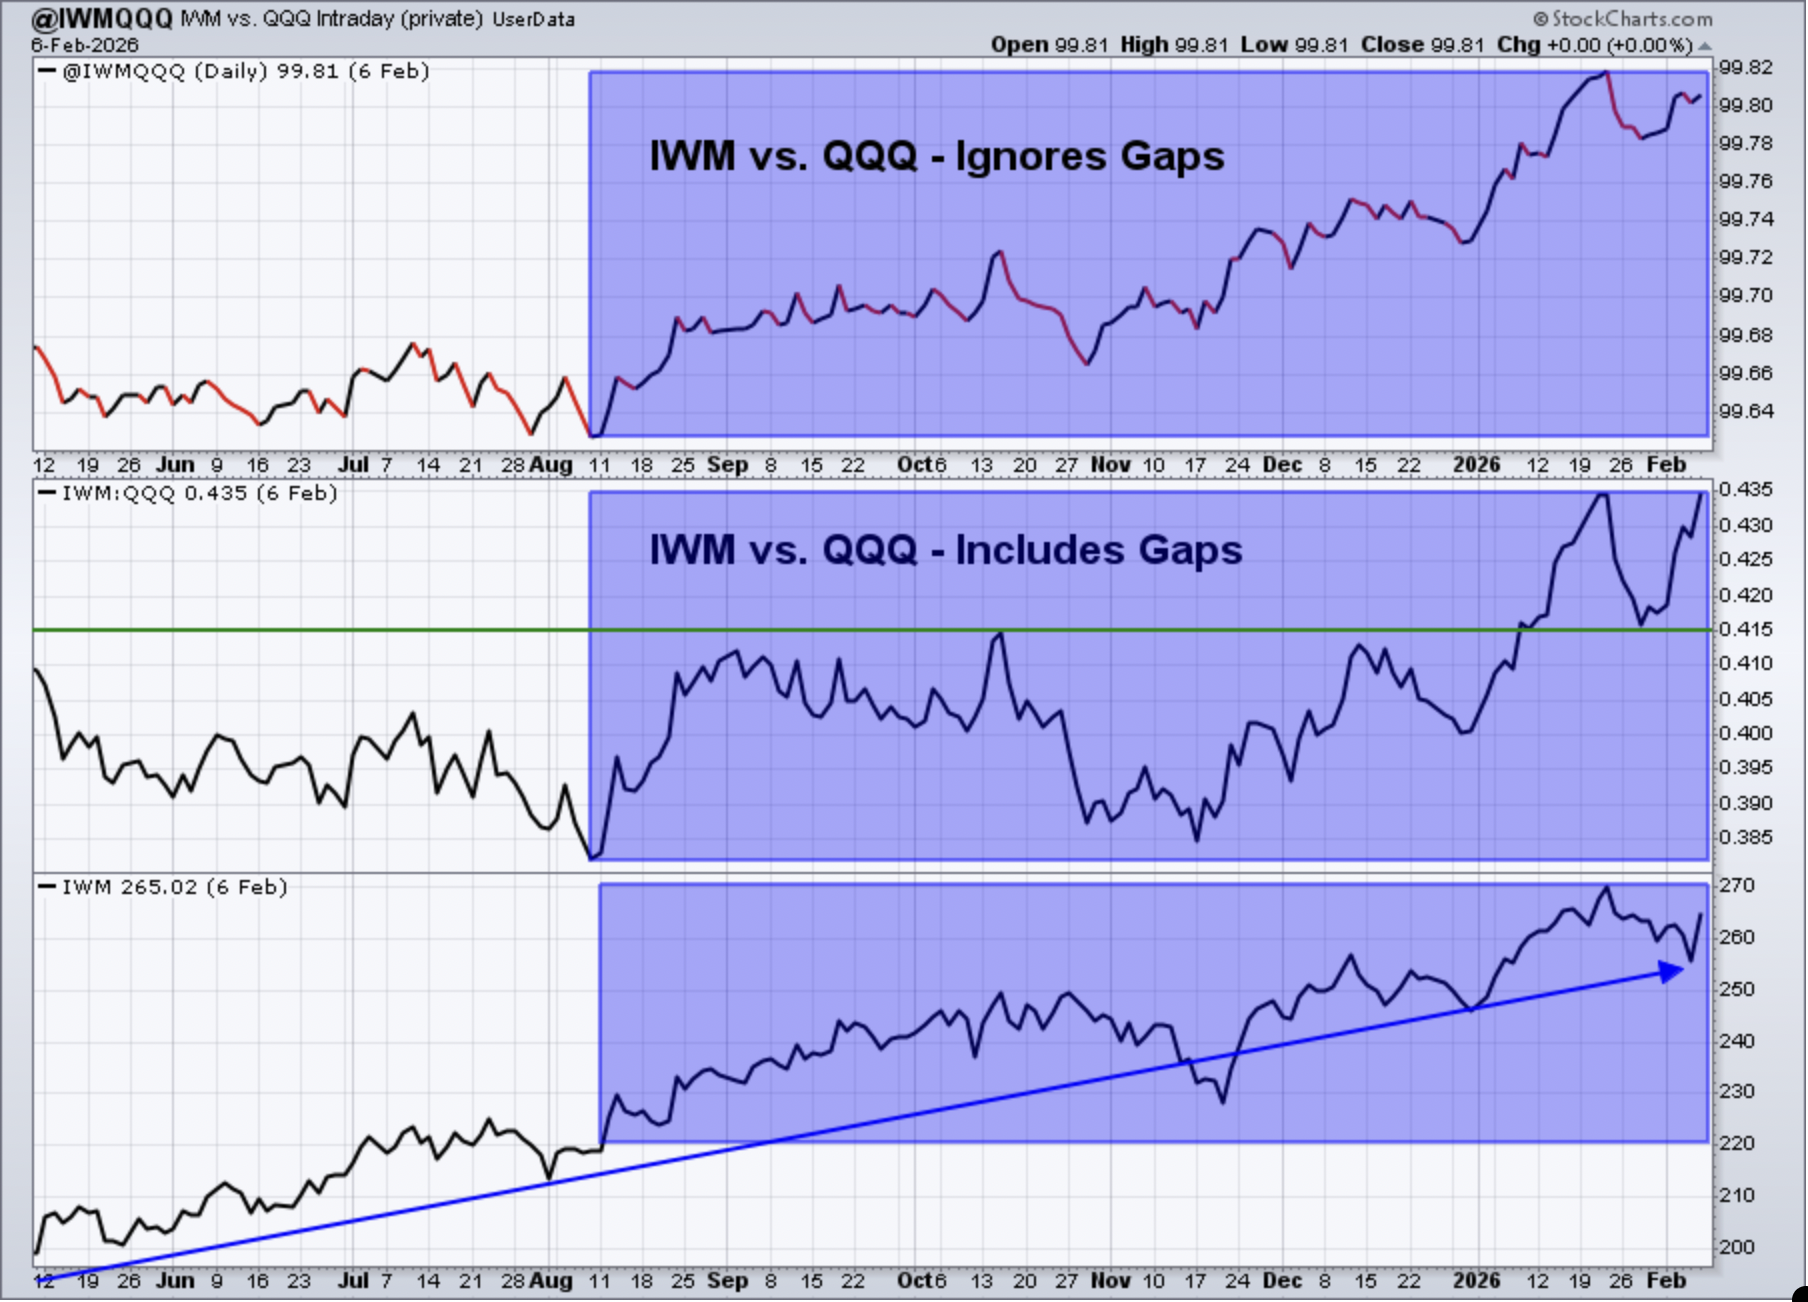
Small caps had another very solid week among asset classes. The IWM bounced off 50-day SMA support last week, just as it had at the end of December. The relative intraday performance of the IWM suggests that money continues to rotate into this area of the market.
XLY:XLP
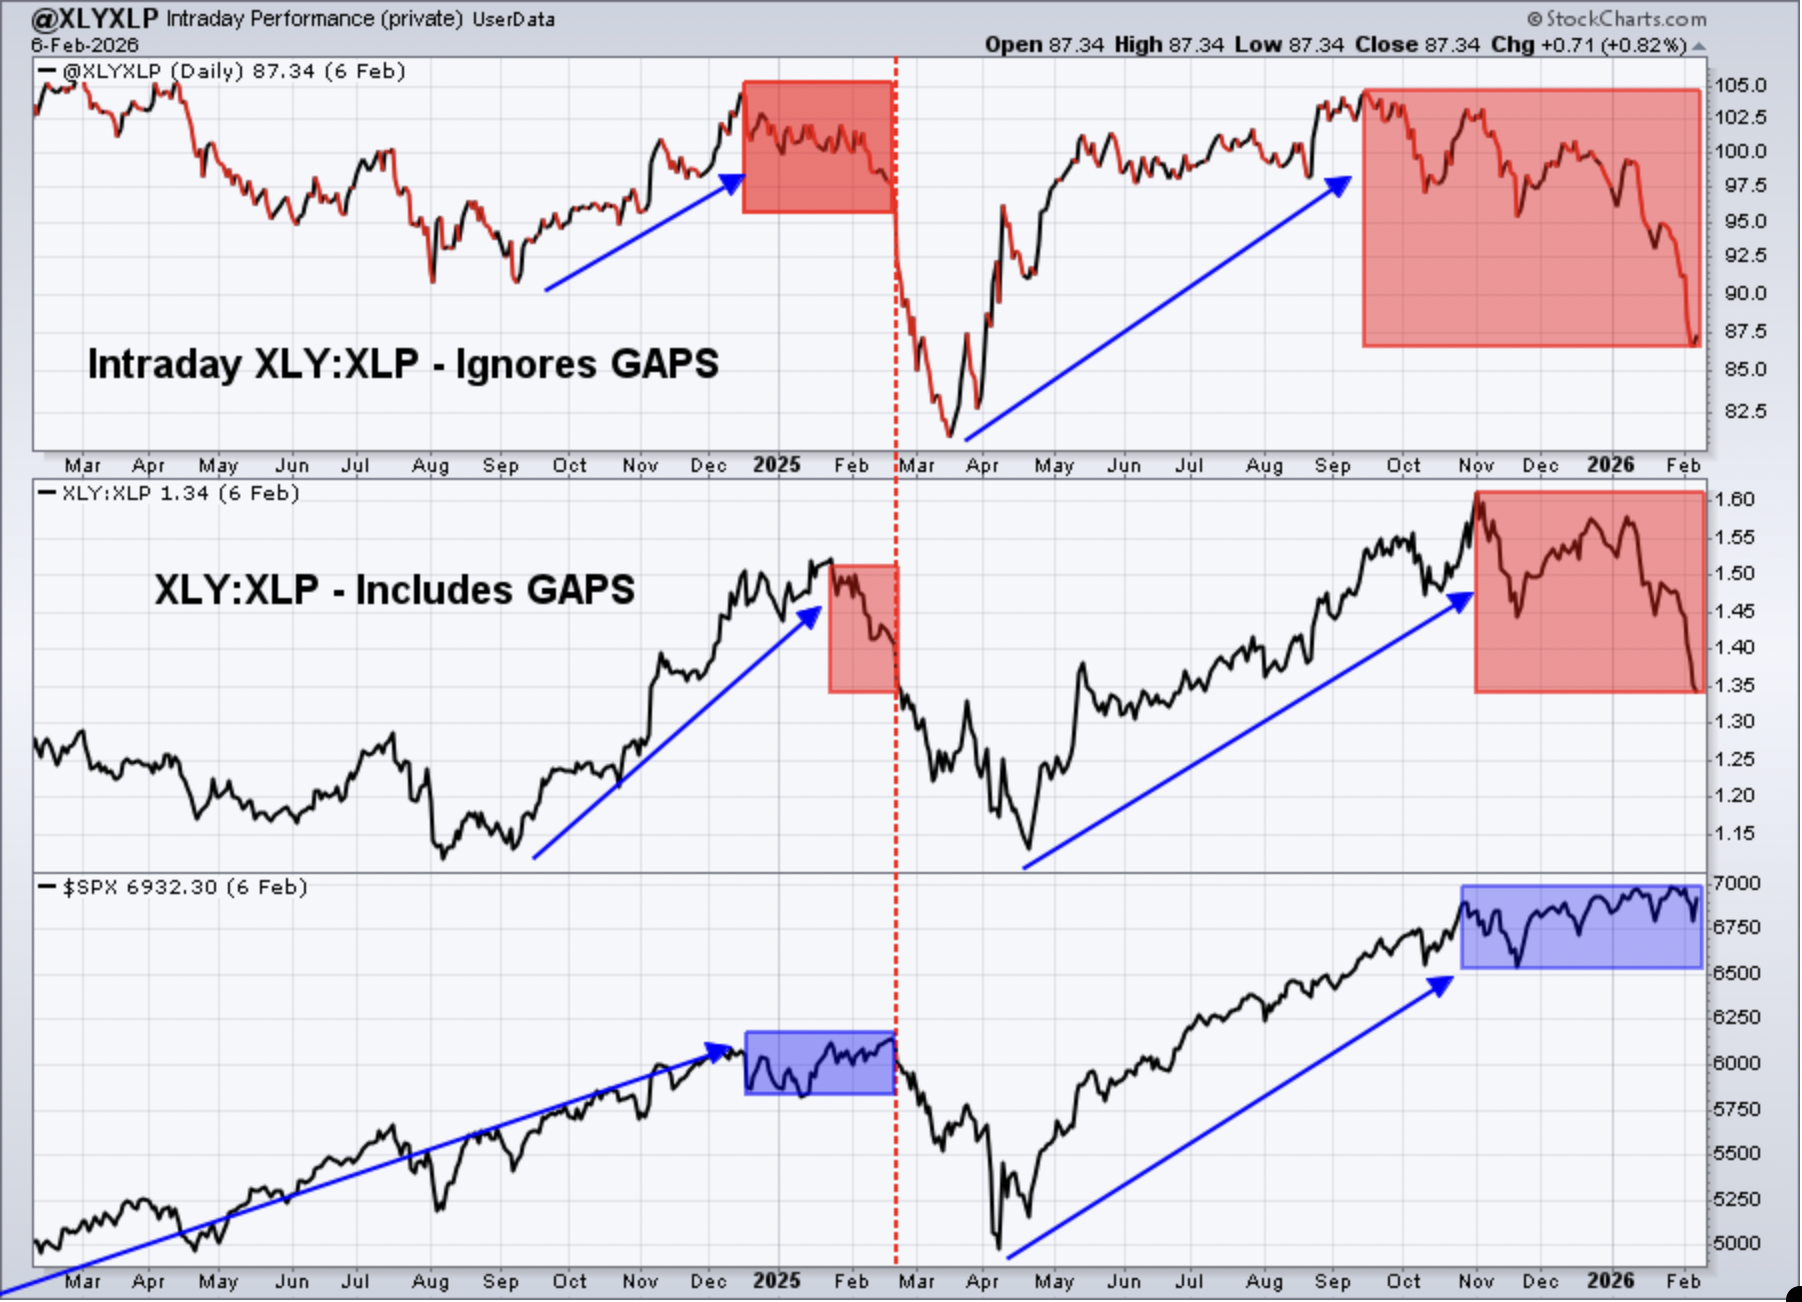
This is one of my favorite intermarket relationships as it tells us a story about Wall Street's interpretation of the health of the consumer. If Wall Street is choosing discretionary stocks over staples stocks, that's a bullish signal. But when the opposite is occurring, like now, it's a warning sign. I review a lot of signals, but I have to admit that, right now, this remains one of the most bearish.
Sentiment
5-day SMA ($CPCE)
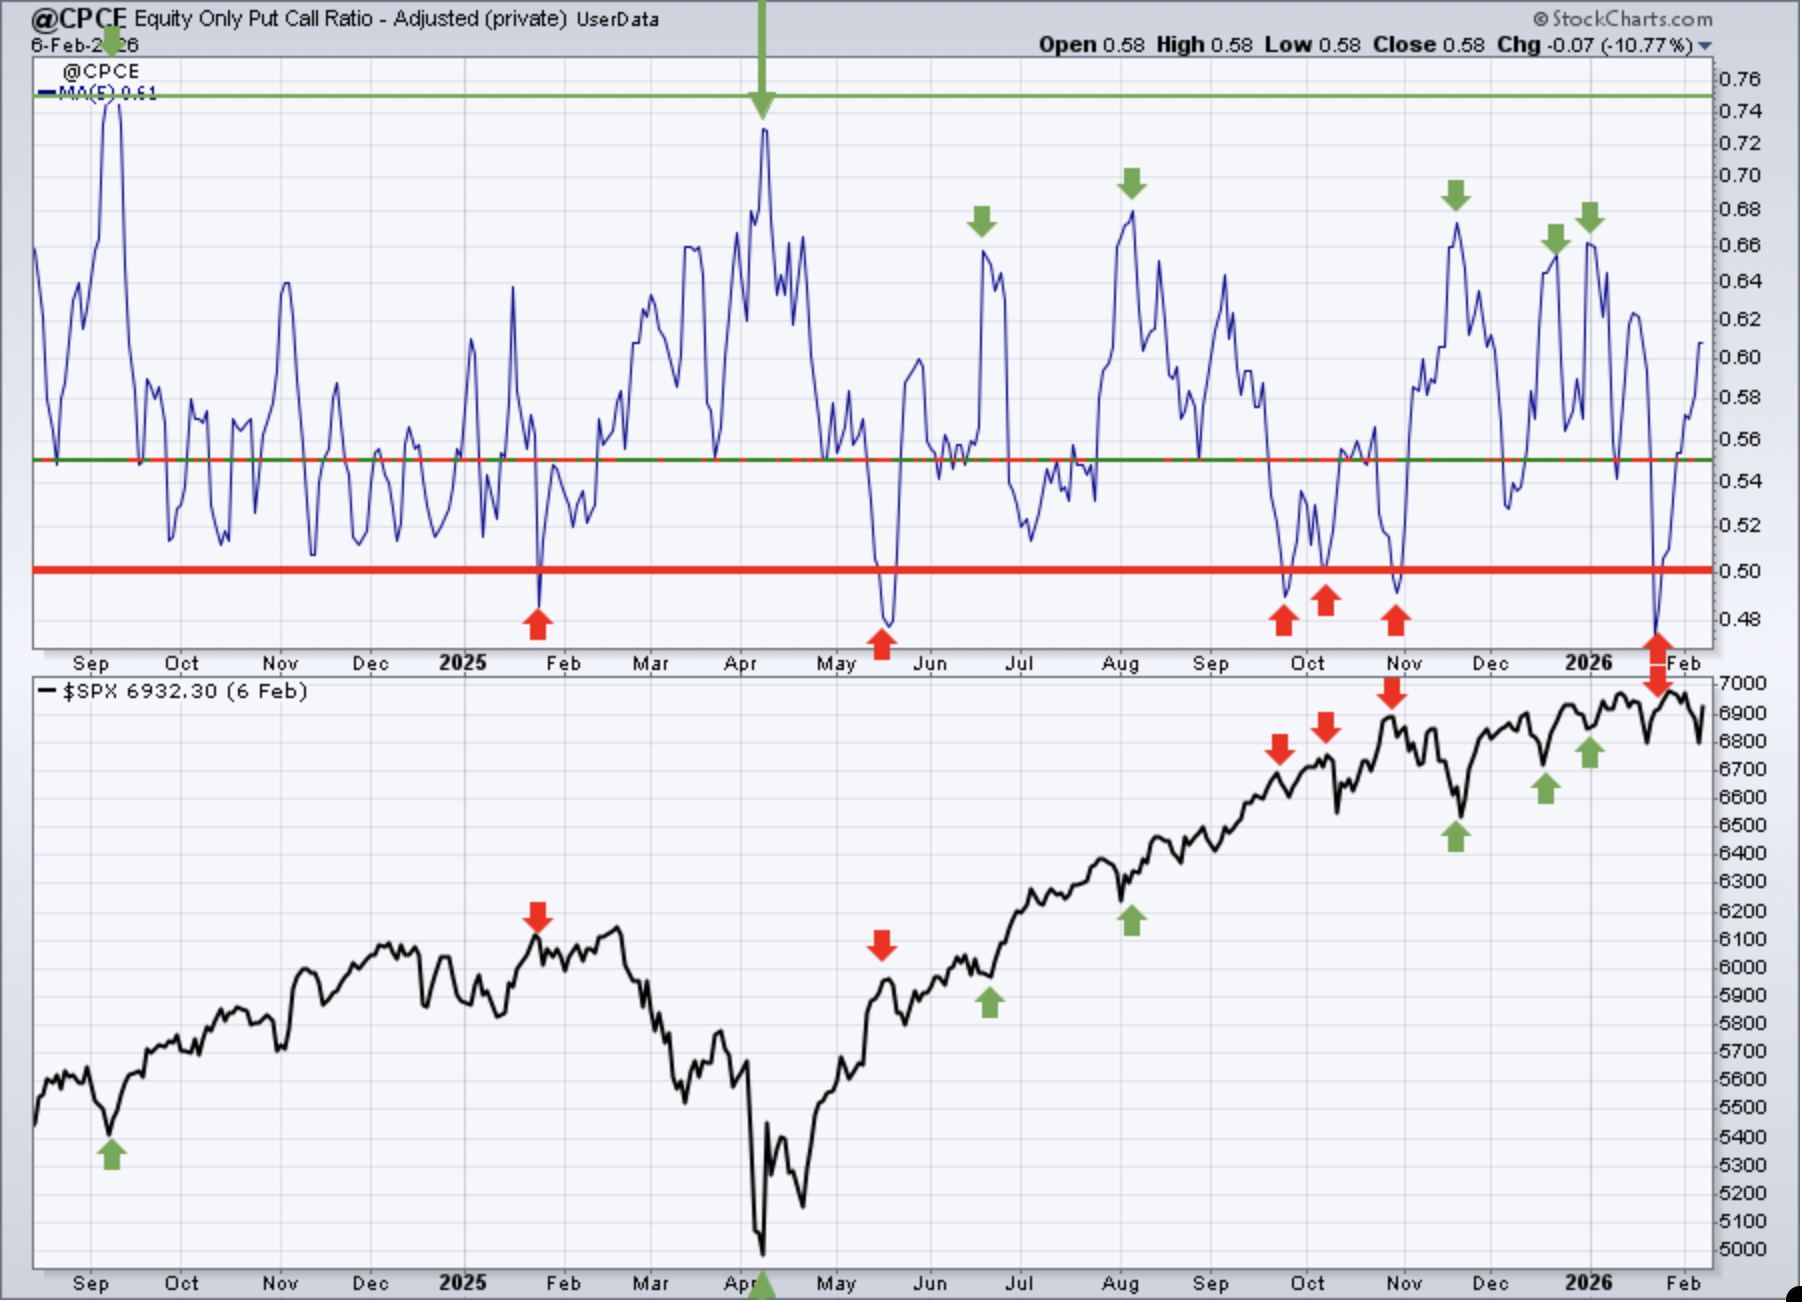
Sentiment indicators are contrarian indicators. When they show extreme bullishness, we need to be a bit cautious and when they show extreme pessimism, it could be time to become much more aggressive. Major market bottoms are carved out when pessimism is at its absolute highest level.
Keep in mind that the above 5-day SMA reading of the CPCE is our "speed boat" sentiment indicator that changes quite frequently. While the .75+ level has been where many short-term bottoms have occurred in the past, the .65 or so level has been marking short-term bottoms in 2025 and 2026. The last dip in this 5-day SMA hit an unusually-low 0.47, the lowest reading we've seen in well over a year. We did see a brief market top and some selling, but today the S&P 500 is right back up near its all-time high around 7000.
Just be aware that the risks of a more significant selloff occur when this 5-day SMA reading reaches the 0.40s. We're more in neutral territory at the moment.
253-day SMA ($CPCE)
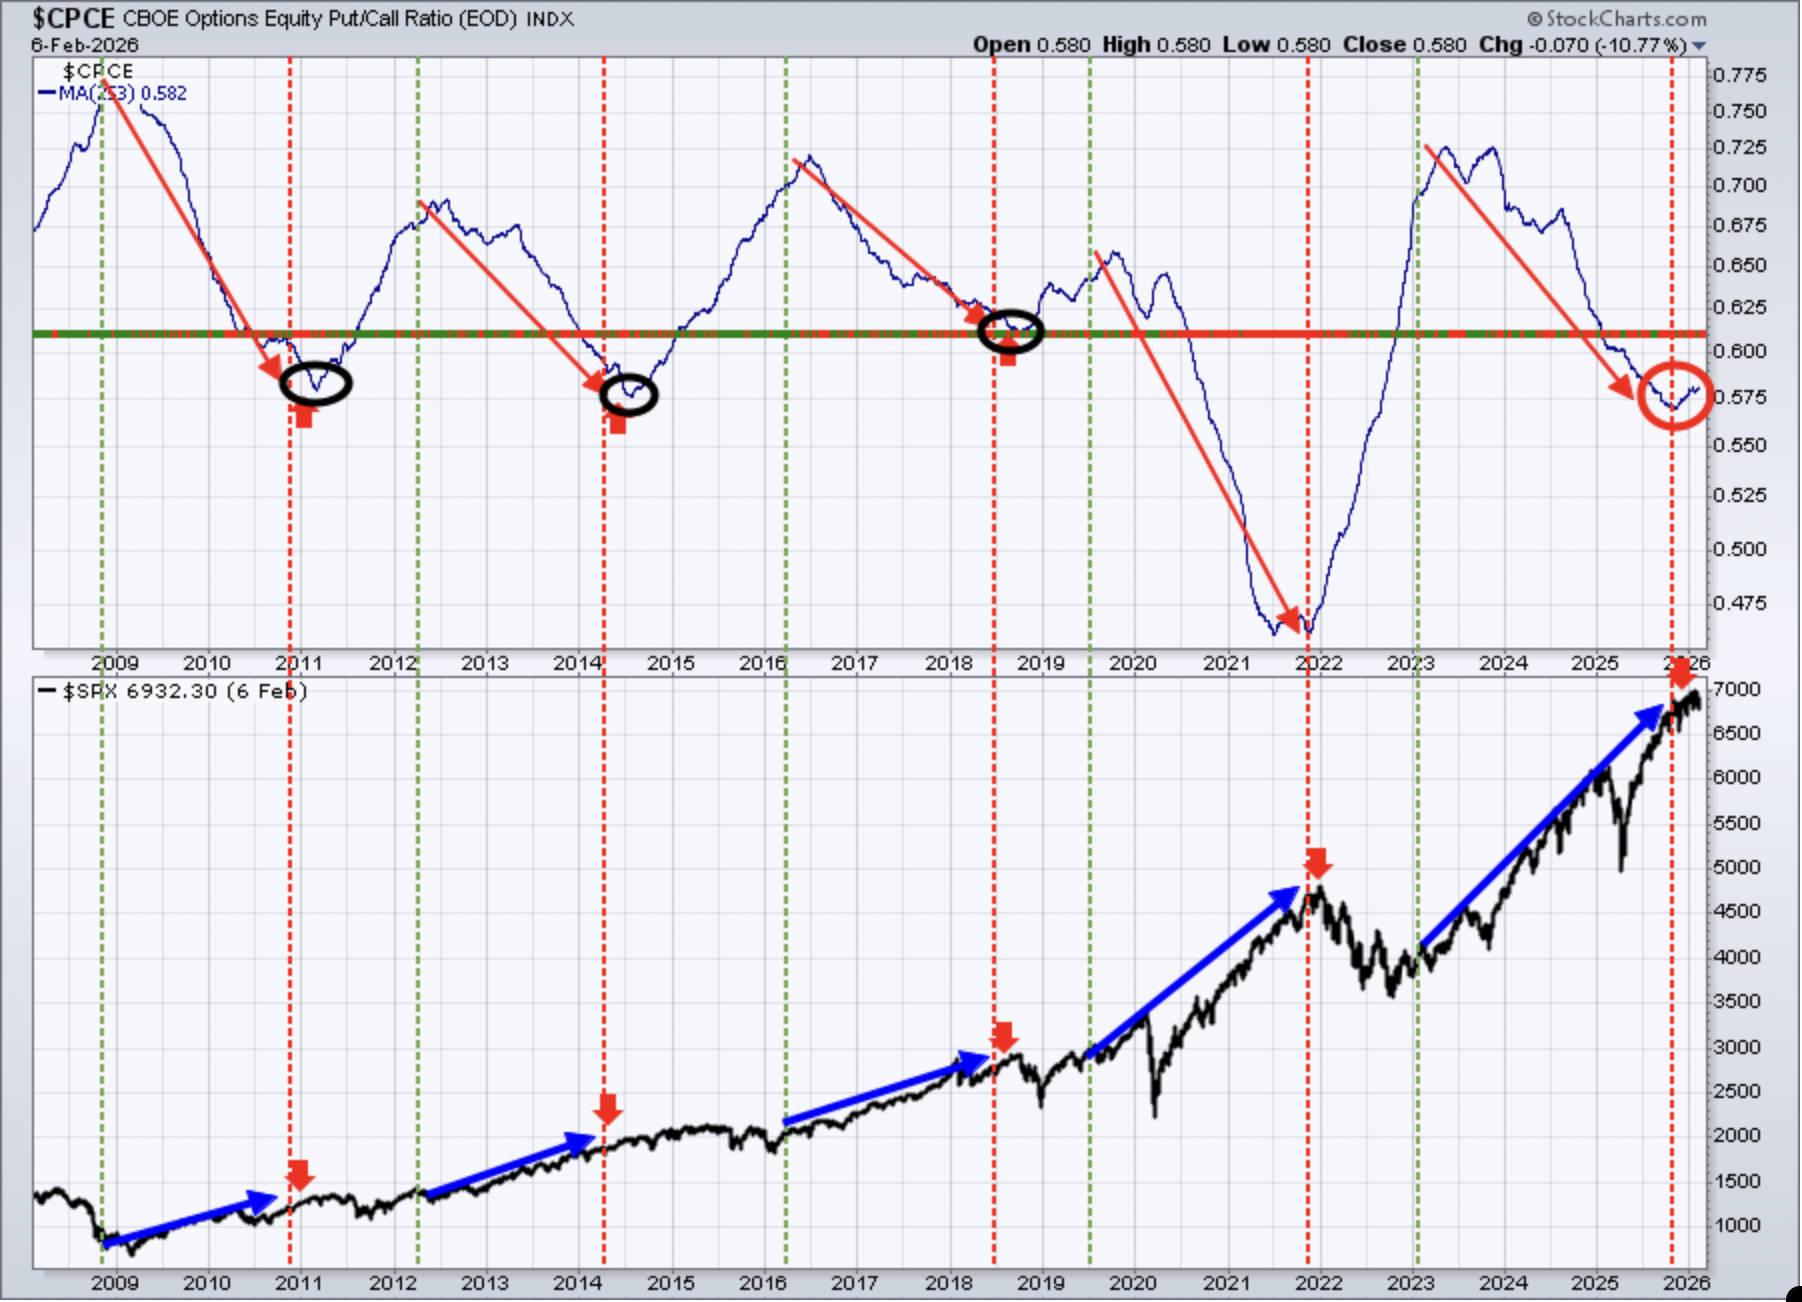
This longer-term 253-day SMA of the CPCE is our "ocean-liner" signal, unlike our short-term speedboat indicator. Any significant change in direction in this 253-day CPCE, in the past, has had profound effects on the S&P 500. I wouldn't want to bet against what this indicator is telling us, which is that we should be cautious in 2026. For the first time since mid-2025, we are clearly seeing this 253-day SMA turn back higher. I do think there's the possibility that this reading turns lower one more time and perhaps prints a double bottom - similar to what we saw in late 2021. Still, the fact that this has begun to turn higher should give bulls a major reason to step back, pause, and re-evaluate how much risk should be taken in this environment. This is what I wrote last week and nothing has really changed.
Long-Term Trade Setup
Since beginning this Weekly Market Report in September 2023, I've discussed the long-term trade candidates below that I really like. Generally, these stocks have excellent long-term track records, and many pay nice dividends that mostly grow every year. Only in specific cases (exceptions) would I consider a long-term entry into a stock that has a poor or limited long-term track record and/or pays no dividends. I try to review the long-term picture once a month. Below is a quick recap of how these stocks look as of Monday, February 9th:
- JPM – a bit stretched on the monthly chart; great performer though
- BA – gaining strength and approaching MAJOR resistance from 250-275
- FFIV – climbing higher after printing double bottom in November
- MA – 525 price support holding, solid entry point with weekly RSI at 44
- GS – pausing in 2026 after huge advance in 2025
- FDX – accelerating to upside after breaking to all-time high to open year
- AAPL – tested October low in 240s, now testing overhead resistance
- CHRW – another huge move higher last 10 months or so; overbought
- JBHT – surging with transports; big breakout over 215 last week
- STX - violently overbought; been an awesome performer for us
- HSY – broke 2-year price resistance at 200 with strong quarterly earnings
- DIS – continues to flounder; 100-125 is the range for now
- MSCI – tested key resistance in 630-640 range before selling off last week
- SBUX - rallied last week to an 11-month high
- KRE – broke to an all-time high last week; regional banks look solid
- ED – looks to be forming right side of cup on 5-year weekly chart
- AJG – selling has monthly RSI near 40 for the first time in a decade
- NSC – broken out of cup with handle and to an all-time high
- RHI – improved in January, but rolling over again; 25 is key support
- ADM – weekly uptrend now obvious; solid
- BG – beautiful breakout to all-time high in January; looks solid
- CVS – looking to hold support in 70-75 range
- HRL - bouncing off downtrend; falling 20-month EMA is resistance
- DE – breaking to all-time high, support now around 525
- LULU - 20-week EMA lost, looking for double bottom near 160
- TTD - in a tortured industry group and continues to fall; 39-40 is resistance
- META - jumped back above its 20-week EMA; in a 600-800 trading range
- ADBE - lost key price support at 275 and in a struggling software space; could be heading towards 200
Keep in mind that our Weekly Market Reports favor those who are more interested in the long-term market picture. Therefore, the list of stocks above are stocks that we believe are safer (but nothing is ever 100% safe) to own with the long-term in mind. Nearly everything else we do at EarningsBeats.com favors short-term momentum trading, so I wanted to explain what we're doing with this list and why it's different.
Also, please keep in mind that I'm not a Registered Investment Advisor (and neither is EarningsBeats.com nor any of its employees) and am only providing (mostly) what I believe to be solid dividend-paying stocks for the long term. Companies periodically go through adjustments, new competition, restructuring, management changes, etc. that can have detrimental long-term impacts. Neither the stock price nor the dividend is ever guaranteed. I simply point out interesting stock candidates for longer-term investors. Do your own due diligence and please consult with your financial advisor before making any purchases or sales of securities.
Looking Ahead
Upcoming Earnings
The following list of companies is NOT a list of all companies scheduled to report quarterly earnings, however, just key reports, so please be sure to check for earnings dates of any companies that you own. Any company in BOLD represents a stock in one of our portfolios and the amount in parenthesis represents the market capitalization of each company listed:
- Monday: BDX ($59 billion), ON ($25 billion)
- Tuesday: KO ($338 billion), AZN ($290 billion), GILD ($185 billion), SPGI ($137 billion)
- Wednesday: CSCO ($325 billion), MCD ($230 billion), TMUS ($226 billion), SHOP ($145 billion), APP ($127 billion)
- Thursday: AMAT ($241 billion), ANET ($162 billion), HWM ($84 billion), ABNB ($75 billion)
- Friday: ENB ($110 billion), CCJ ($48 billion)
Key Economic Reports
- Monday: None
- Tuesday: December retail sales (delayed), November business inventories (delayed)
- Wednesday: January ADP nonfarm payrolls & unemployment rate (delayed)
- Thursday: Initial jobless claims, January existing home sales
- Friday: January CPI
Historical Data
I'm a true stock market historian. I am absolutely PASSIONATE about studying stock market history to provide us more clues about likely stock market direction and potential sectors/industries/stocks to trade. While I don't use history as a primary indicator, I'm always very aware of it as a secondary indicator. I love it when history lines up with my technical signals, providing me with much more confidence to make particular trades.
Below you'll find the next two weeks of historical data and tendencies across the three key indices that I follow most closely. The percentage for each calendar day represents the annualized return for that day. An example of how this is calculated is reflected next to the first day under the S&P 500 and in parenthesis:
S&P 500 (since 1950)
- Feb 9: -45.50% (Ex: cumulative gains = -9.71% over 54 trading days since 1950. -9.71% x 253/54 = -45.50%)
- Feb 10: +1.31%
- Feb 11: +0.32%
- Feb 12: +43.97%
- Feb 13: +48.48%
- Feb 14: +11.40%
- Feb 15: +58.41%
- Feb 16: -21.36%
- Feb 17: -31.56%
- Feb 18: +2.62%
- Feb 19: -24.32%
- Feb 20: -3.39%
- Feb 21: -62.20%
- Feb 22: +10.49%
NASDAQ (since 1971)
- Feb 9: -50.46%
- Feb 10: +31.39%
- Feb 11: +60.54%
- Feb 12: +52.11%
- Feb 13: +38.54%
- Feb 14: +61.75%
- Feb 15: +82.64%
- Feb 16: -39.94%
- Feb 17: -52.28%
- Feb 18: -12.56%
- Feb 19: -48.56%
- Feb 20: -22.51%
- Feb 21: -125.07%
- Feb 22: -11.55%
Russell 2000 (since 1987)
- Feb 9: -22.55%
- Feb 10: -24.86%
- Feb 11: +90.59%
- Feb 12: +99.63%
- Feb 13: +32.91%
- Feb 14: +41.05%
- Feb 15: +140.61%
- Feb 16: +40.51%
- Feb 17: -66.49%
- Feb 18: -37.63%
- Feb 19: -22.46%
- Feb 20: -58.41%
- Feb 21: -110.95%
- Feb 22: -1.86%
The S&P 500 data dates back to 1950, while the NASDAQ and Russell 2000 information date back to 1971 and 1987, respectively.
Final Thoughts
I think it's important to remain objective when reviewing the health of U.S. stocks and that isn't always easy. As many of you know, I would MUCH rather be bullish than cautious or bearish. I still see really good things for U.S. stocks later in 2026 and into the balance of this decade. My biggest concern is just the short-term and what might transpire over the next several months, not years.
Here are a few things that matter to me:
Perspective. In October 2025, the S&P 500 had gained nearly 90% over a 3-year period. That's a LOT when you consider that a normal 3-year return on the S&P 500 would be closer to 30%. History tells us that after such a strong period of gains, we should lower our bar of expectations short-term.
Jobs. Last week's nonfarm payrolls were moved to this Wednesday due to the recent short-lived government shutdown. The Dow Jones Industrials (and Transports) breaking out to all-time highs suggest a strong (or strengthening) economy ahead. Nonfarm payrolls have remained positive, though fairly weak, for nearly a year. A sudden increase in jobs would bode well for the economy, but NOT for interest rate cuts later this year. I think Wall Street is selling growth stocks because they now believe rate cuts are done for 2026.
Sentiment. Whether the economy is strengthening or not doesn't really matter to sentiment. Options traders are very complacent and that usually puts a lid on U.S. equity prices. While the problem isn't MASSIVE like it was to end 2021, it is becoming more and more problematic. The only way to rectify this is to see some selling and volatility in order to turn more and more traders pessimistic.
Happy trading!
Tom