
EB Weekly Market Report - Monday, March 9, 2026
ChartLists/Spreadsheets
The following ChartLists/Spreadsheets were updated over the weekend:
- Strong Earnings (SECL)
- Strong Future Earnings (SFECL)
- Raised Guidance (RGCL)
- Strong AD (SADCL)
- Bullish Trifecta (BTCL)
- Leading Stocks (LSCL)
- Matt's Hot Stocks (HTCL)
- Key Manipulation Spreadsheet
The above ChartLists and spreadsheet have been updated through Friday, March 6th. You can view and/or download these ChartLists from our website, and also read about them to gain a better understanding of how they can help in your trading success. We have discontinued the Upcoming Earnings ChartLists until the new earnings season kicks in during mid April.
Weekly Market Recap
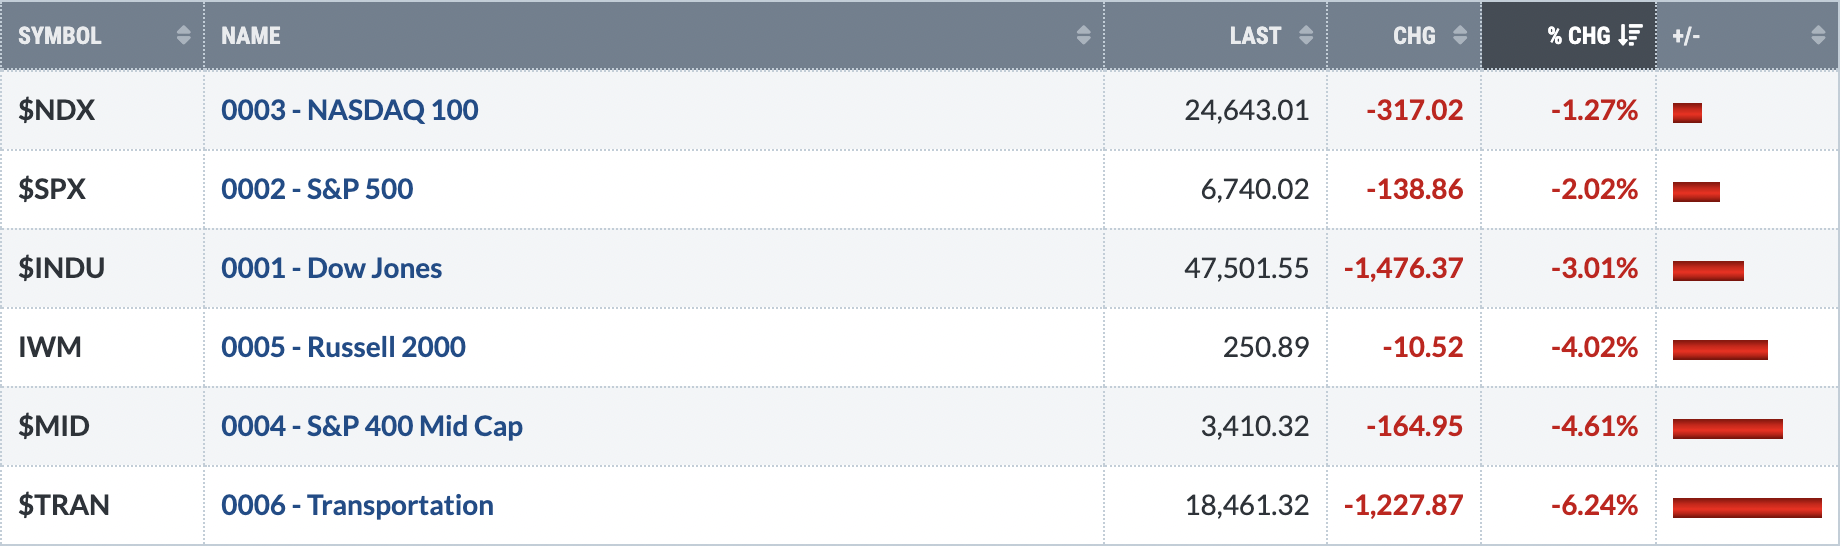
Major Indices
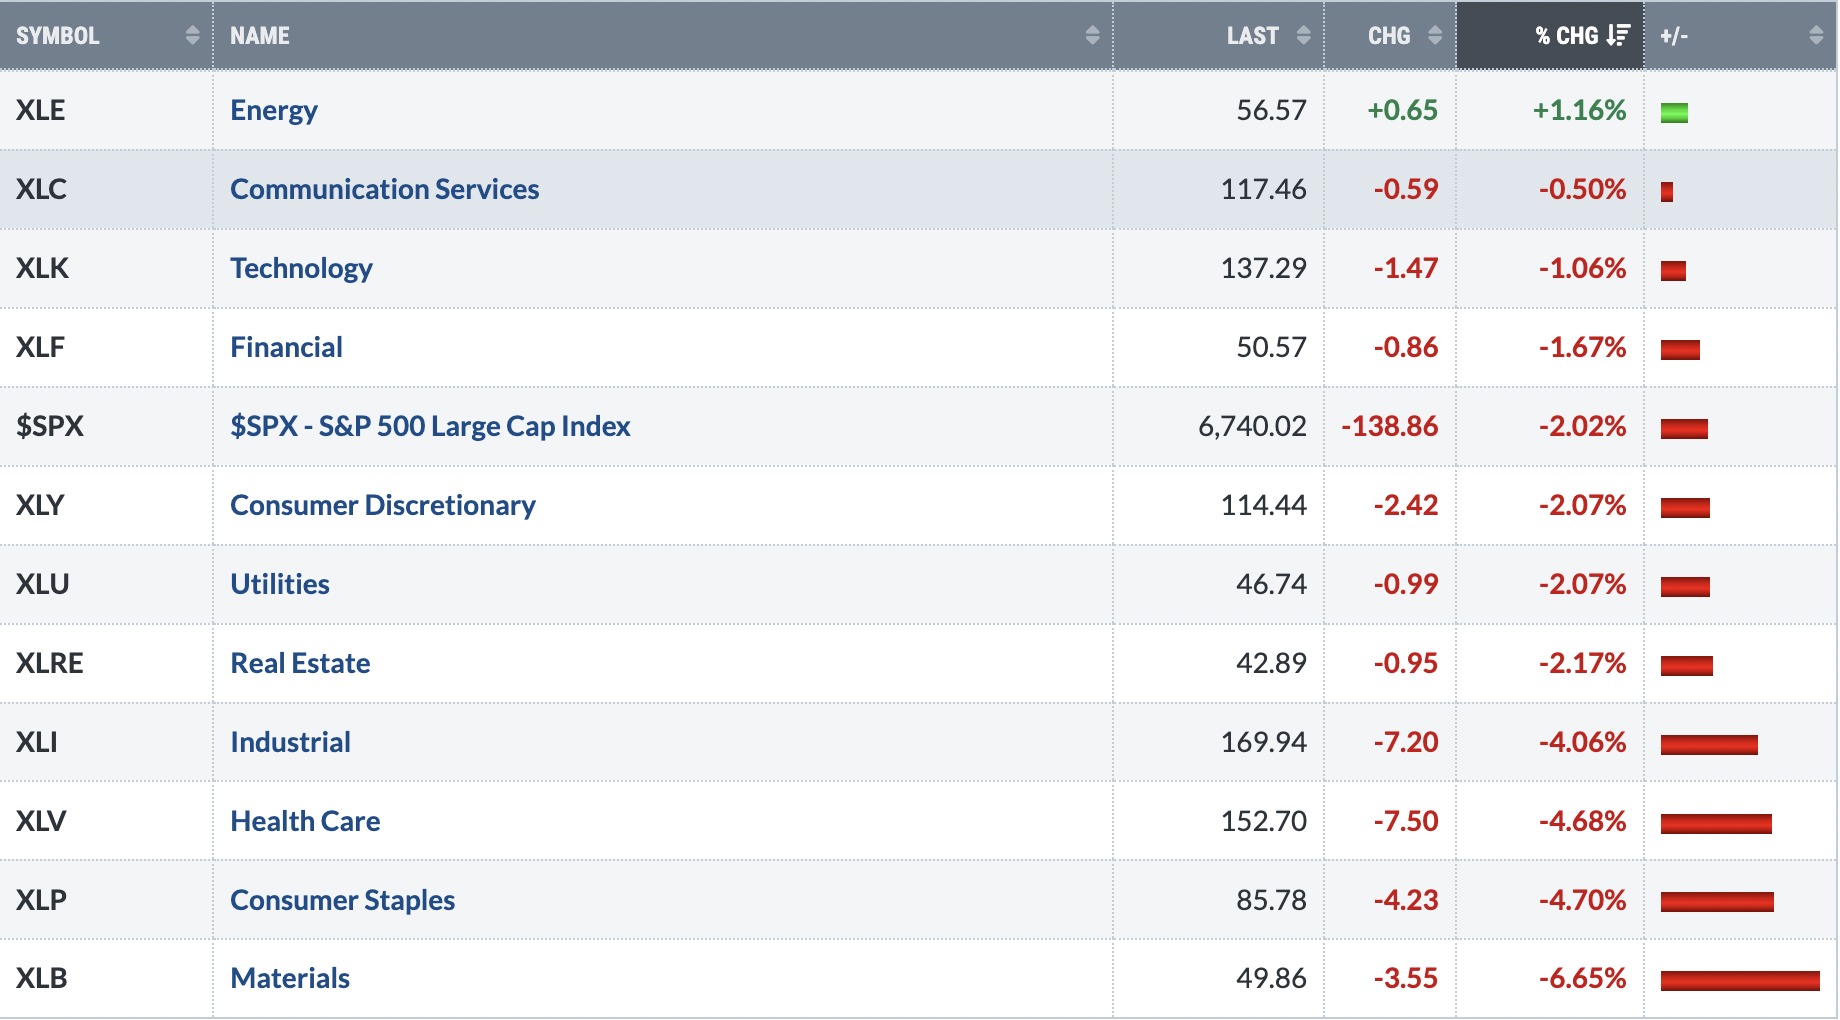
Sectors
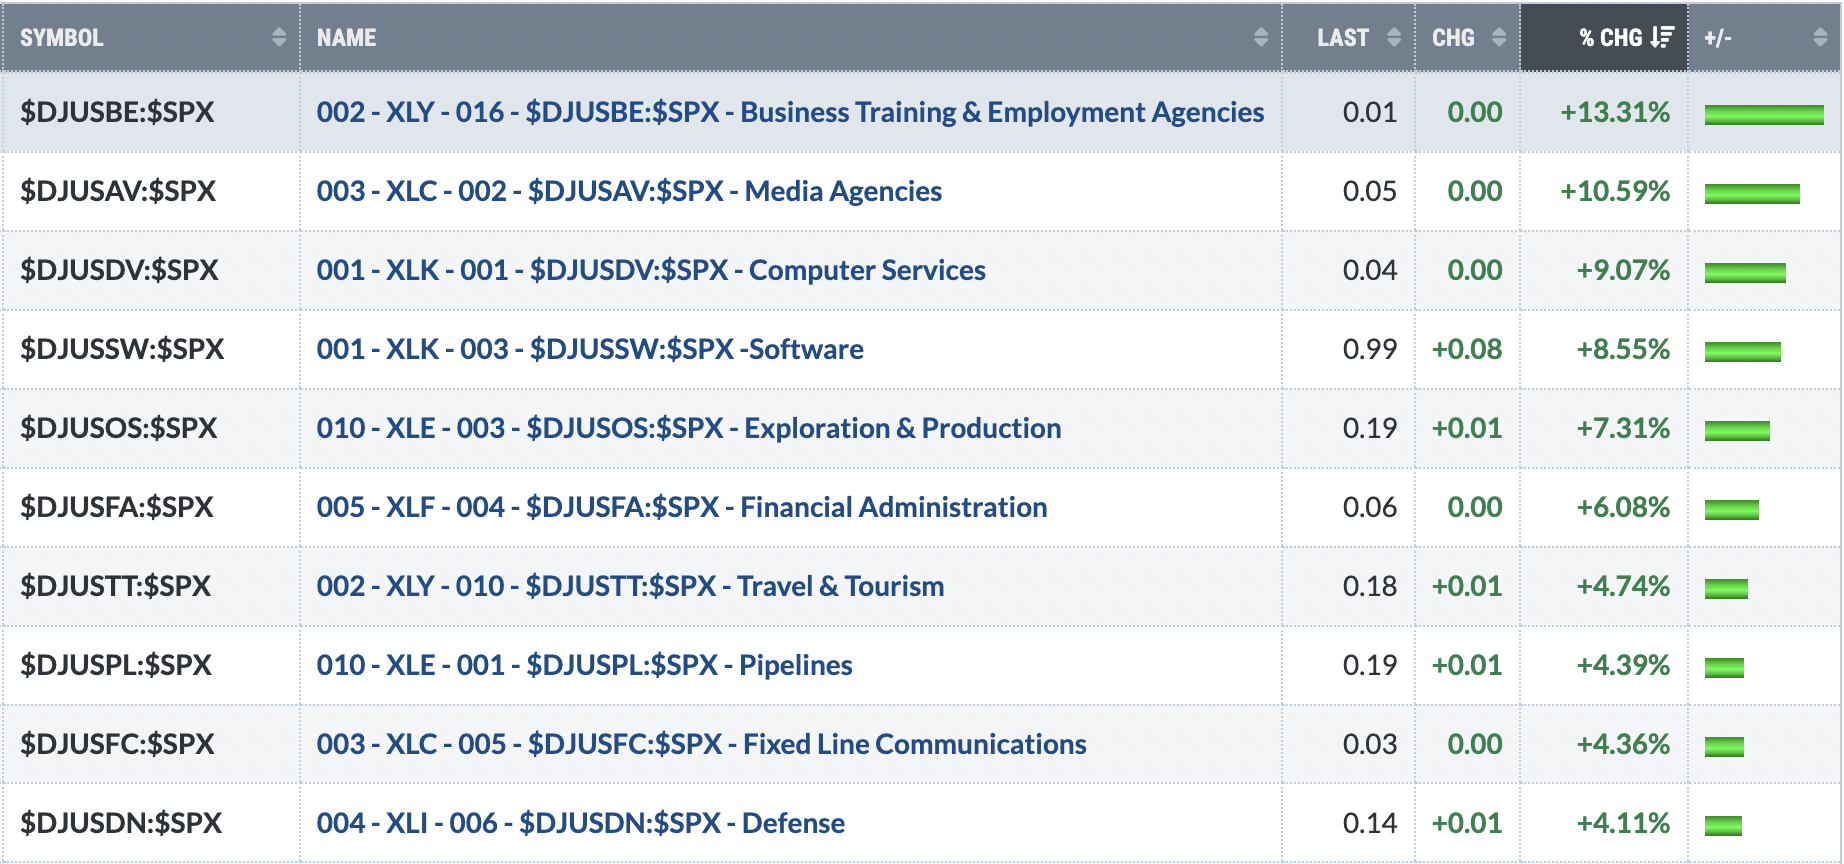
Top 10 Industries Last Week
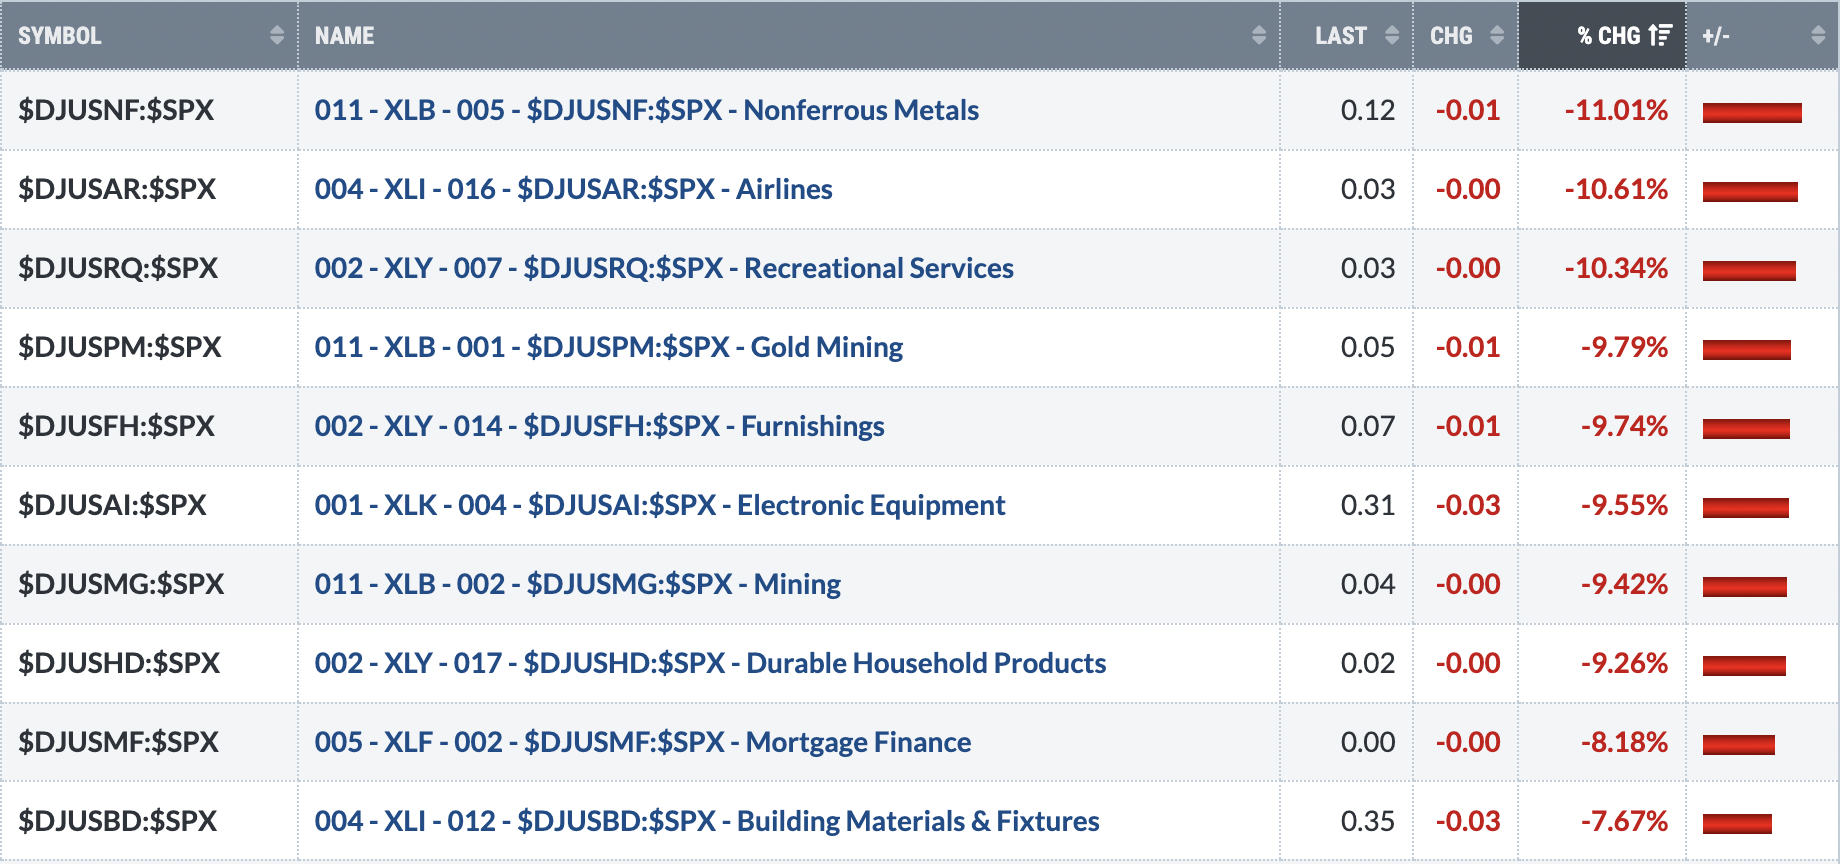
Bottom 10 Industries Last Week
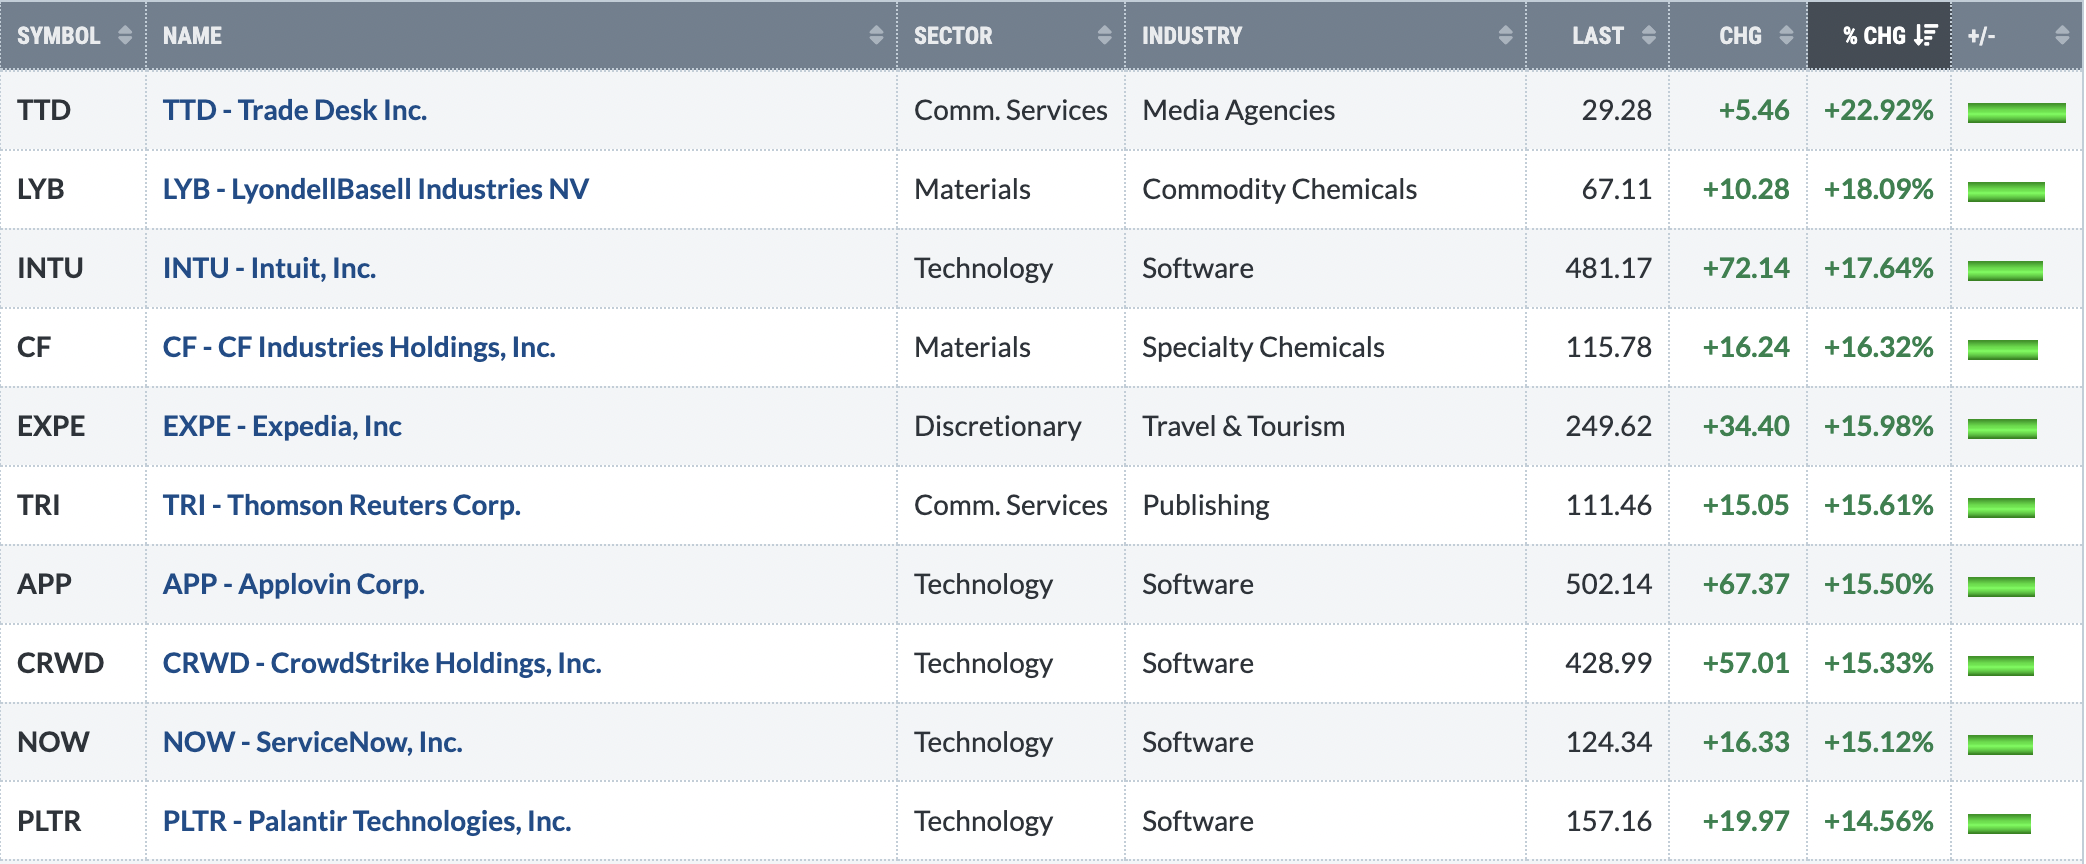
Top 10 Stocks - S&P 500/NASDAQ 100
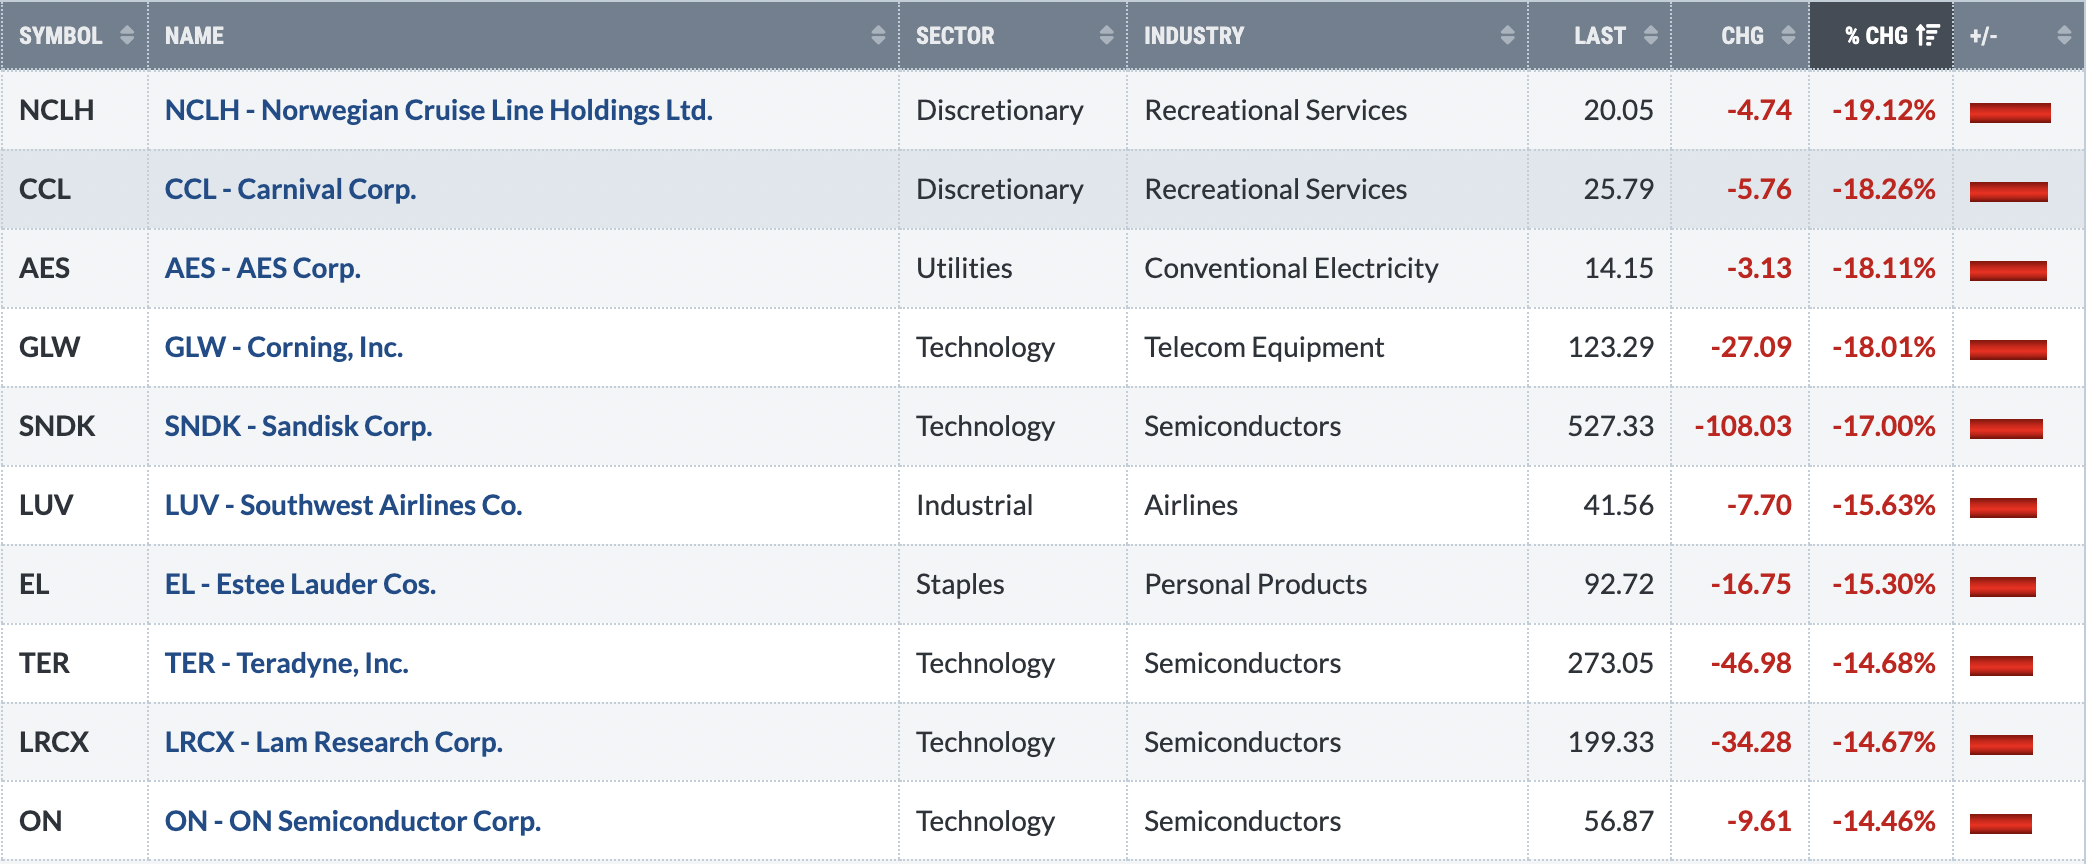
Bottom 10 Stocks - S&P 500/NASDAQ 100
Big Picture
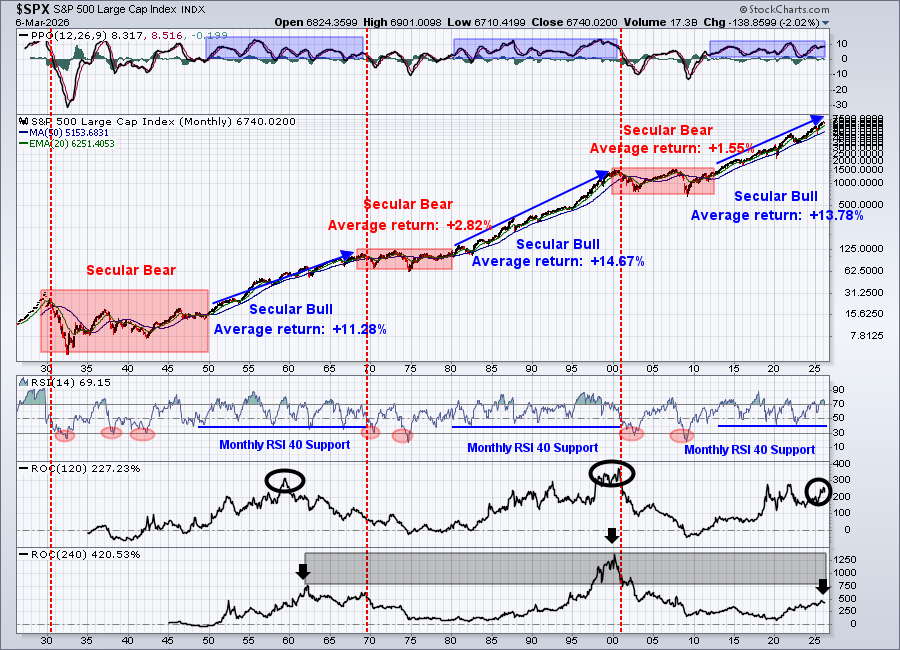
Given everything that's going on right now and with fear escalating, this long-term S&P 500 chart simply drowns it all out. It really doesn't matter what is going on with all of our sustainability ratios, sentiment, the Mag 7, etc. The long-term secular bull market uptrend remains intact.
Sustainability Ratios
Here's the latest look at our key intraday ratios as we follow where the money is traveling on an INTRADAY basis (ignoring gaps):
QQQ:SPY
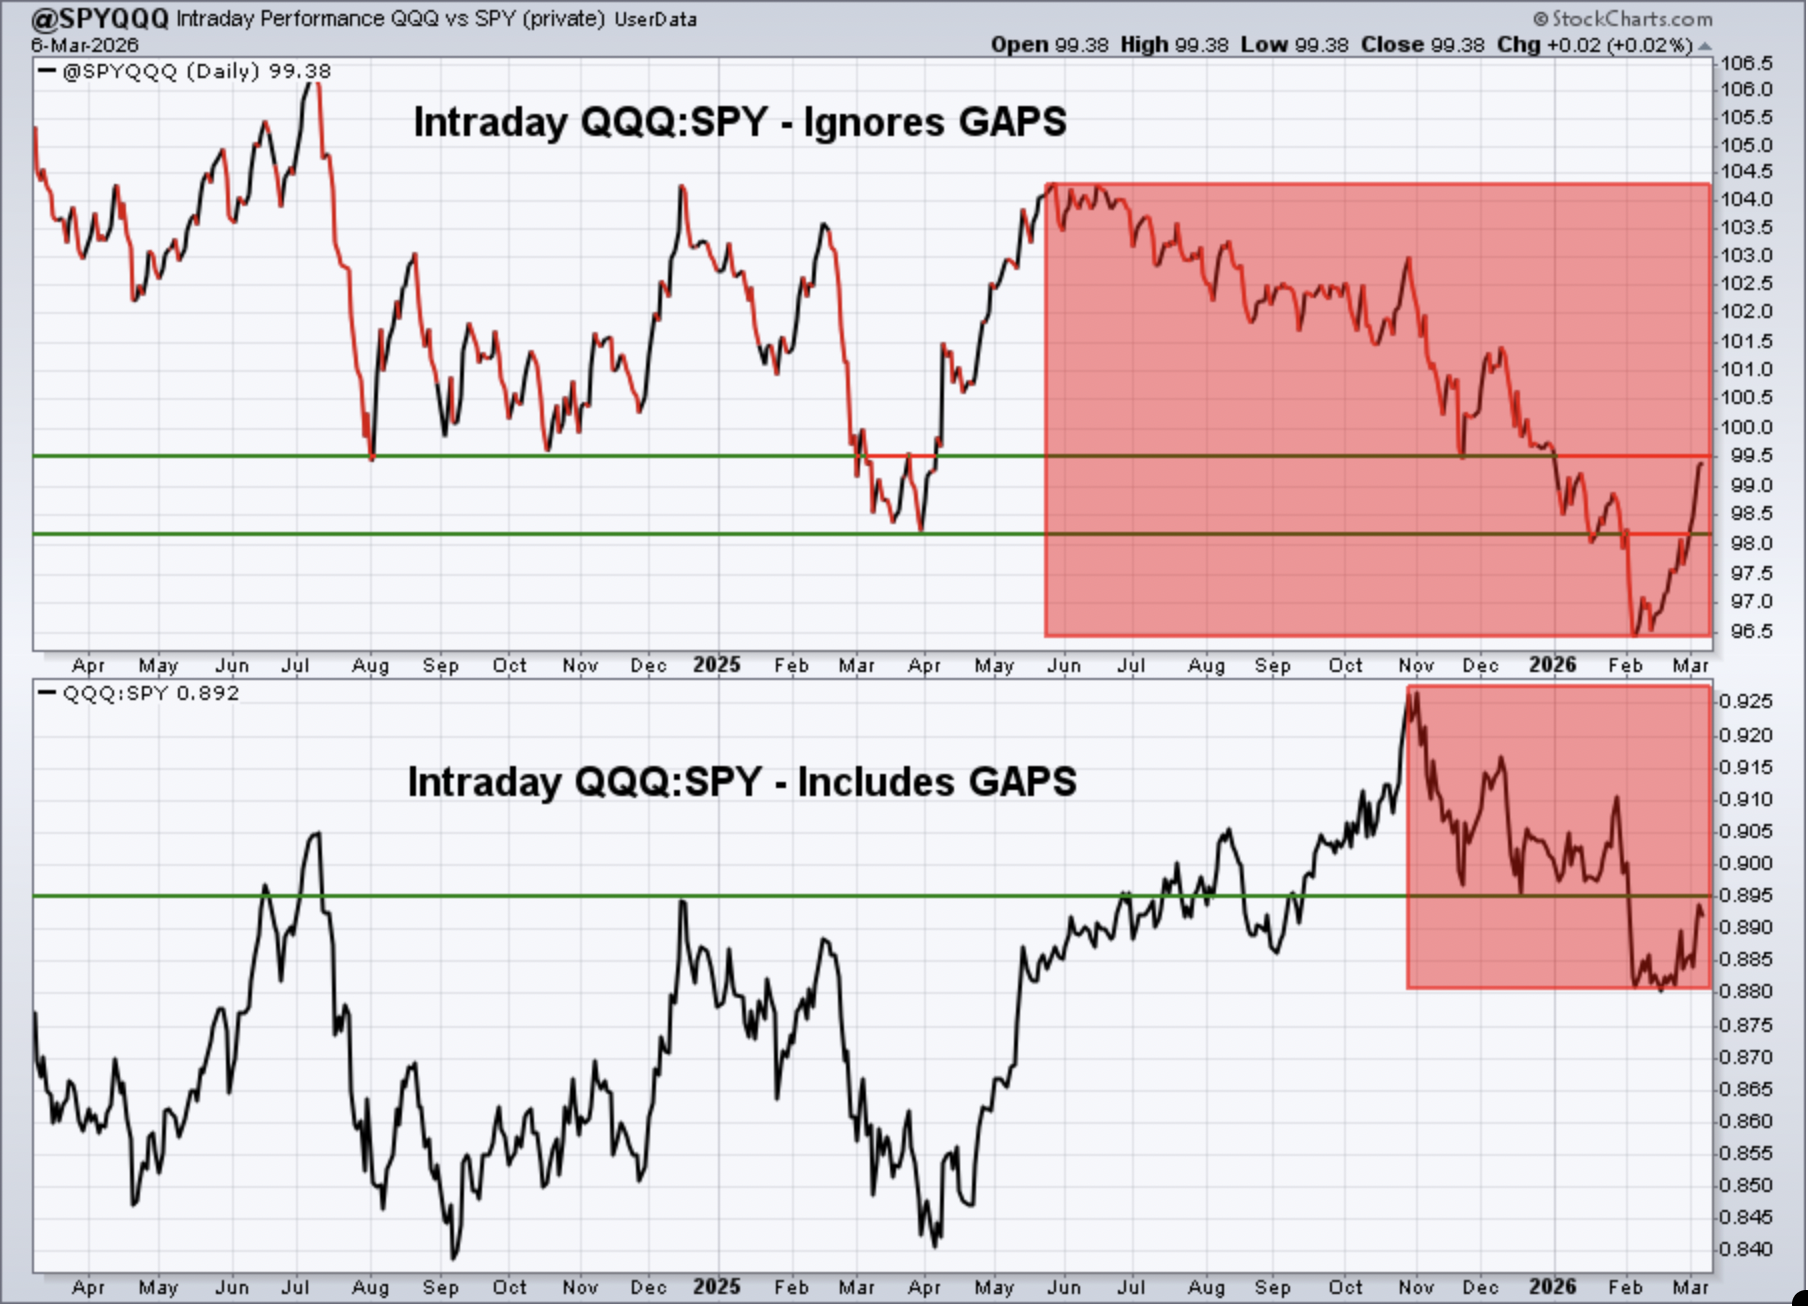
Keep in mind that the intraday analysis provided is a "work in progress". I continue to analyze this data to see if it helps provide us clues about calling market direction. It makes common sense to me that it should help in some sense, but it'll require a much longer-term study to determine its worth.
Last week, nearly everything flipped. What was working turned down extremely hard and what wasn't working rebounded. Our ratios really weren't any different. The QQQ:SPY ratio had been moving lower nearly every day.....until last week. Suddenly, a significant reversal took place. It would be long-term bullish if this QQQ:SPY ratio keeps rising.
IWM:QQQ
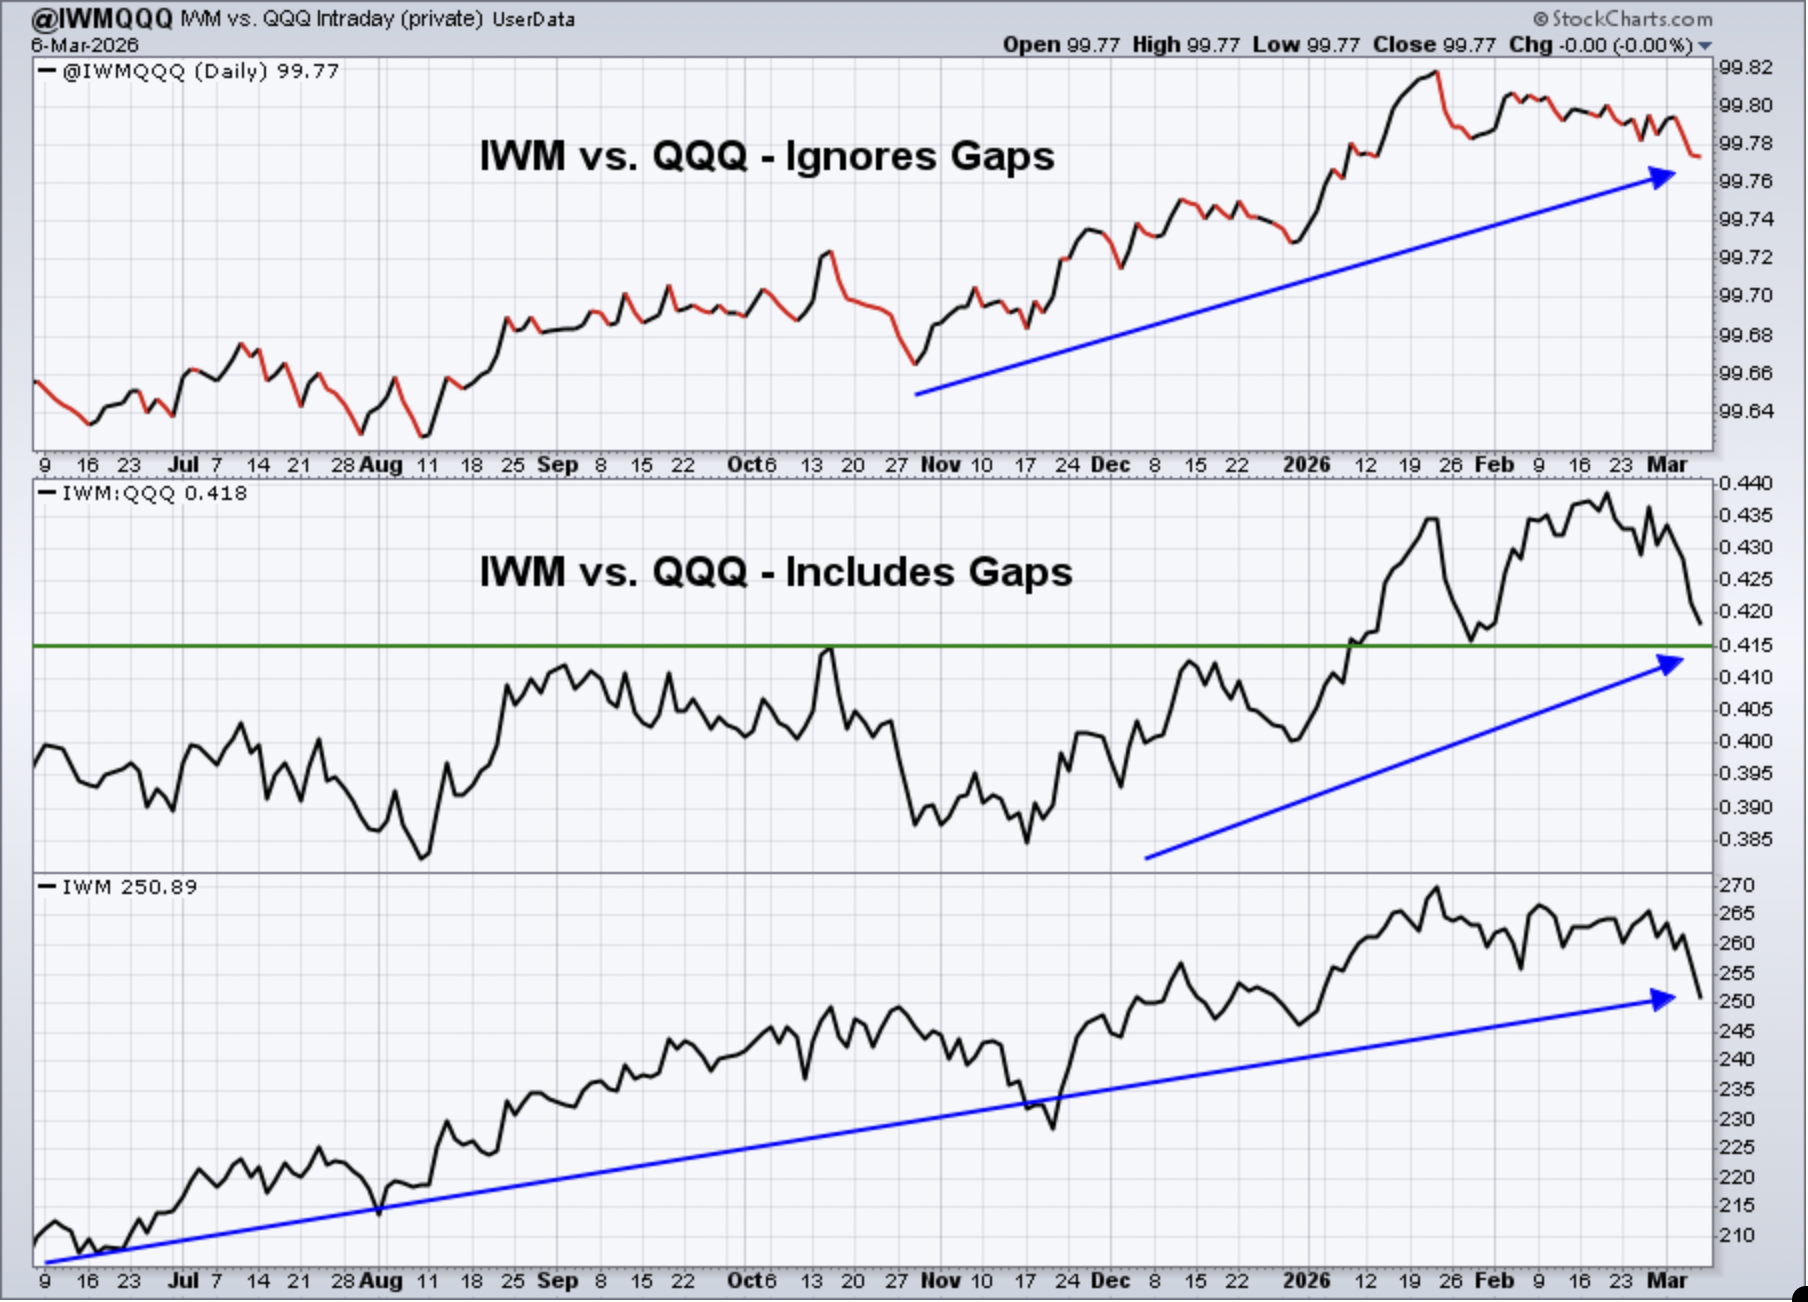
Last week, I said the relative strength of small caps couldn't be argued. Well, one week later, it can be argued. Like everything else, small caps suffered a very quick reversal last week and underperformed significantly.
XLY:XLP
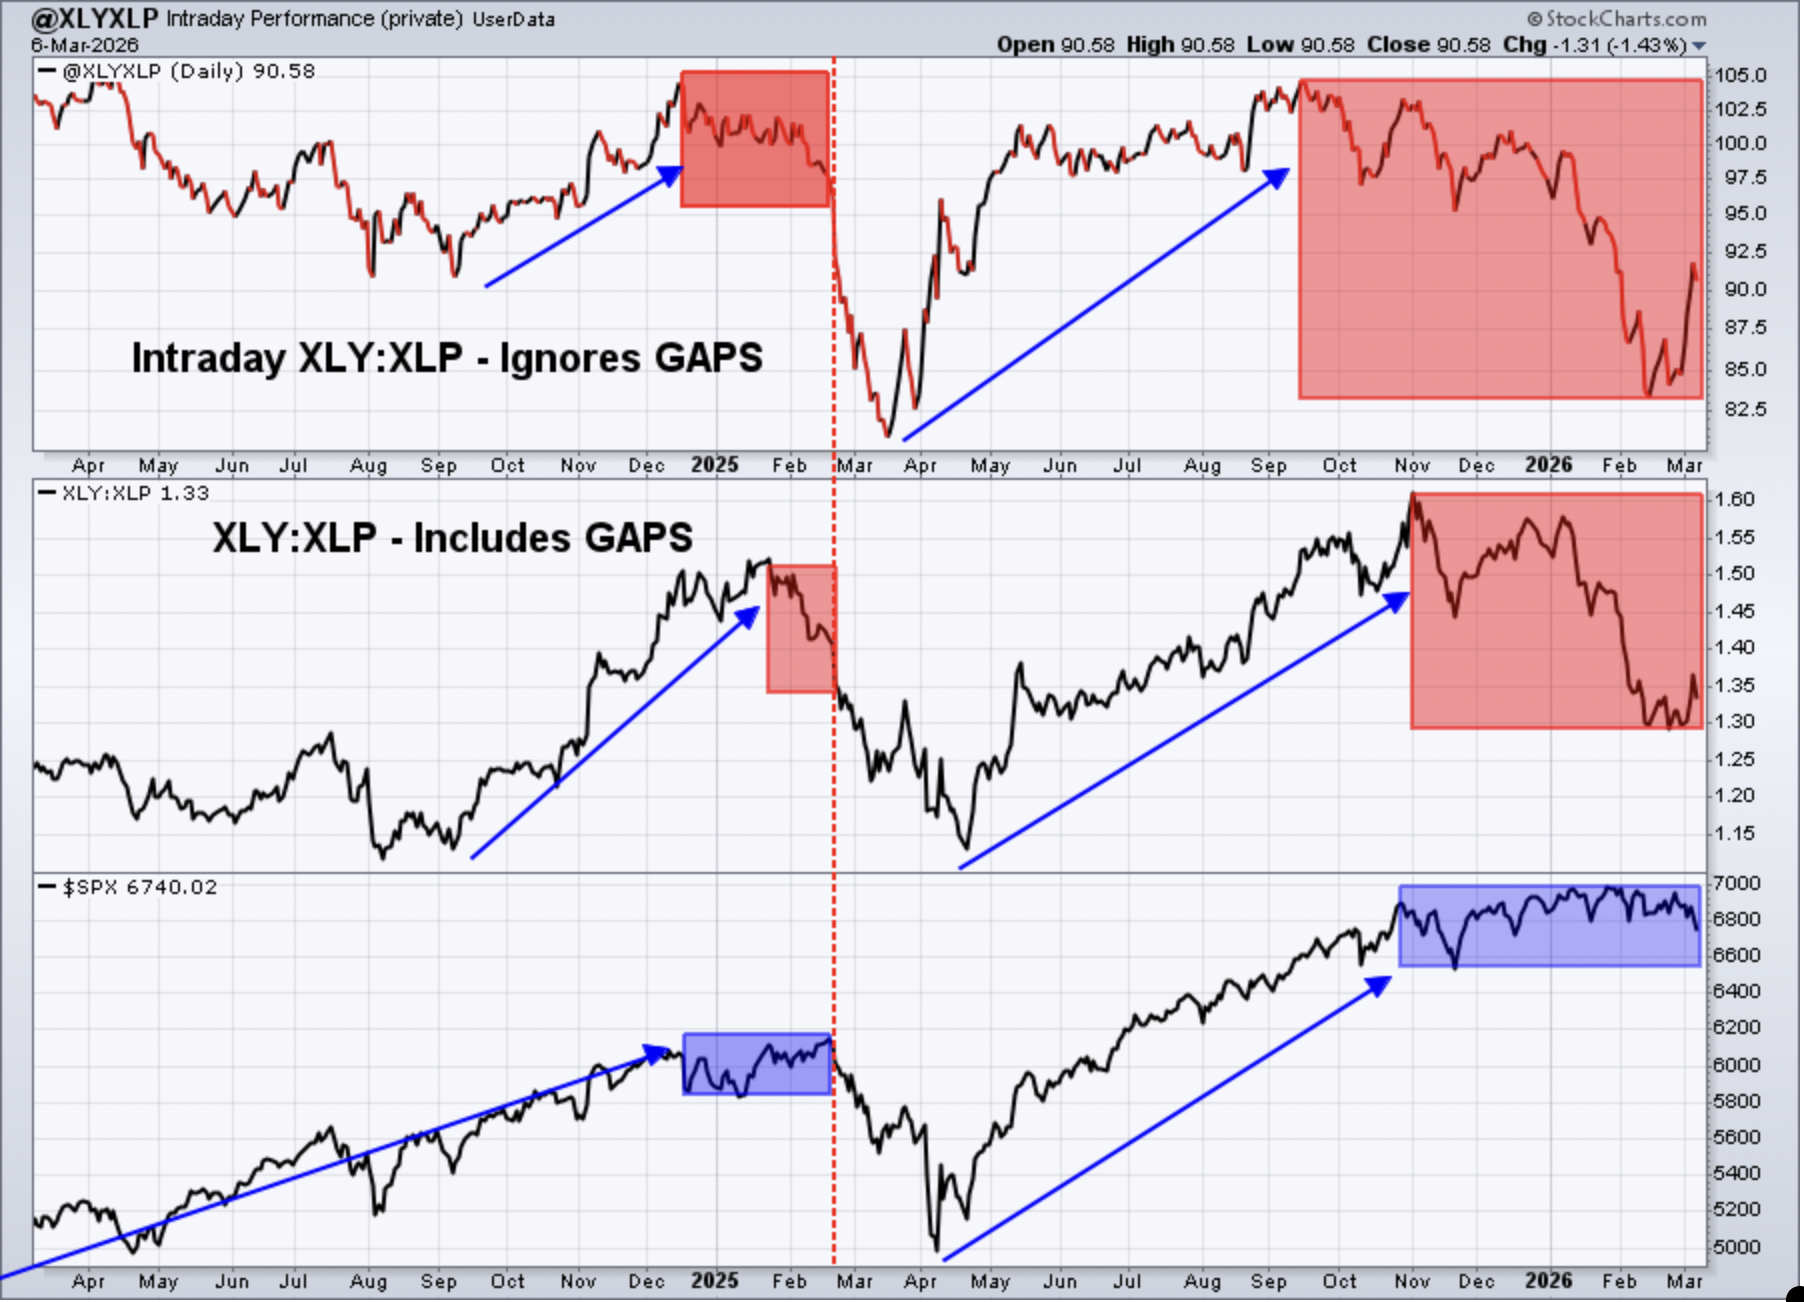
After many weeks of underperformance, the XLY reversed course and easily outperformed the XLP from Monday through Thursday. Friday saw a bit of rotation back towards the more defensive XLP. It'll be interesting to see which consumer group performs best this coming week.
Sentiment
5-day SMA ($CPCE)
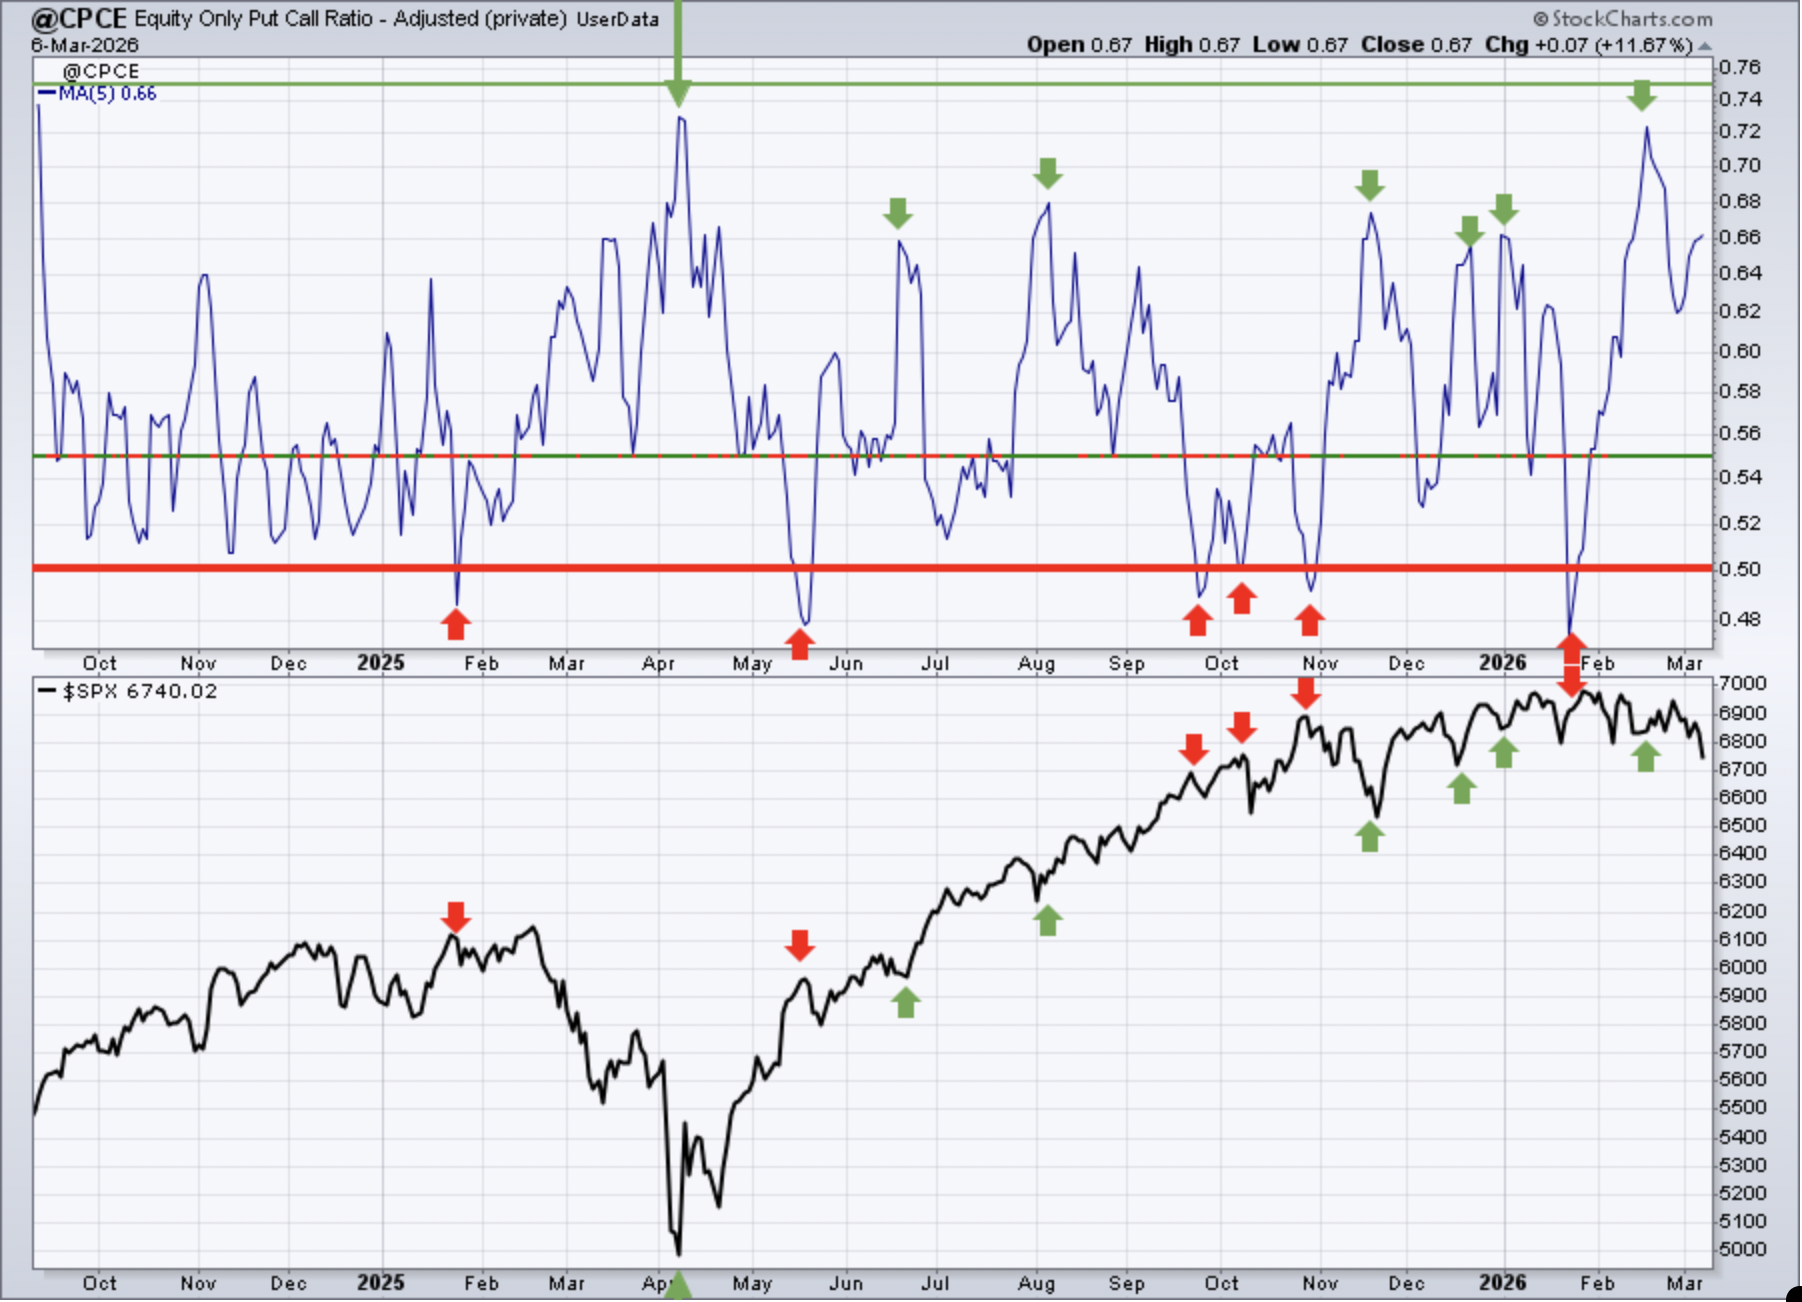
Sentiment indicators are contrarian indicators. When they show extreme bullishness, we need to be a bit cautious and when they show extreme pessimism, it could be time to become much more aggressive. Major market bottoms are carved out when pessimism is at its absolute highest level.
Keep in mind that the above 5-day SMA reading of the CPCE is our "speed boat" sentiment indicator that changes quite frequently. While the .75+ level has been where many short-term bottoms have occurred in the past, the .65 or so level has been marking short-term bottoms in 2025 and 2026. From last week's report:
"The 5-day CPCE is now moving back and forth, much like our major key indices. I'd expect to see a jump to .75 or higher on this 5-day SMA if the S&P 500 eventually loses support at 6797."
Well, the S&P 500 lost 6797 support on Friday, so we'll see whether the 5-day CPCE spikes this week. It did start to rise again last week, but remained in neutral territory at week's end.
253-day SMA ($CPCE)
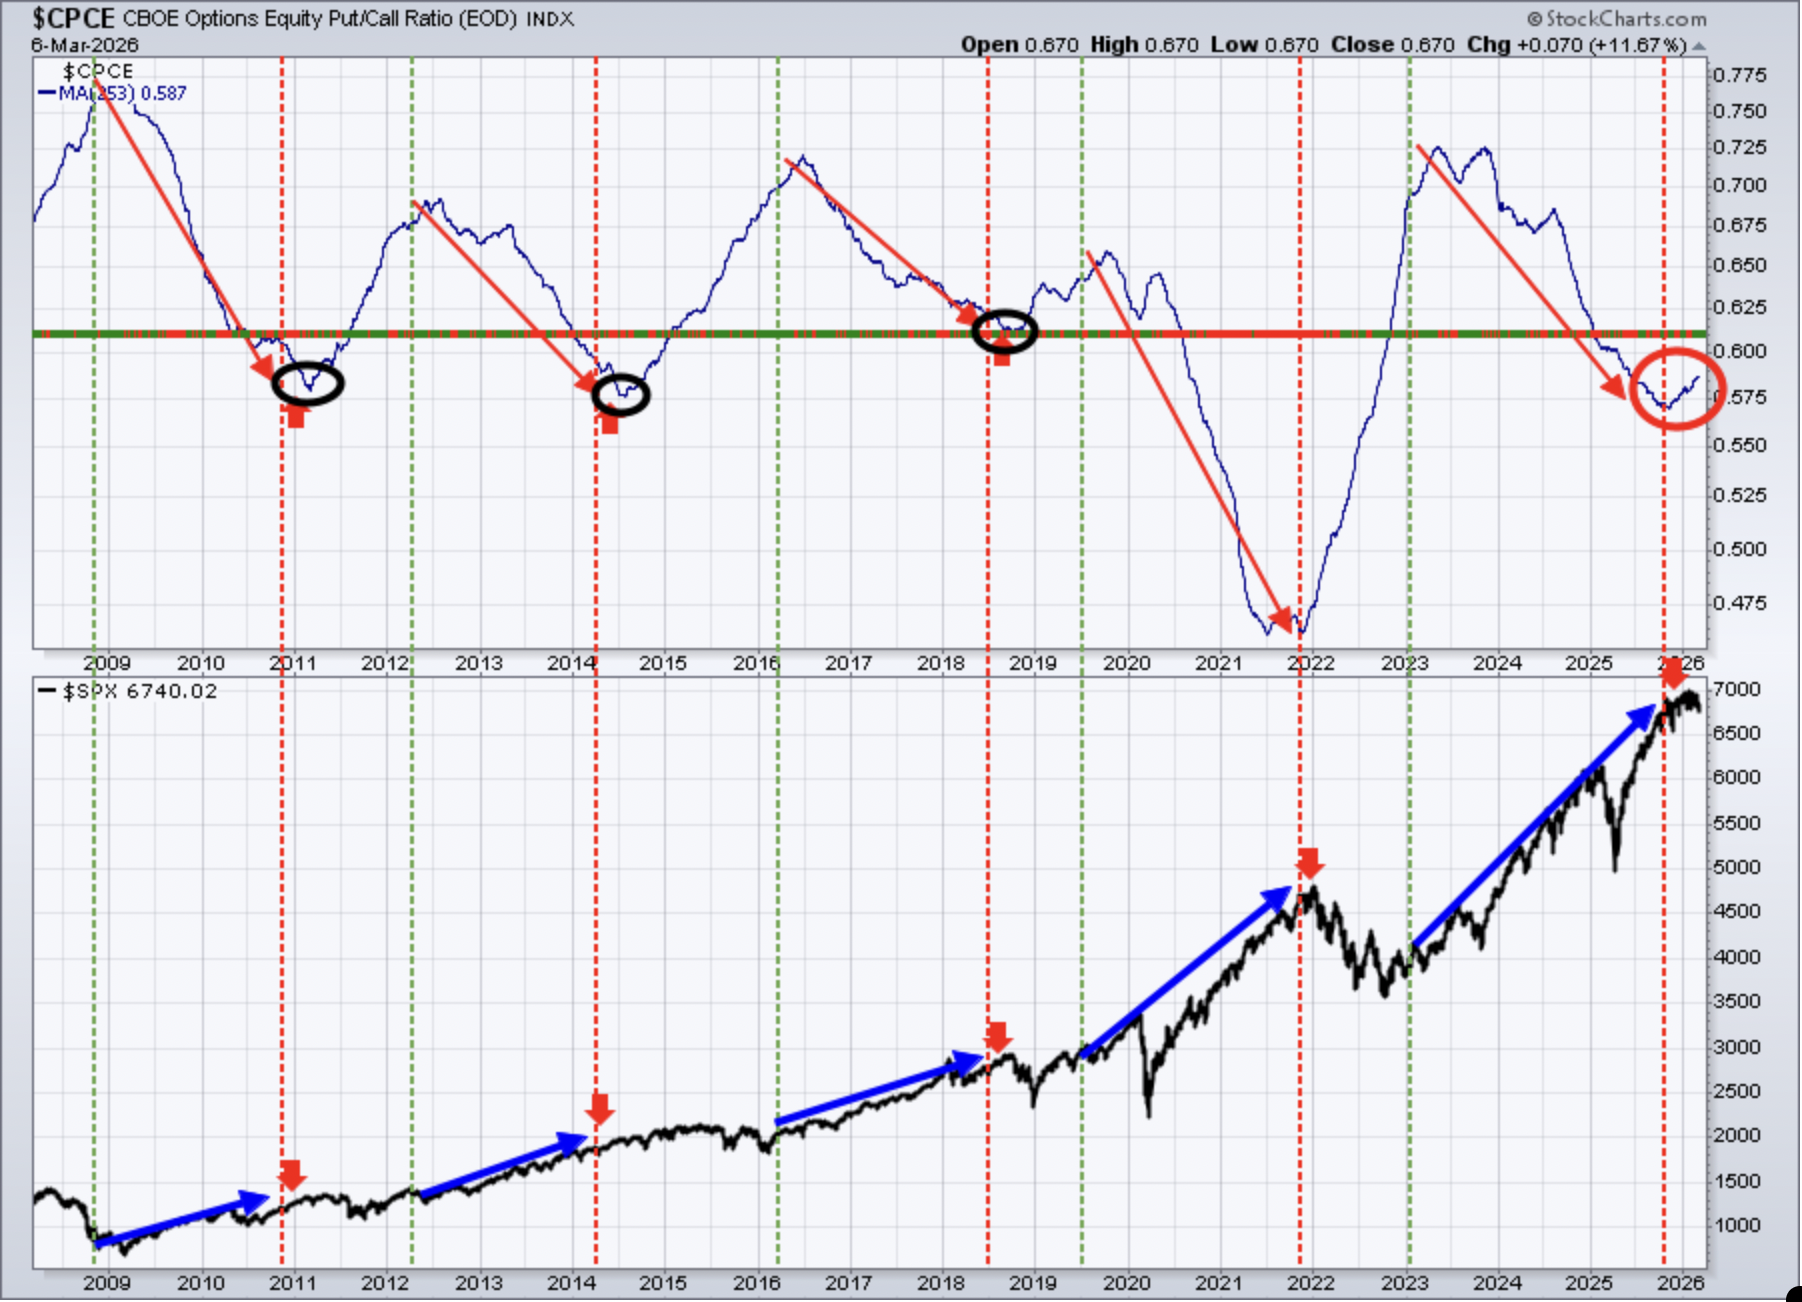
This longer-term 253-day SMA of the CPCE is our "ocean-liner" signal, unlike our short-term speedboat indicator. Any significant change in direction in this 253-day CPCE, in the past, has had profound effects on the S&P 500. It seems that long-term sentiment is now "resetting". Any time we see a bottom in this 253-day SMA and a turn to the upside, it's a challenge for U.S. equities. Please note that these turns to the upside have previously occurred in the middle of our secular bull market. So while the recent turn higher does suggest a challenge ahead, it does NOT signal the start of a significant bear market.
Long-Term Trade Setup
Since beginning this Weekly Market Report in September 2023, I've discussed the long-term trade candidates below that I really like. Generally, these stocks have excellent long-term track records, and many pay nice dividends that mostly grow every year. Only in specific cases (exceptions) would I consider a long-term entry into a stock that has a poor or limited long-term track record and/or pays no dividends. I try to review the long-term picture once a month. Below is a quick recap of how these stocks looked on MONTHLY charts as of Monday, March 2nd:
- JPM – look for more sideways action ahead as the monthly PPO rolls over
- BA – could be on the verge of a major move; needs to clear 250-275
- FFIV – long-term trend is higher, now back above its rising 20-month EMA
- MA – 525 price support holding, solid entry point with weekly RSI at 44
- GS – likely needs a rest after a massive 2-year run; 20-month EMA near 700
- FDX – this one looks great, just breaking above double top at 300
- AAPL – steady climber, consolidating 2025 rise; 20-month EMA is support
- CHRW – overbought after massive 9-10 month run higher
- JBHT – a leader in the red-hot transportation area; monthly PPO strengthens
- STX - monthly RSI at 92+, so clearly overbought; what a massive rise
- HSY -waited patiently for a breakout above 200, now rollin
- DIS - 125 is the number; clear that and DIS could be off to the races
- MSCI - lots of consolidation, needs to break above 650
- SBUX - working on its 5th year of consolidation, needs a breakout
- KRE – ran to all-time high before pulling back recently
- ED – breaking out as it heads into the seasonally-favorable month of March
- AJG - steady performer for 15 years; might have found support with bounce
- NSC – like JBHT, rallying and breaking out on heels of transports strength
- RHI – January rally gave way to big February selling; expect a dividend cut
- ADM – rallying back over past year with monthly PPO now above zero line
- BG – breakout after 4 years of consolidation a very bullish signal
- CVS – holding 70 support remains key, continues to improve
- HRL - short-term rally is nice, but key will be clearing 27.50
- DE – latest earnings report sent stock to new all-time high; excellent chart
- LULU - needs a catalyst to end its 2+ year slide; looking for 150 to hold
- TTD - free falling within one of worst industries - software; 15-20 is support
- META - remains in range from 600-800; may consolidate further
- ADBE - broke down below 2022 low, reports earnings in two weeks
We're adding a consumer staples company, Kimberly Clark (KMB), to our Long-Term Trade Setups. It has fallen roughly 20% over the course of the last year, which has rarely occurred this century. Furthermore, KMB has increased its dividend in each of the last 54 years. Given that its dividend yield currently is 4.84%, we believe that KMB sets up beautifully here for those interested primarily in income vs. capital appreciation. KMB does have a long-term track record of nice capital appreciation as well, but the dividend has the most appeal at KMB's current price level. Here's a long-term monthly chart of KMB:
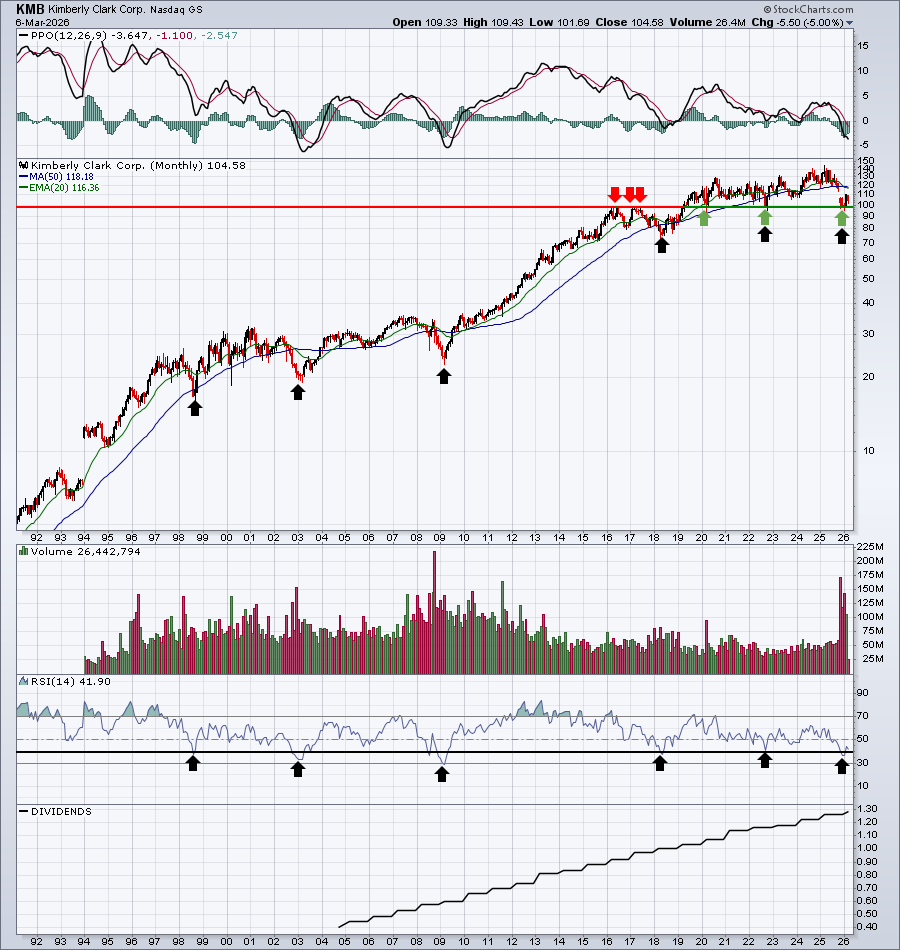
StockCharts only shows the dividends increasing for the past 20 or so years, but KMB has increased its dividend every year since the early-1970s. It's also worth noting that KMB has been an excellent buy each and every time its monthly RSI has dipped down to 40 or below. It's at 41 right now after recently moving just below 40.
Keep in mind that our Weekly Market Reports favor those who are more interested in the long-term market picture. Therefore, the list of stocks above are stocks that we believe are safer (but nothing is ever 100% safe) to own with the long-term in mind. Nearly everything else we do at EarningsBeats.com favors short-term momentum trading, so I wanted to explain what we're doing with this list and why it's different.
Also, please keep in mind that I'm not a Registered Investment Advisor (and neither is EarningsBeats.com nor any of its employees) and am only providing (mostly) what I believe to be solid dividend-paying stocks for the long term. Companies periodically go through adjustments, new competition, restructuring, management changes, etc. that can have detrimental long-term impacts. Neither the stock price nor the dividend is ever guaranteed. I simply point out interesting stock candidates for longer-term investors. Do your own due diligence and please consult with your financial advisor before making any purchases or sales of securities.
Looking Ahead
Upcoming Earnings
The following list of companies is NOT a list of all companies scheduled to report quarterly earnings, however, just key reports, so please be sure to check for earnings dates of any companies that you own. Any company in BOLD represents a stock in one of our portfolios and the amount in parenthesis represents the market capitalization of each company listed:
- Monday: HPE ($29 billion)
- Tuesday: ORCL ($445 billion)
- Wednesday: None
- Thursday: BABA ($301 billion), ADBE ($116 billion), DG ($32 billion), ULTA ($29 billion)
- Friday: None
Key Economic Reports
- Monday: None
- Tuesday: February existing home sales
- Wednesday: February CPI
- Thursday: Initial jobless claims, February housing starts & building permits
- Friday: Q4 GDP, January personal income & spending, January PCE index (delayed), January durable goods, January JOLTS, March consumer sentiment
Historical Data
I'm a true stock market historian. I am absolutely PASSIONATE about studying stock market history to provide us more clues about likely stock market direction and potential sectors/industries/stocks to trade. While I don't use history as a primary indicator, I'm always very aware of it as a secondary indicator. I love it when history lines up with my technical signals, providing me with much more confidence to make particular trades.
Below you'll find the next two weeks of historical data and tendencies across the three key indices that I follow most closely. The percentage for each calendar day represents the annualized return for that day. An example of how this is calculated is reflected next to the first day under the S&P 500 and in parenthesis:
S&P 500 (since 1950)
- Mar 9: -18.01% (Ex: cumulative gains = -3.77% over 53 trading days since 1950. -3.77% x 253/53 = -18.01%)
- Mar 10: +28.20%
- Mar 11: +32.36%
- Mar 12: -29.45%
- Mar 13: +37.40%
- Mar 14: -12.13%
- Mar 15: +65.38%
- Mar 16: +32.01%
- Mar 17: +86.75%
- Mar 18: +35.69%
- Mar 19: -24.44%
- Mar 20: -10.39%
- Mar 21: -12.24%
- Mar 22: -25.58%
NASDAQ (since 1971)
- Mar 9: -39.99%
- Mar 10: +15.08%
- Mar 11: +26.89%
- Mar 12: -72.06%
- Mar 13: +100.86%
- Mar 14: -10.64%
- Mar 15: +3.76%
- Mar 16: -8.26%
- Mar 17: +96.69%
- Mar 18: +34.85%
- Mar 19: -7.19%
- Mar 20: -66.36%
- Mar 21: +16.41%
- Mar 22: -6.61%
Russell 2000 (since 1987)
- Mar 9: -76.04%
- Mar 10: +9.70%
- Mar 11: +10.81%
- Mar 12: -75.20%
- Mar 13: +89.11%
- Mar 14: -58.46%
- Mar 15: -22.48%
- Mar 16: -89.92%
- Mar 17: +153.80%
- Mar 18: +15.09%
- Mar 19: +26.92%
- Mar 20: -72.55%
- Mar 21: +28.78%
- Mar 22: -102.39%
The S&P 500 data dates back to 1950, while the NASDAQ and Russell 2000 information date back to 1971 and 1987, respectively.
Final Thoughts
Last week was one of the most perplexing that I've seen in a long, long time. Nearly everything reversed course. Hot stocks were suddenly ice cold. Stocks unable to catch a bid for weeks caught fire. Asset classes reversed. The Dow Jones and small caps, two asset classes that had performed extremely well in 2026, took bigger hits. The iShares Semiconductor ETF (SOXX) tumbled 8%. But the iShares Software (IGV) shot higher by 8%. It was a down week, but discretionary stocks (XLY) outperformed staples stocks (XLP). Growth (IWF) crushed value (IWD). Our portfolios were hit as hard as any week that I can remember over the past 3-4 years. Our momentum ChartLists, which favor the best-performing stocks across the major indices, were pummeled. It was truly a crazy week and we may be in store for more craziness in the week ahead.
Here are a few things that I'll be watching this week:
The War in Iran and Crude Oil. Listen, I'll never be able to predict the news. But I can tell when market signals are flashing caution. A stock market with a VIX in the 17-20 range, and certainly above 20, is not in a position to handle bad news. We had plenty of bad news last week, starting with the war in Iran and soaring crude oil prices. Crude jumped 35% last week, the highest jump we've seen since the Persian Gulf war in 1990. That coincided with a cyclical bear market, so we MUST be cognizant of things that can go wrong with this type of conflict.
Jobs and Inflation. One fear that I've had for months is that we'd get a negative jobs report. Well, that fear was realized on Friday as the nonfarm payrolls number turned negative to the tune of -92,000 jobs. That was a far cry from the +50,000 expected and considerably lower than the 126,000 reported in the prior month. The downturn in jobs might suggest rate cuts could be on the way, but inflation has recently come in higher than expected. The February CPI report will be released on Wednesday.
Sentiment. Last week, I wondered how the Volatility Index ($VIX) could be near 20, while the S&P 500 remained in a narrow range just below its all-time high. Well, that changed in a big way last week! The VIX soared and closed near 30, while the S&P 500 finally caved beneath 6797 price support, closing at 6740. I am ALWAYS nervous with a VIX over 20 and rising. But near 30 and rising? Not good.
Rotation. We saw money move in much more bullish fashion last week and it didn't matter - at least not yet. Personally, I believe it matters a lot over the long haul, so I'd love to see this bullish rotation continue, even if prices continue to move lower. It's a signal that Wall Street is buying the types of stocks that do well in a secular bull market, which, in turn, suggests this selling won't last. But in the short-term, it's still quite painful.
Happy trading!
Tom