
EB Weekly Market Report - Monday, May 4, 2026
ChartLists/Spreadsheets
The following ChartLists/Spreadsheets were updated either late yesterday or earlier this morning and have been updated on our website:
- Strong Earnings (SECL)
- Strong Future Earnings (SFECL)
- Raised Guidance (RGCL)
- Bullish Trifecta (BTCL)
- Short Squeeze (SSCL)
- Leading Stocks (LSCL)
- Matt's Hot Stocks (HTCL)
- Upcoming Earnings
- Upcoming Earnings Relative Strength
The above ChartLists and spreadsheet have been updated through Friday, May 1st. You can view and/or download these ChartLists from our website, and also read about them to gain a better understanding of how they can help in your trading success.
I will be working on the May Seasonality Report this afternoon and tomorrow and I hope to have the May Seasonality ChartList (list of stocks that have historically performed well during the month of May) on the website by tomorrow afternoon.
Weekly Market Recap
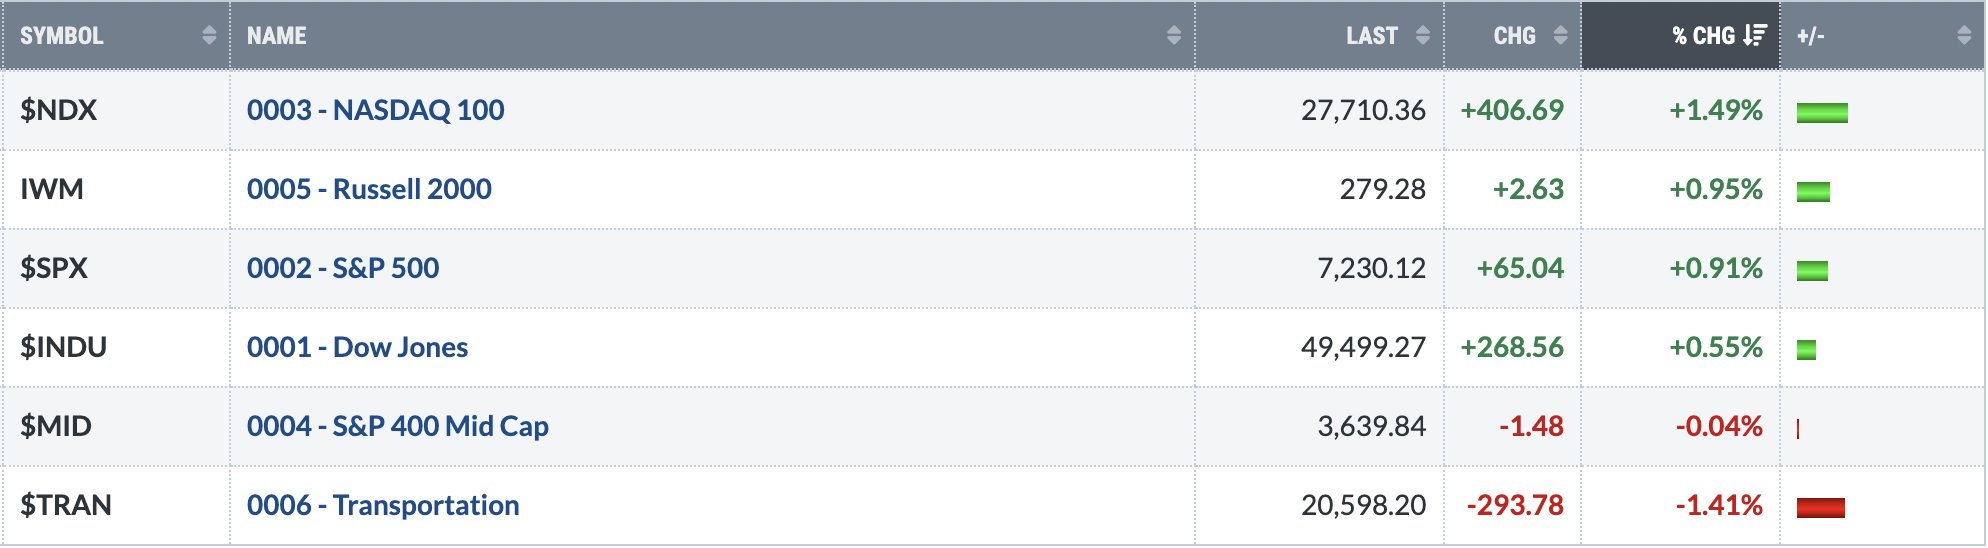
Major Indices
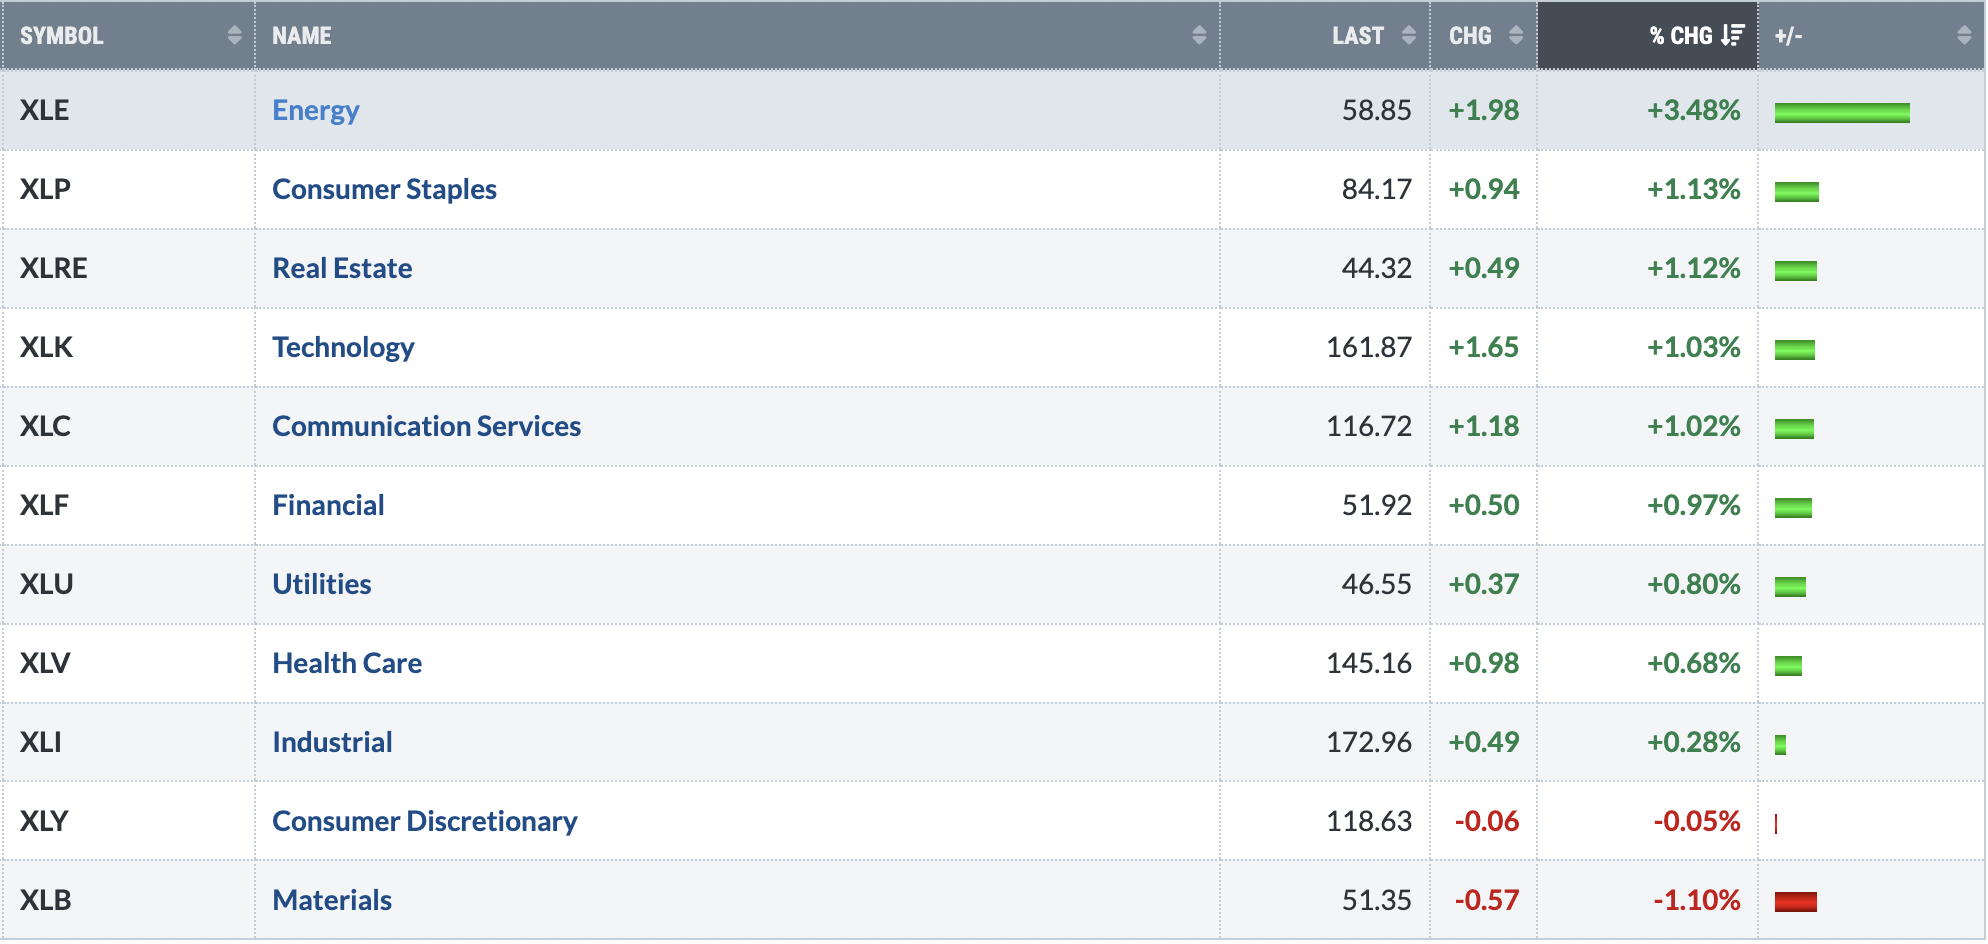
Sectors
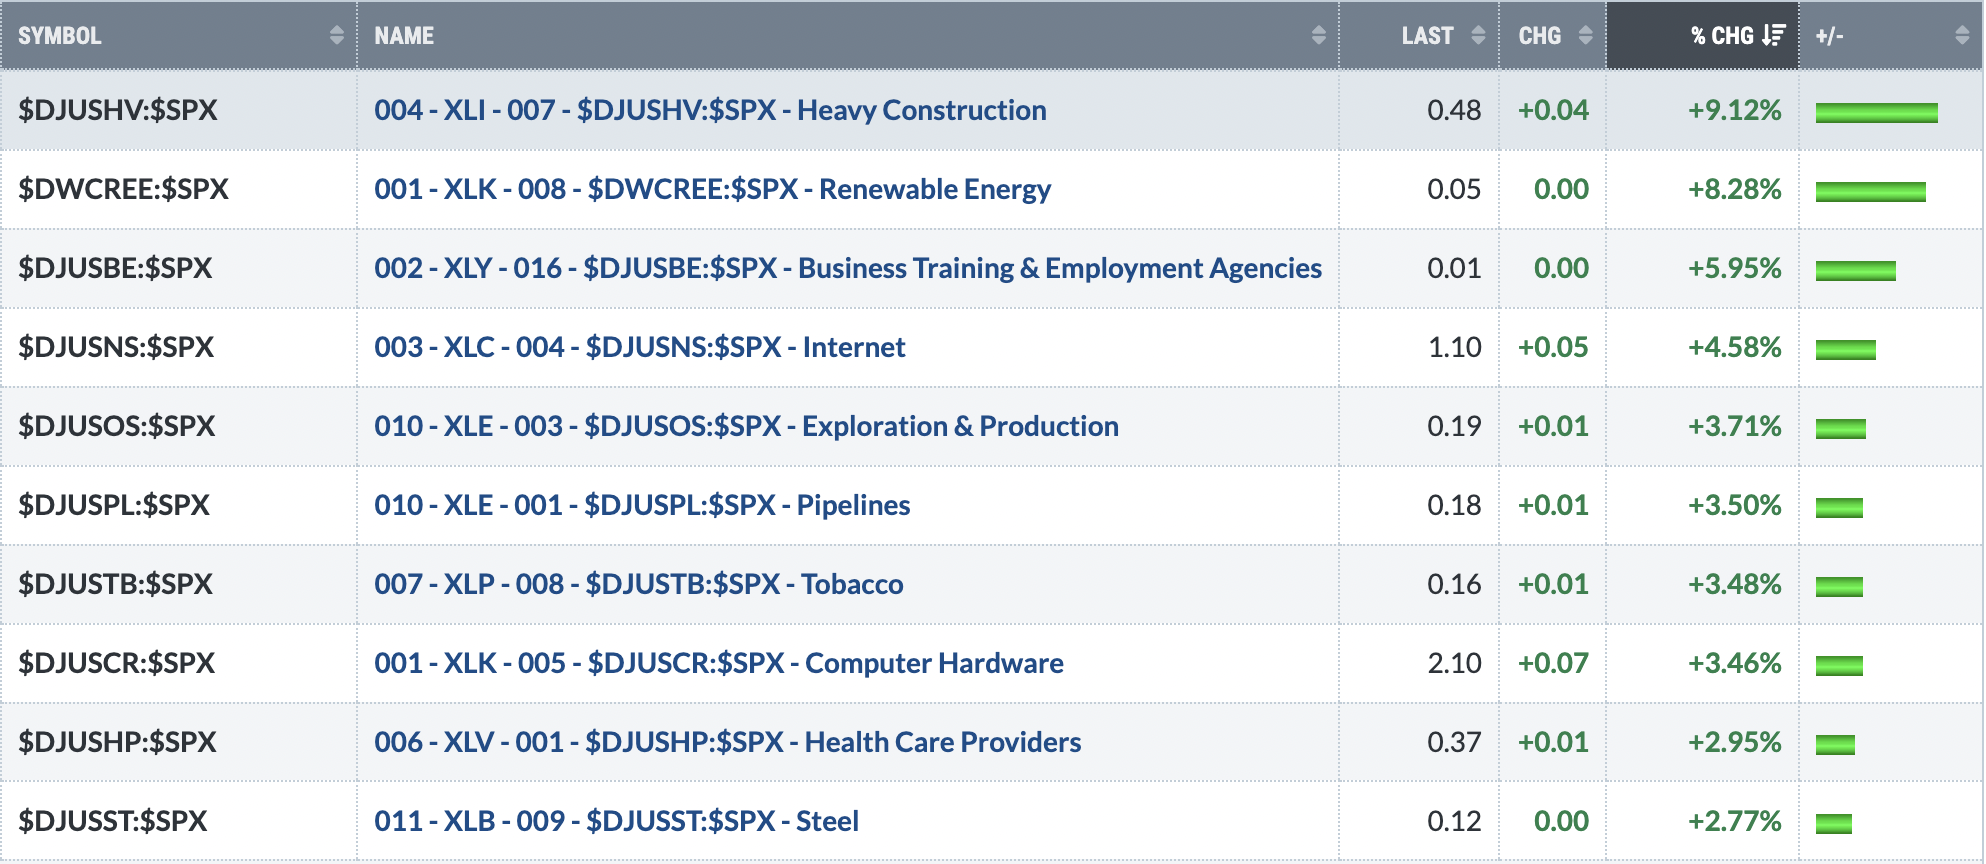
Top 10 Industries Last Week
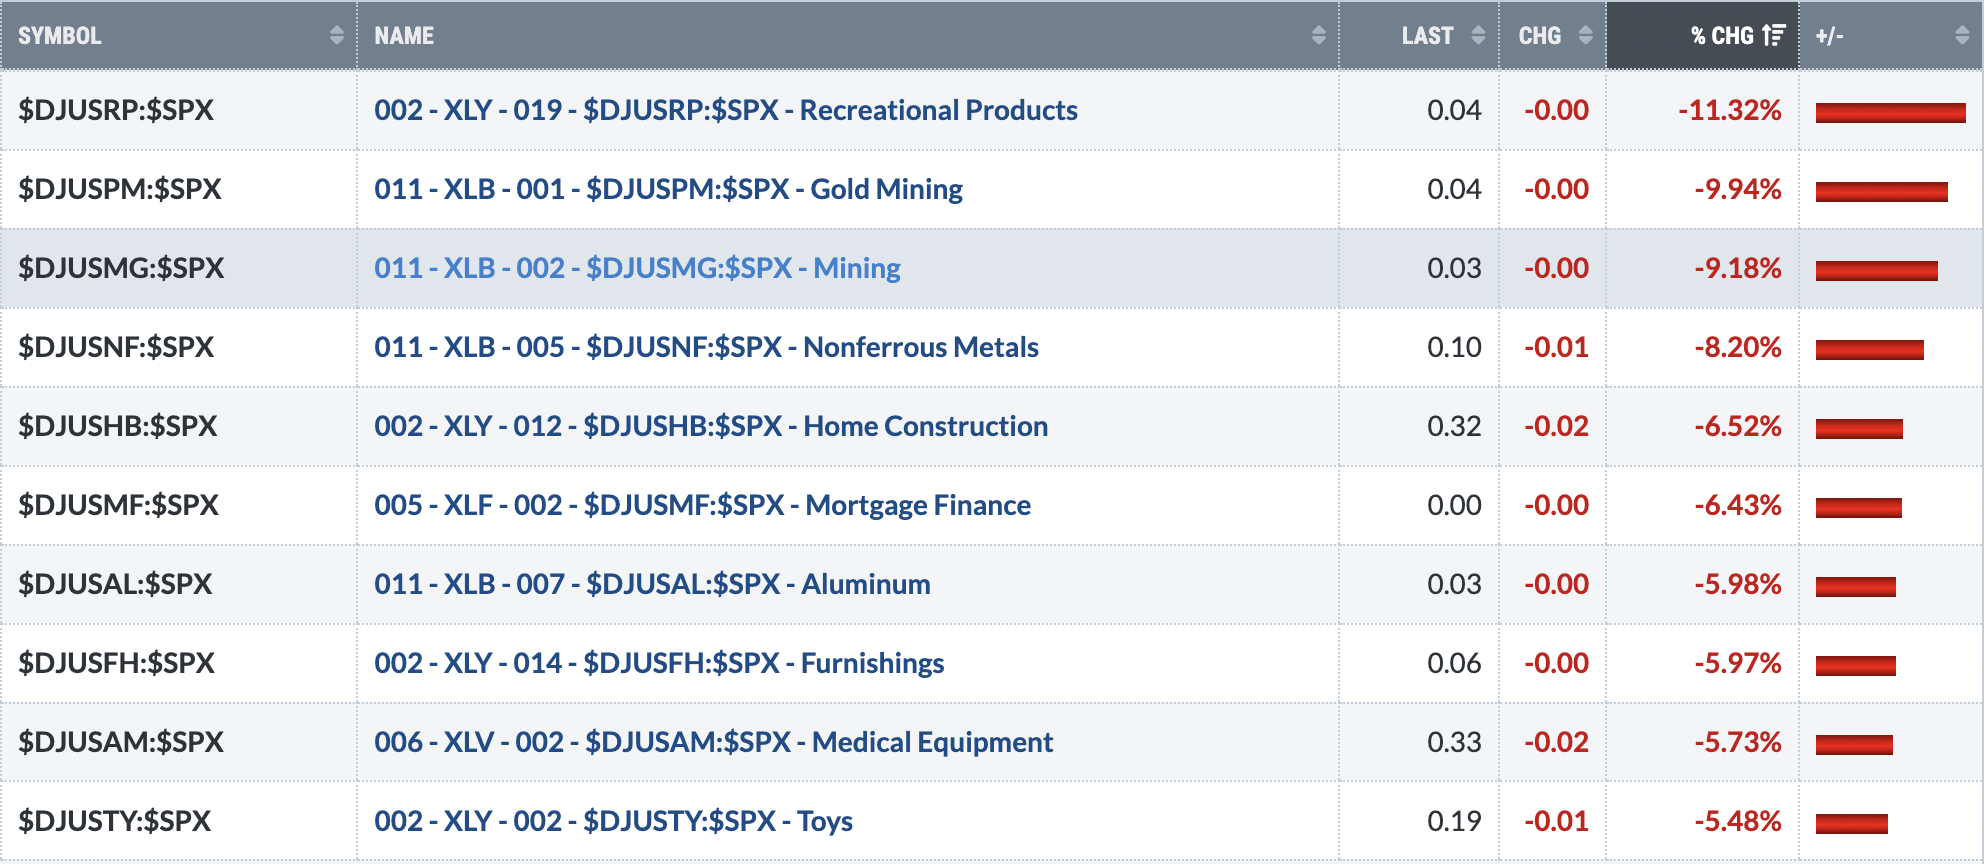
Bottom 10 Industries Last Week
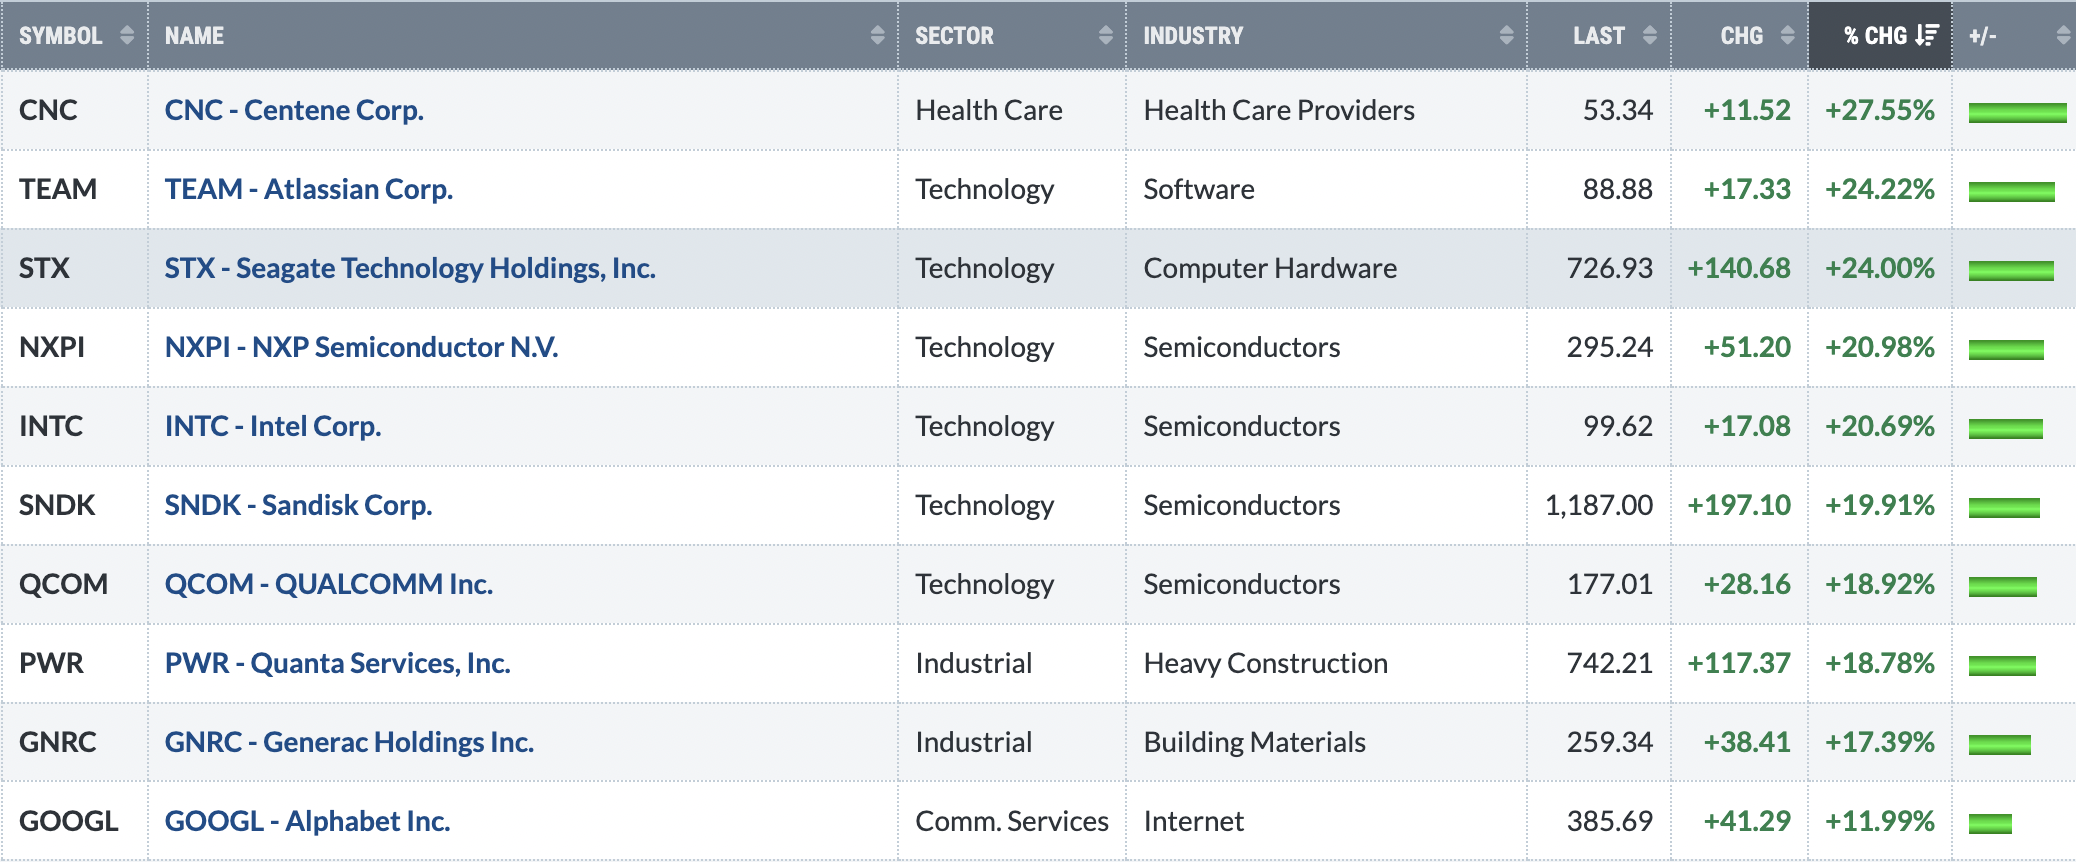
Top 10 Stocks - S&P 500/NASDAQ 100
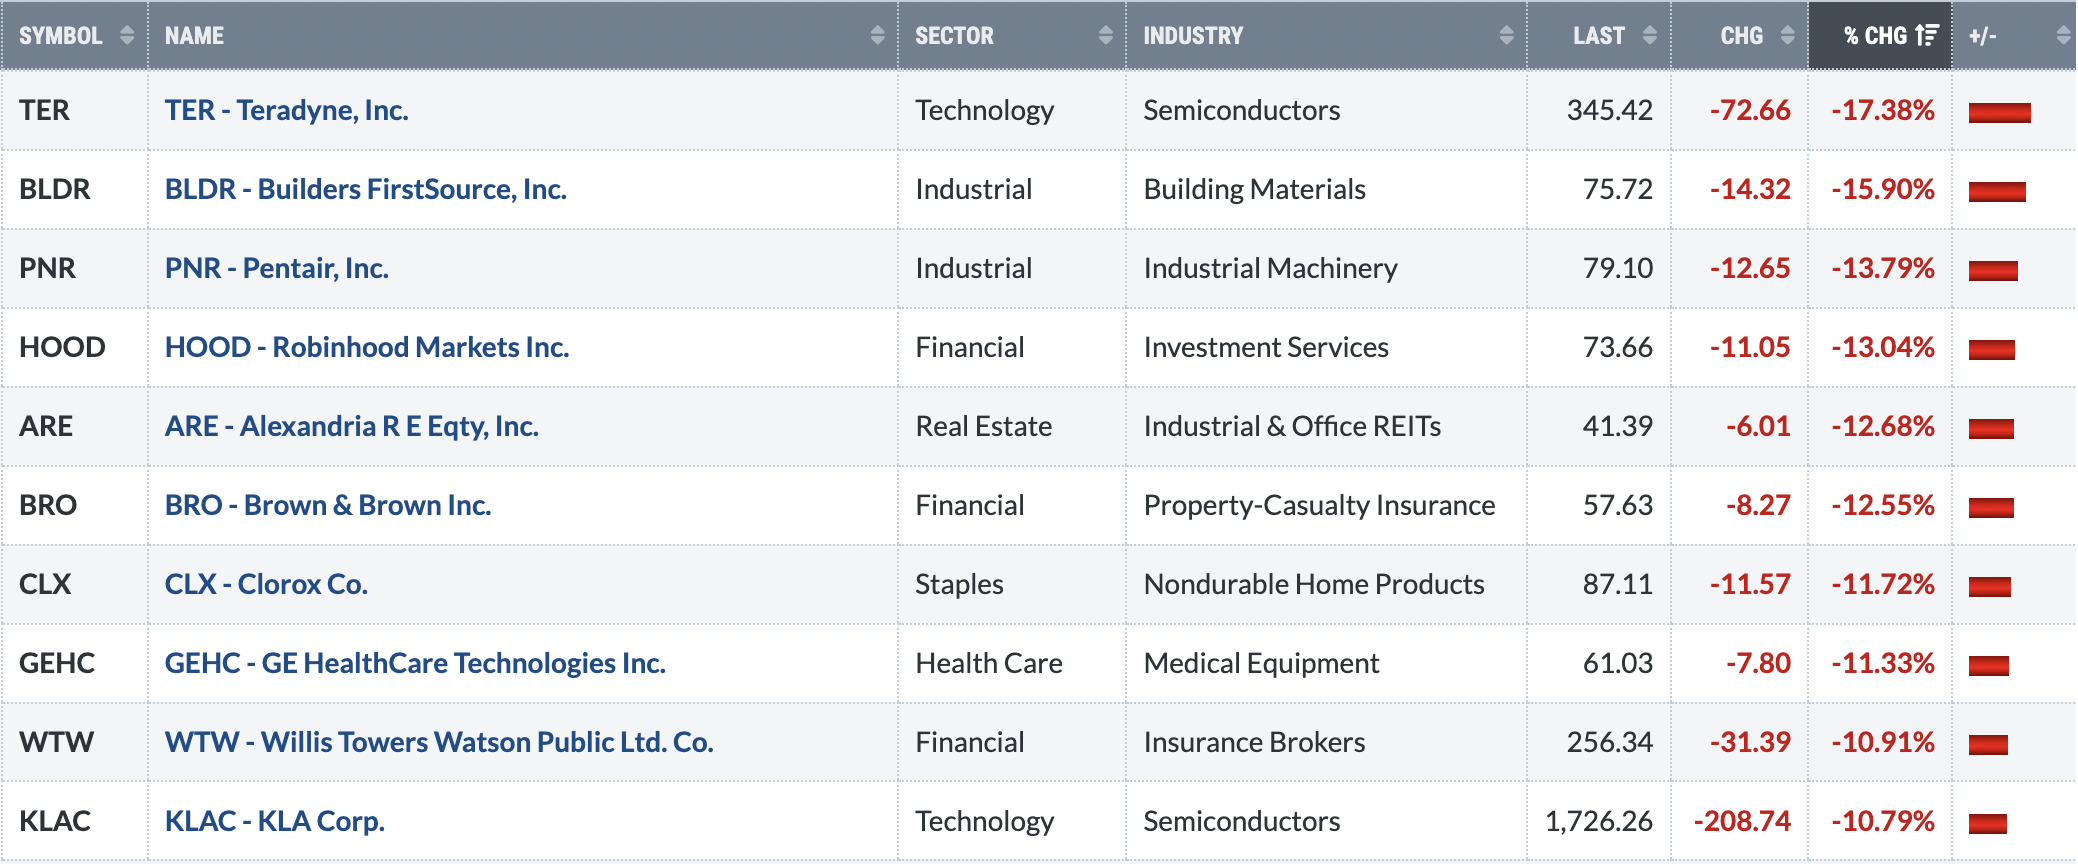
Bottom 10 Stocks - S&P 500/NASDAQ 100
Big Picture
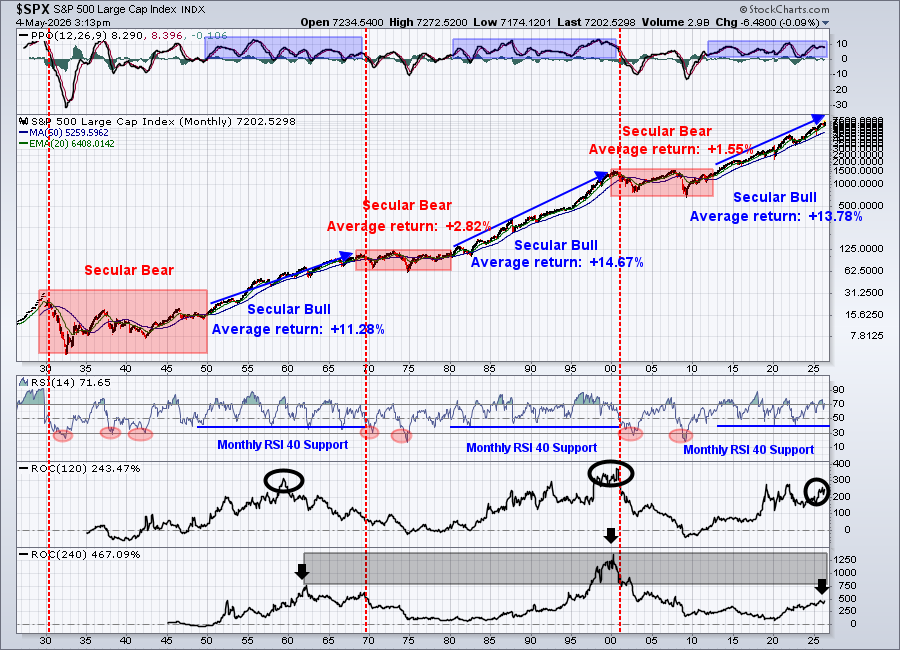
The secular bull market is back in cruise control. Last week, the S&P 500 set new all-time record highs on Monday, Thursday, and Friday. The Dow Jones, S&P 400 Mid Cap, and Russell 2000 Small Cap indices all pulled back earlier in the week to either approach or test key gap support and/or rising 20-day EMAs, but then rallied into the end of the week.
AD lines are strong on the S&P 500 and NASDAQ 100, but are certainly more challenged on the mid cap and small cap indices. This could be an indication that Wall Street once again is preferring larger cap stocks, but I think it's too early to make that call.
Sustainability Ratios
Here's the latest look at our key intraday ratios as we follow where the money is traveling on an INTRADAY basis (ignoring gaps):
QQQ:SPY
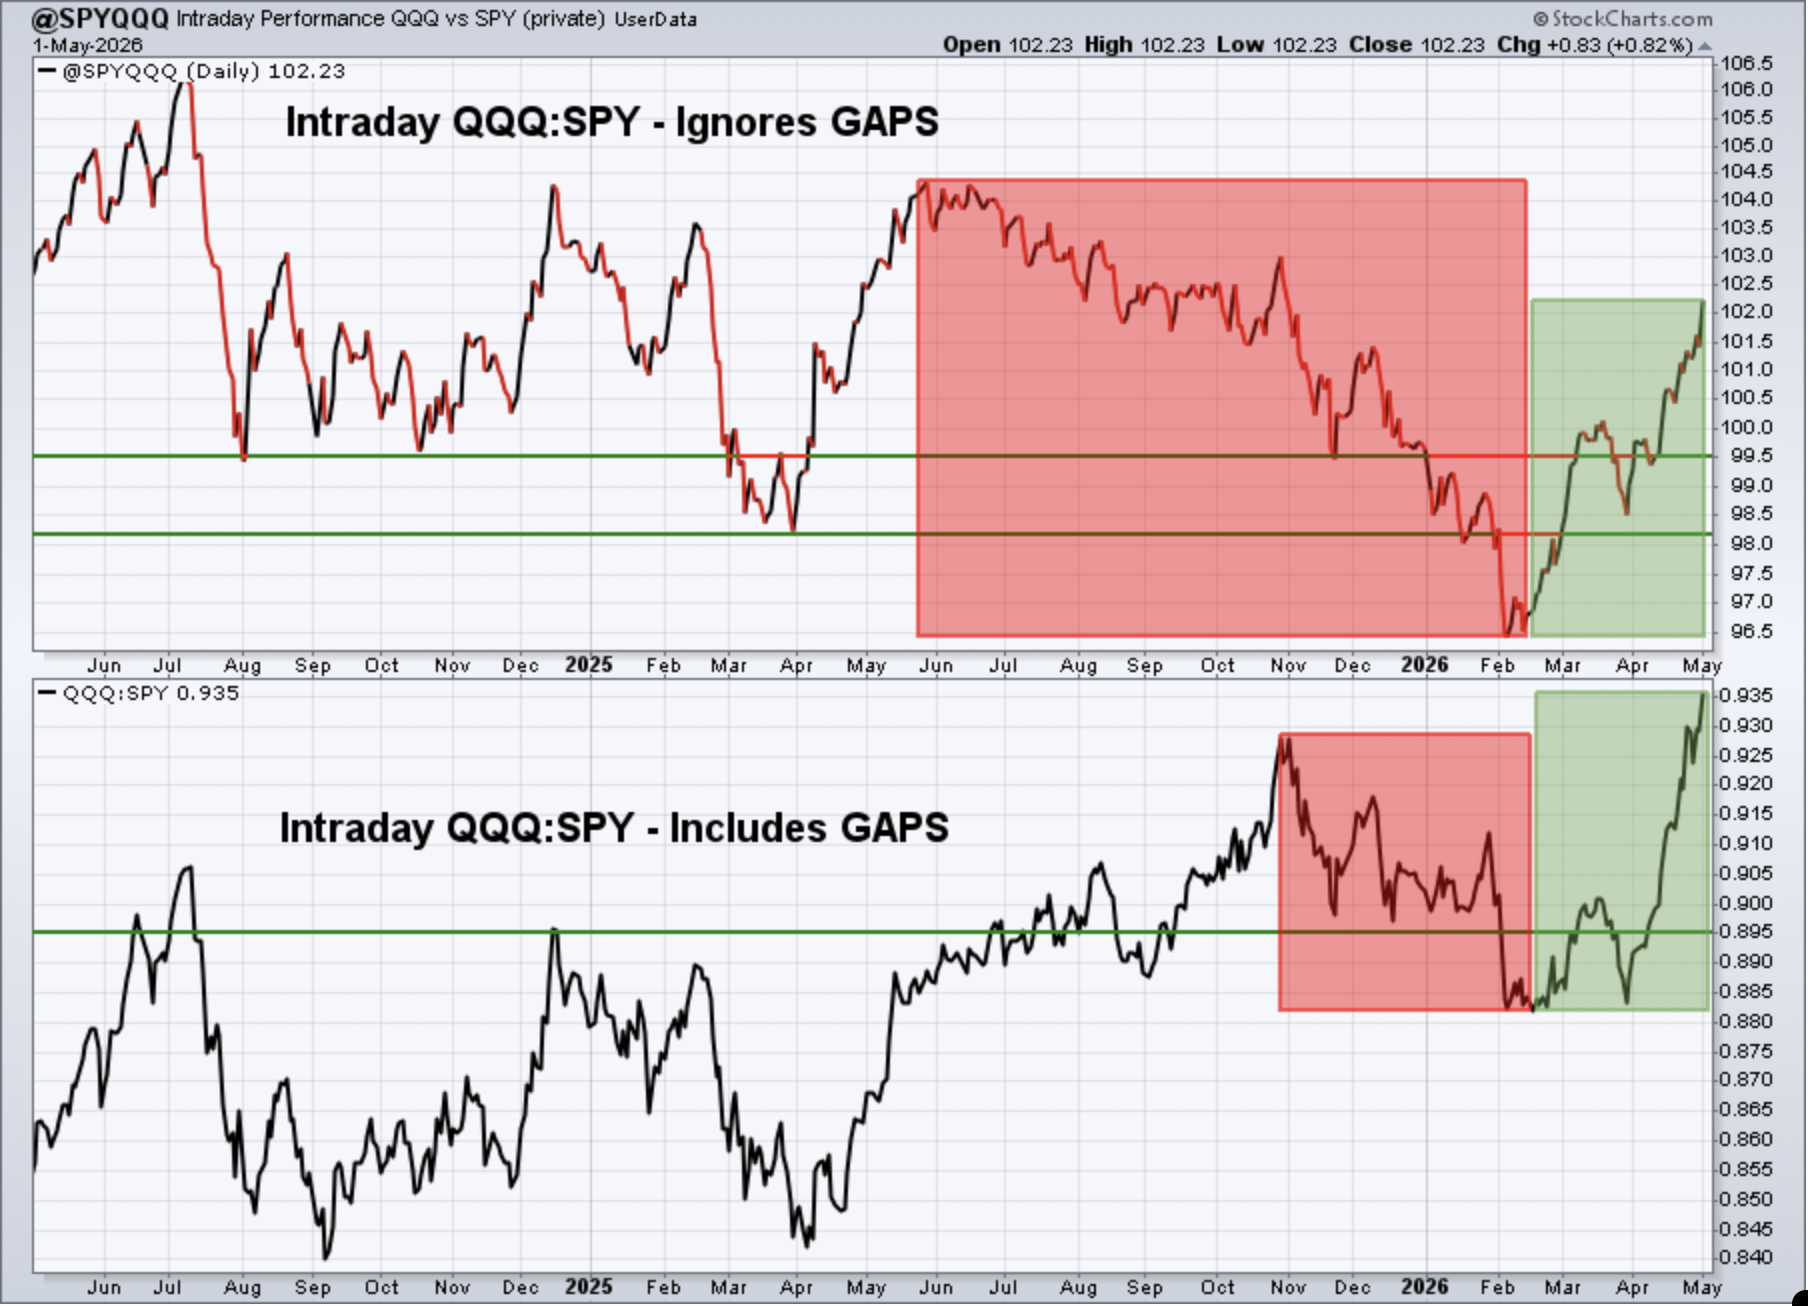
Keep in mind that the intraday analysis provided is a "work in progress". I continue to analyze this data to see if it helps provide us clues about calling market direction. It makes common sense to me that it should help in some sense, but it'll require a much longer-term study to determine its worth.
This ratio soared again last week, underscoring the rapid rotation into more growth-oriented areas, particularly semiconductors. Semiconductors represent 29.69% and 16.67% of the NASDAQ 100 and S&P 500, respectively. So when that group is rallying, like it is now, the QQQ vs. SPY ratio will do exactly what it's doing now - moving higher.
IWM:QQQ
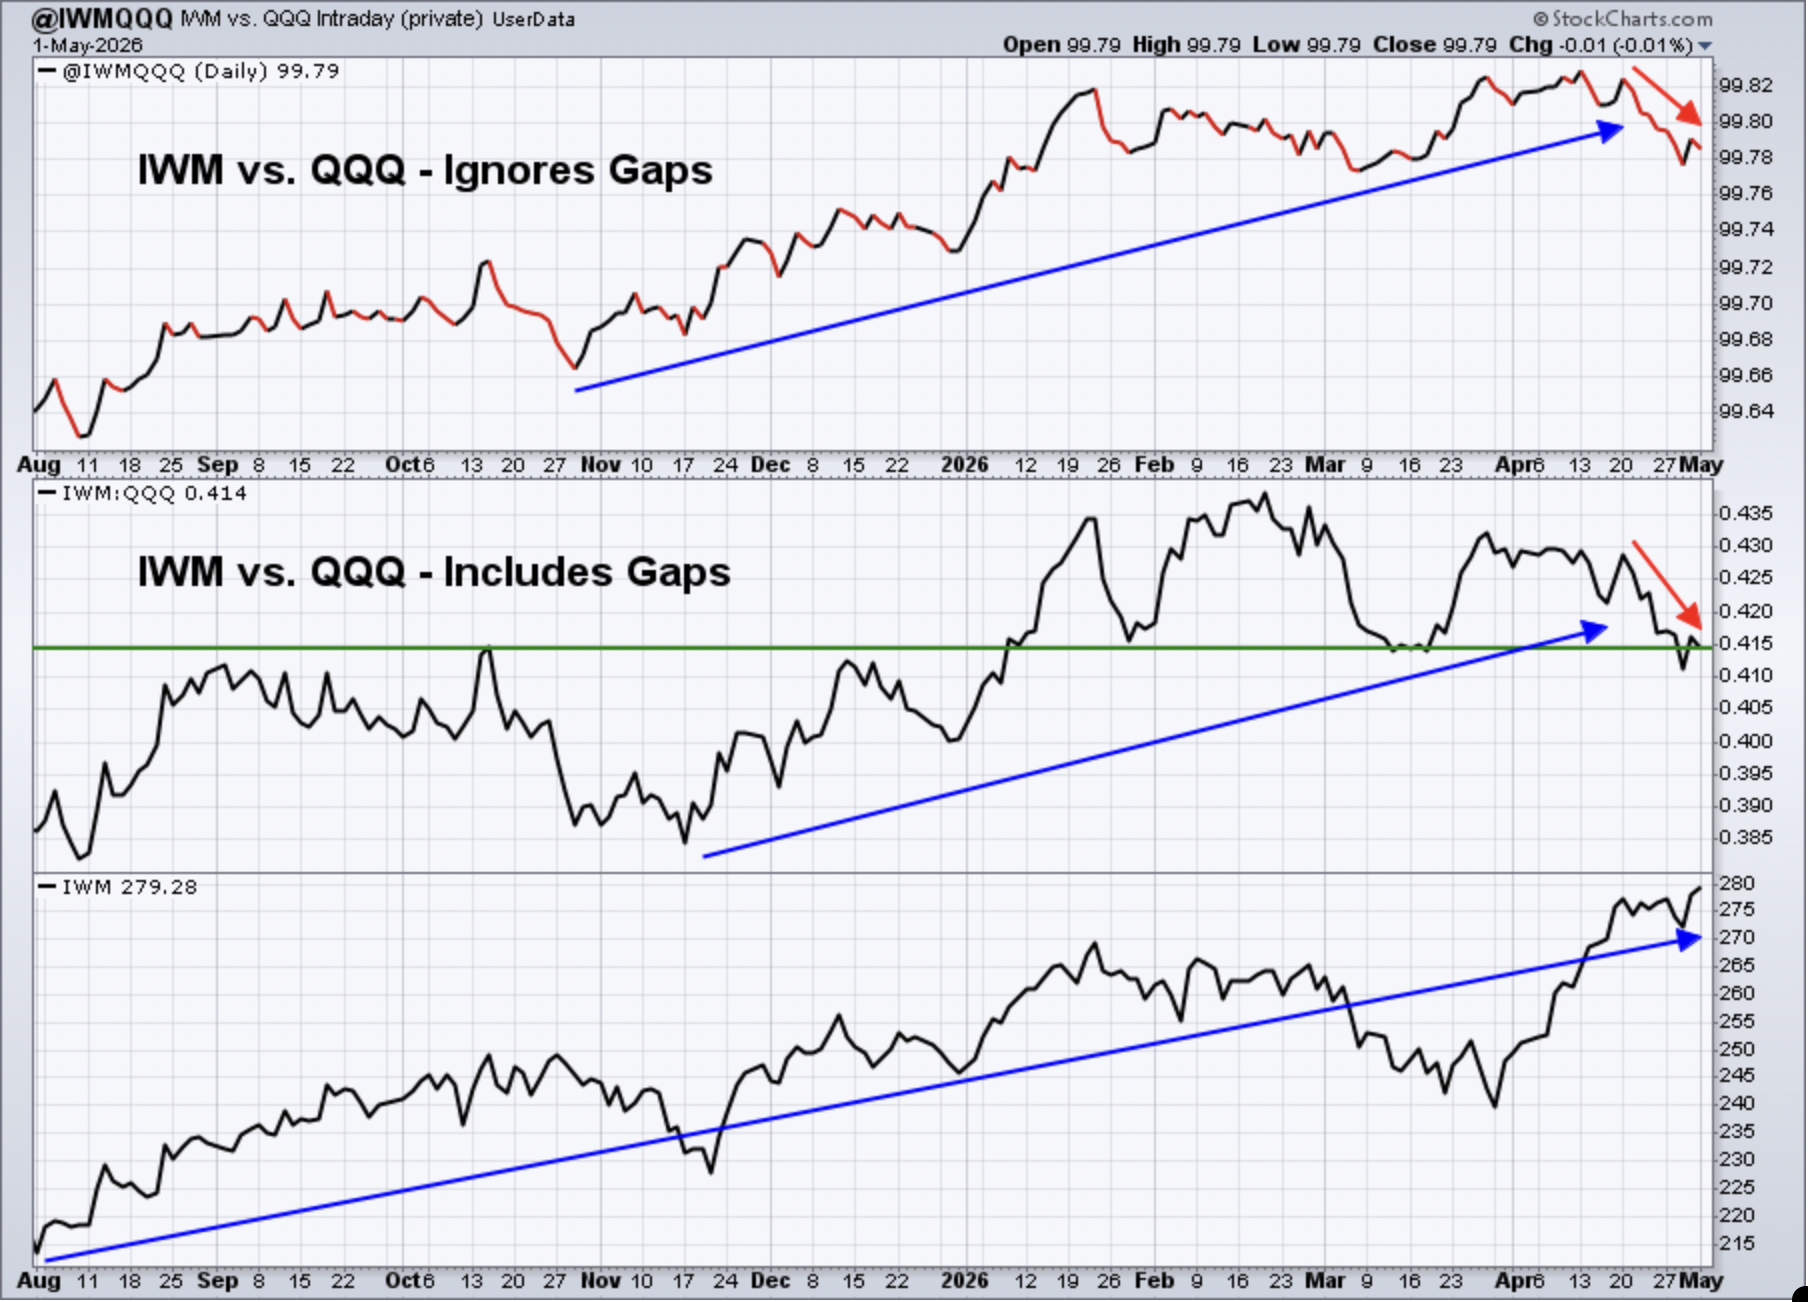
IWM is also setting new all-time record highs, but its relative strength vs. the QQQ has been suffering, again mostly the result of such a strong semiconductor space, which only accounts for 3.44% of the small cap IWM.
XLY:XLP
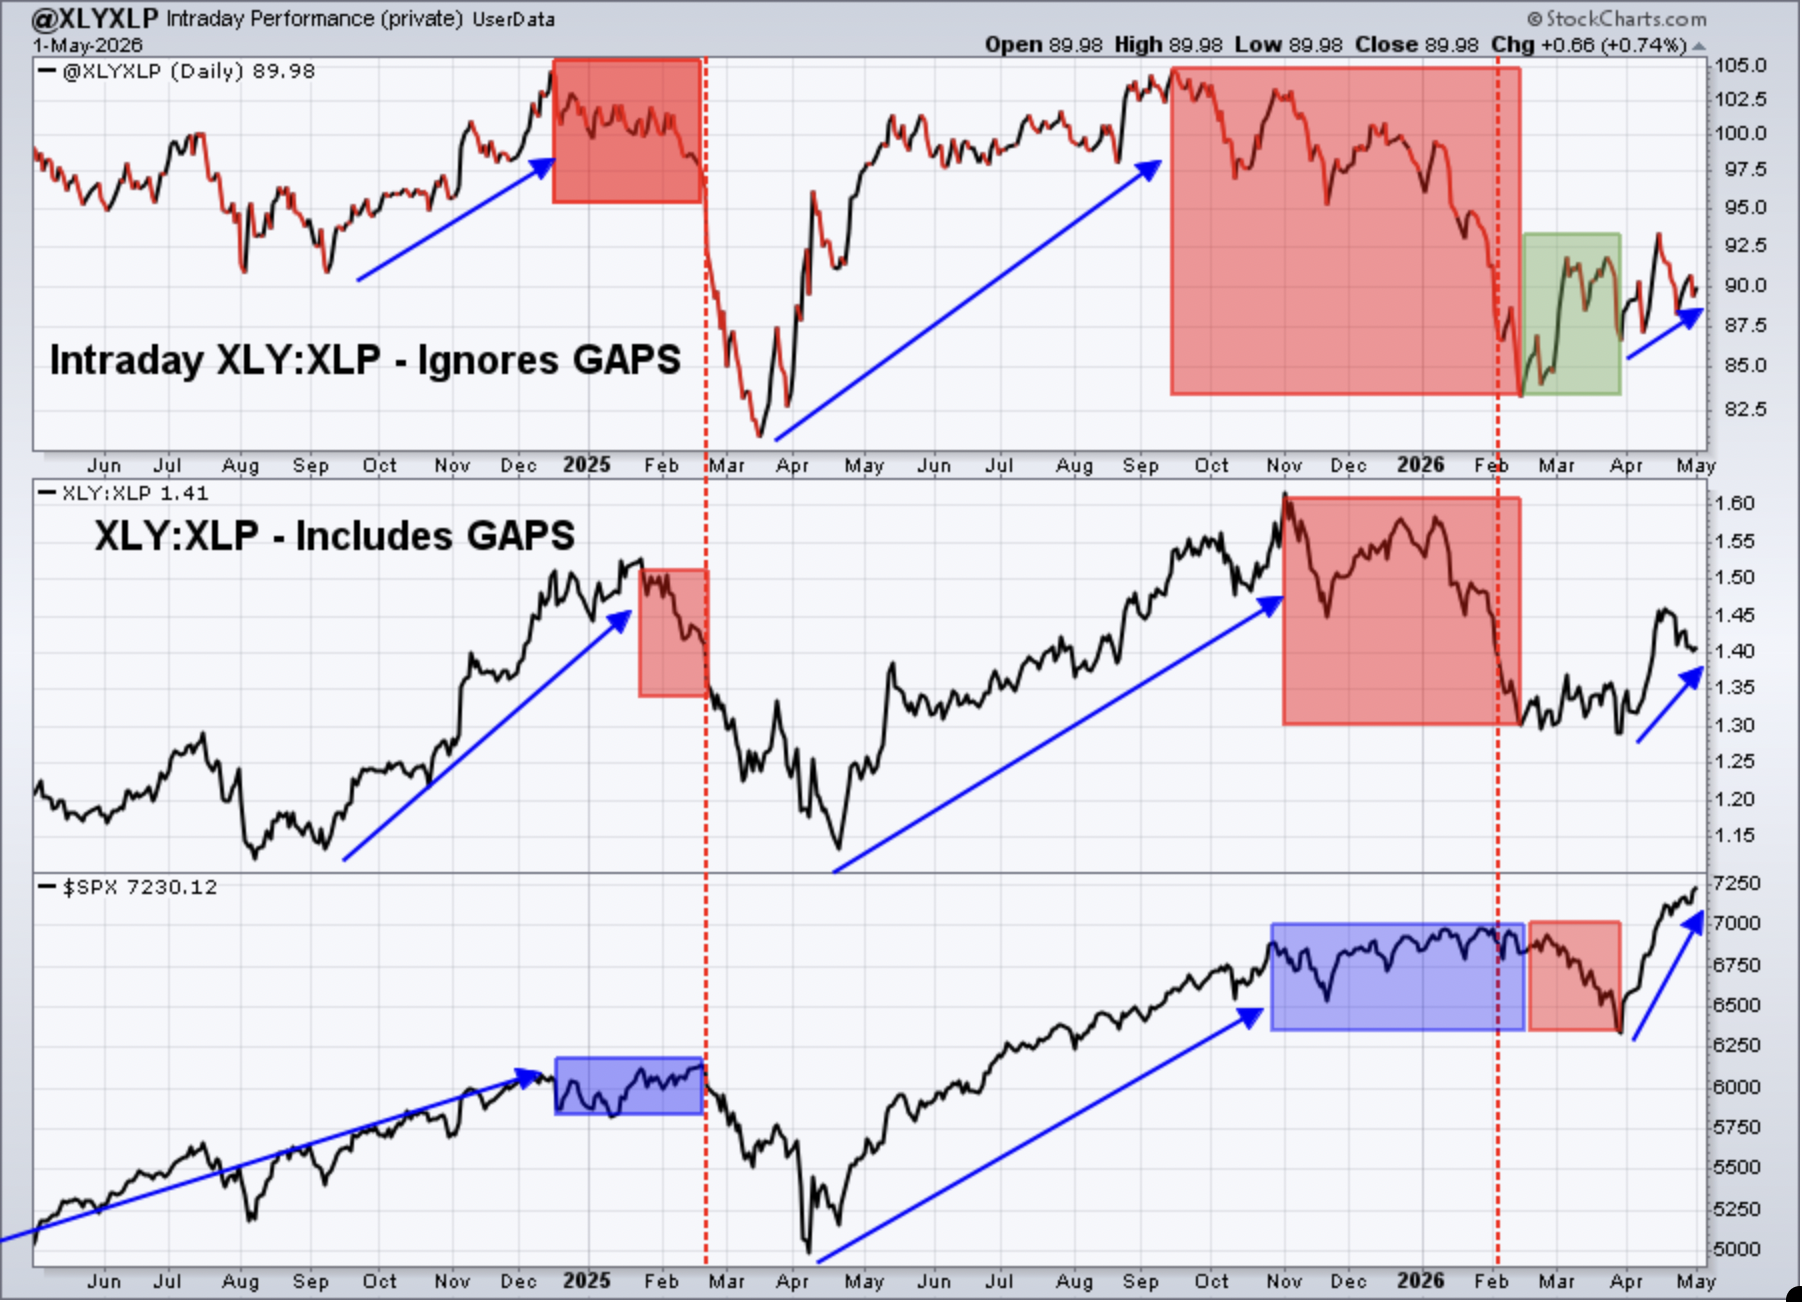
Since I've been tracking the intraday performance of these ratios, one thing I've learned is to pay attention when the intraday XLY vs XLP ratio declines, while the S&P 500 rises. That can be a powerful warning sign, which makes perfect sense. The opposite is also true, however. When the S&P 500 is declining, but money rotates towards the XLY vs. the XLP, it very well could be a signal that the bottom has already been seen or that it's rapidly approaching. Hindsight is 20/20, but the strength in the intraday XLY:XLP ratio during March proved to be a very pivotal signal that I should have acted upon earlier. I continue to research and continue to learn. The market is fascinating.
Sentiment
5-day SMA ($CPCE)
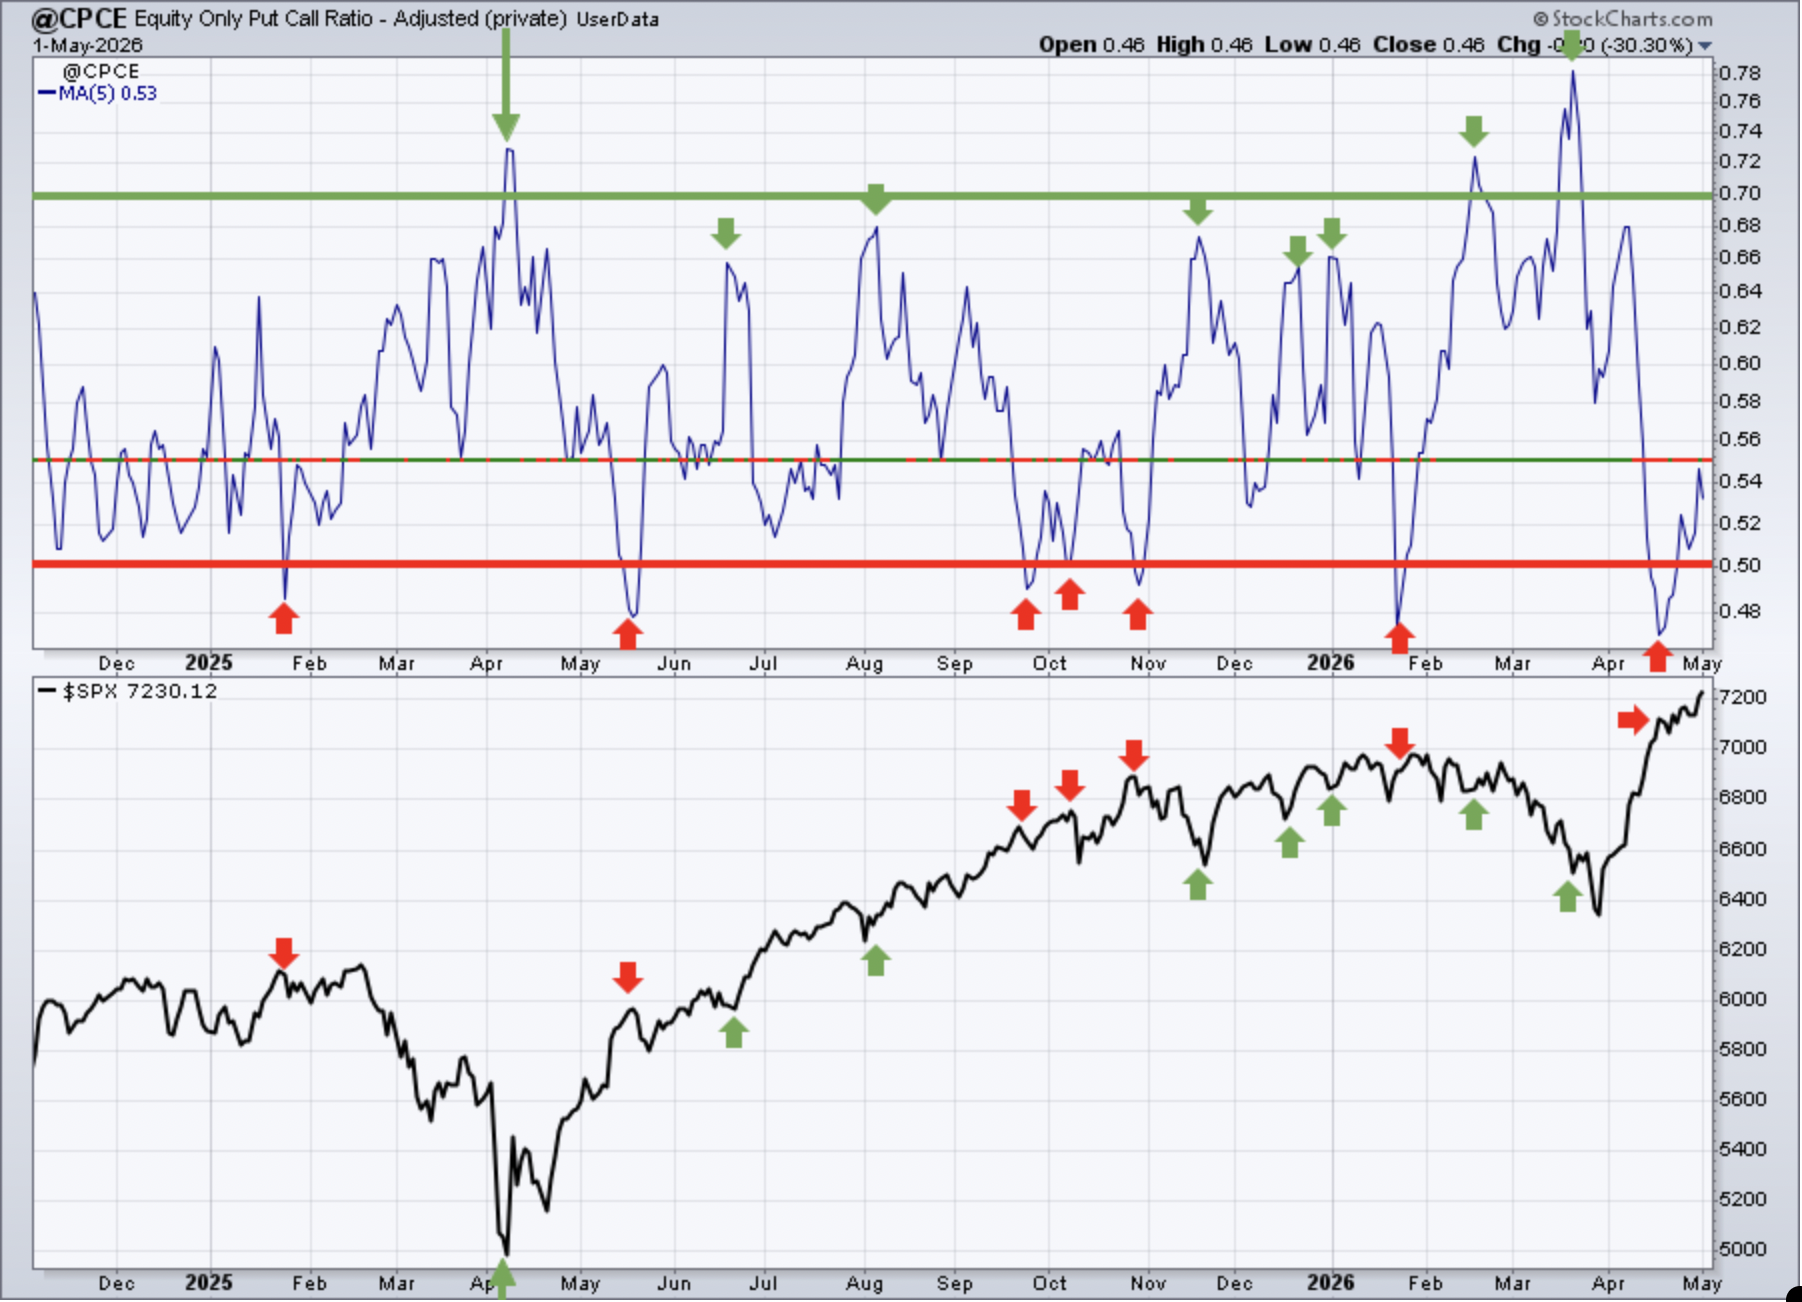
Sentiment indicators are contrarian indicators. When they show extreme bullishness, we need to be a bit cautious and when they show extreme pessimism, it could be time to become much more aggressive. Major market bottoms are carved out when pessimism is at its absolute highest level.
It was very odd, but the most recent low in the 5-day CPCE did not provide any sort of short-term top. We almost always see at least a 2%-3% drop when this 5-day moving average reached the .47-.48 level. Not this time, though. Now the ratio has bounced back up into neutral territory, so it's not really sending us any kind of signal at this time.
253-day SMA ($CPCE)
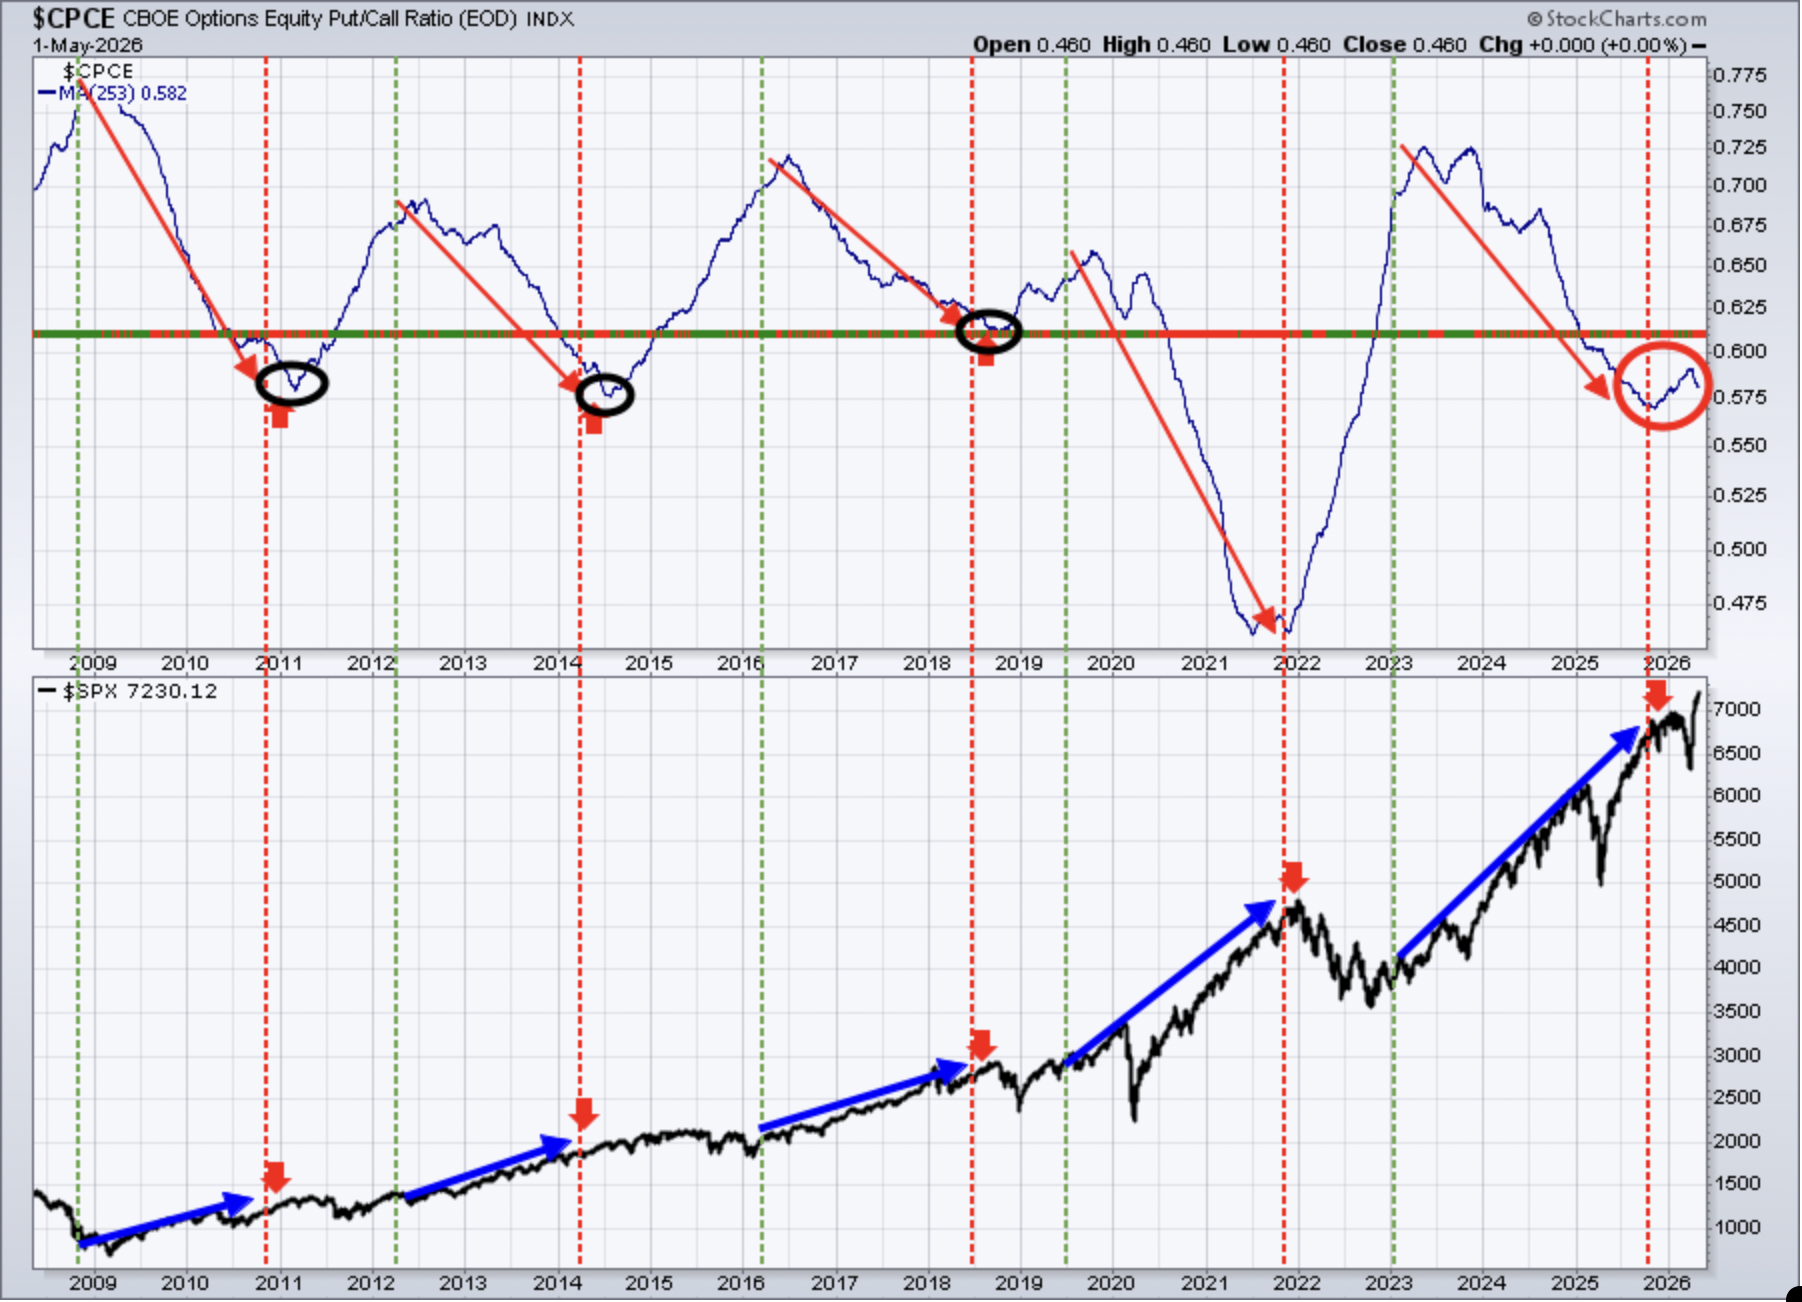
This longer-term 253-day SMA of the CPCE is our "ocean-liner" signal, unlike our short-term speedboat indicator. Any significant change in direction in this 253-day CPCE, in the past, has had profound effects on the S&P 500.
The rolling over of this 253-day CPCE is a potential indication that the S&P 500 will simply ride the top of its channel higher throughout 2026. Should the Volatility Index ($VIX) drop further down into the 15-16 range, or lower, that would be another indication of the S&P 500 riding that channel higher.
Long-Term Trade Setups
Since beginning this Weekly Market Report in September 2023, I've discussed the long-term trade candidates below that I really like. Generally, these stocks have excellent long-term track records, and many pay nice dividends that mostly grow every year. Only in specific cases (exceptions) would I consider a long-term entry into a stock that has a poor or limited long-term track record and/or pays no dividends. I try to review the long-term picture once a month, and it's been about a month, so let's take another look:
- JPM – has consolidated with the entire banking industry, still looks solid
- BA – 275 remains the long-term obstacle, now trending above 20-month EMA
- FFIV – trending up above its 20-month EMA
- MA – last week's high pierced 20-week EMA, but was false breakout
- GS – very extended, remains strong relative to its investment services peers
- FDX – set new all-time high, but AMZN just announced competing service
- AAPL –strengthening on weekly chart, needs to clear 288.35
- CHRW – pulling back and consolidating after doubling in 6 months
- JBHT –nice breakout in 2026 after 3-4 years of consolidation
- STX - simply amazing run since April 2025 low, seems no end in sight
- HSY - very disappointing failure to hold onto 200 price support
- DIS - been waiting on this one for awhile, needs to hold 77-80 support
- MSCI - 4+ years of consolidation continues after prior rapid ascent
- SBUX - short-term breakout near 100, now staring at major 115 resistance
- KRE – still looks great in the long-term, awaiting lower interest rates
- ED – retesting recent breakout near the 110 level; 17-year uptrend intact
- AJG - year-long downtrend remains in place, watch 194.41 price support
- NSC – cup with handle breakout in mid-2025, measurement to 360 or so
- RHI – support in 22-23 range now established and needs to hold
- ADM – remains in solid uptrend off April 2025 low
- BG – breakout in January 2026 has led to further gains, nice uptrend
- CVS – big rally off 20-month EMA support, key resistance near 95
- HRL - weak stock, but it is a dividend aristocrat (raising dividends for 25 yrs+)
- DE – trending up, but continues to significantly underperform CAT
- LULU - will the bleeding stop at the 2020 pandemic low of 128.84?
- TTD - software is rebounding, but TTD's relative strength remains weak
- META - big gap lower last week with earnings, gap support is 606
- ADBE - bouncing with software rebound, key initial resistance at 259
- KMB - another dividend aristocrat, with solid price support at 95
- ORCL - added most recently and it's soared, leading April software rebound
We are going to add a company this week in the health care (XLV) area. AbbVie, Inc. (ABBV), which has steadily grown since its initial public offering (IPO) in 2010. It's also raised its dividend 54 years in a row, according to dividend.com. Its monthly RSI rarely hits 50, but it's now down to 55, so we think it's a solid entry opportunity. The recent price decline has raised its dividend yield to 3.27%, which is excellent given the company's long-term track record for growth as well. And because it's raised its dividend for 54 straight years, the 3.27% yield only goes higher. Here's the long-term monthly chart, which shows ABBV is a very steady climber among biotech stocks:
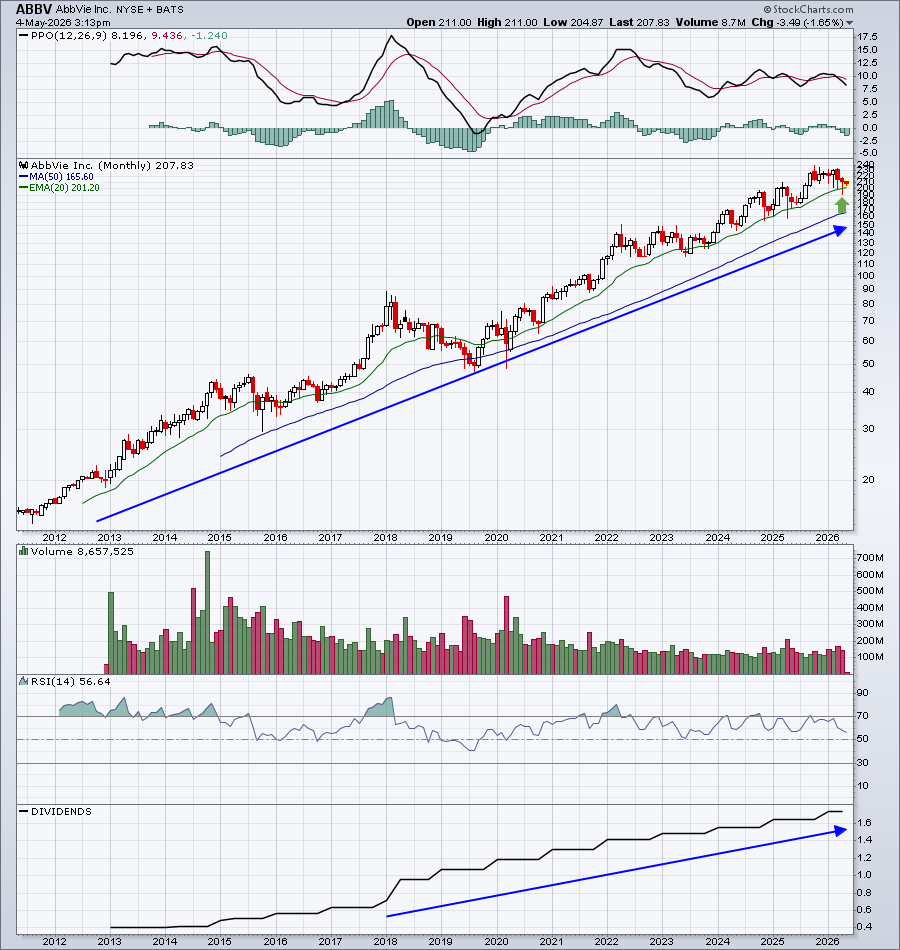
Keep in mind that our Weekly Market Reports favor those who are more interested in the long-term market picture. Therefore, the list of stocks above are stocks that we believe are safer (but nothing is ever 100% safe) to own with the long-term in mind. Nearly everything else we do at EarningsBeats.com favors short-term momentum trading, so I wanted to explain what we're doing with this list and why it's different.
Also, please keep in mind that I'm not a Registered Investment Advisor (and neither is EarningsBeats.com nor any of its employees) and am only providing (mostly) what I believe to be solid dividend-paying stocks for the long term. Companies periodically go through adjustments, new competition, restructuring, management changes, etc. that can have detrimental long-term impacts. Neither the stock price nor the dividend is ever guaranteed. I simply point out interesting stock candidates for longer-term investors. Do your own due diligence and please consult with your financial advisor before making any purchases or sales of securities.
Looking Ahead
Upcoming Earnings
The following list of companies is NOT a list of all companies scheduled to report quarterly earnings, however, just key reports, so please be sure to check for earnings dates of any companies that you own. Any company in BOLD represents a stock in one of our portfolios and the amount in parenthesis represents the market capitalization of each company listed:
- Monday: PLTR ($333 billion), VRTX ($109 billion), WMB ($93 billion)
- Tuesday: AMD ($578 billion), ANET ($217 billion), SHOP ($158 billion), PFE ($152 billion)
- Wednesday: ARM ($222 billion), DIS ($184 billion), UBER ($152 billion), APP ($151 billion)
- Thursday: MCD ($209 billion), GILD ($162 billion), HWM ($97 billion), ABNB ($85 billion), NET ($72 billion)
- Friday: ENB ($121 billion)
Key Economic Reports
- Monday: March factory orders
- Tuesday: March JOLTS, February new home sales (delayed), March new home sales, April PMI services, April ISM services
- Wednesday: April ADP employment report
- Thursday: Initial jobless claims, Q1 productivity, February construction spending (delayed), March construction spending
- Friday: April nonfarm payrolls, unemployment rate & hourly wages, May consumer sentiment, March wholesale inventories
Historical Data
I'm a true stock market historian. I am absolutely PASSIONATE about studying stock market history to provide us more clues about likely stock market direction and potential sectors/industries/stocks to trade. While I don't use history as a primary indicator, I'm always very aware of it as a secondary indicator. I love it when history lines up with my technical signals, providing me with much more confidence to make particular trades.
Below you'll find the next two weeks of historical data and tendencies across the three key indices that I follow most closely. The percentage for each calendar day represents the annualized return for that day. An example of how this is calculated is reflected next to the first day under the S&P 500 and in parenthesis:
S&P 500 (since 1950)
- May 4: +13.45% (Ex: cumulative gains = +2.82% over 53 trading days since 1950. +2.82% x 253/53 = +13.45%)
- May 5: +29.60%
- May 6: -40.87%
- May 7: -24.71%
- May 8: +58.63%
- May 9: -38.03%
- May 10: -12.55%
- May 11: -50.36%
- May 12: +33.97%
- May 13: -3.93%
- May 14: -16.65%
- May 15: +16.19%
- May 16: +13.32%
- May 17: -17.89%
NASDAQ (since 1971)
- May 4: +56.84%
- May 5: +50.73%
- May 6: -52.43%
- May 7: -54.36%
- May 8: +78.37%
- May 9: -49.25%
- May 10: -16.81%
- May 11: -19.11%
- May 12: +60.47%
- May 13: -3.74%
- May 14: +22.26%
- May 15: +41.32%
- May 16: +51.21%
- May 17: -36.53%
Russell 2000 (since 1987)
- May 4: +71.17%
- May 5: +8.54%
- May 6: -67.31%
- May 7: -86.71%
- May 8: +67.46
- May 9: -25.83%
- May 10: -4.79%
- May 11: -50.24%
- May 12: +0.45%
- May 13: -77.11%
- May 14: +20.69%
- May 15: +37.87%
- May 16: +13.08%
- May 17: -22.47%
The S&P 500 data dates back to 1950, while the NASDAQ and Russell 2000 information date back to 1971 and 1987, respectively.
Final Thoughts
All of our major indices are in extended uptrends as the current secular bull market prevails once again. Many bears keep trying to bet against it, which I believe is a disastrous approach over the long haul. Sure, we have pullbacks from time to time, even cyclical bear markets, but overwhelming evidence points to higher prices in time.
Yes, we have plenty of worries. We always do. But we also have historically-low interest rates and tremendous earnings growth and that's a recipe for a secular bull market. While we can take risks and bet against U.S. stocks from time to time in the short-term, I wouldn't do so in the long-term.
Here's what I'm thinking about in the week ahead:
Earnings. Earnings have been strong, thus far, but now we're going to hear from an increasing number of small and midsize software companies. Their earnings, and outlooks, will be scrutinized given the huge drop in that area of the market. Is it justified? We're about to get new evidence to evaluate just that. Palantir (PLTR) will be one to watch as it reports its latest earnings after the closing bell today. Shopify (SHOP), AppLovin (APP), and Cloudflare (NET) are three other large software players that report results on Tuesday, Wednesday, and Thursday, respectively.
Negative Divergences. I'm not worried about divergences in the long-term and current shorter-term divergences aren't present across all of our major indices. However, small caps (IWM) did just print a negative divergence on its daily chart, as did the Dow Jones (DIA). Daily divergences are growing a bit more suspicious on the S&P 500 and the S&P 400 Mid Cap Index ($MID) will print a negative divergence if it breaks to another new high.
Seasonality. I am currently working on the May Seasonality Report, which should be done by tomorrow. What I can tell you is that since this secular bull market was confirmed in 2013, technology (XLK) and communication services (XLC) have performed best, relative to the S&P 500, during the month of May. Semiconductors ($DJUSSC), renewable energy ($DWCREE), and internet ($DJUSNS). Defensive sectors, energy, and materials have historically performed very poorly in May. Keep in mind this is what's happened in the past and certainly provides us no guarantees as we move forward. I'm just passing along historical tendencies. I'll have more on this, including individual stocks that historically perform well in May, in the May Seasonality Report.
May also has a tendency to be very strong in the first 5 days and the last week, but in between it can be challenging. I'll provide those numbers tomorrow as well.
Employment Report. If last week was Fed Week, then this week is Jobs Week. All eyes will be on Friday's nonfarm payrolls. After a very strong March payrolls number of 178,000, which came in well ahead of estimates, the April number is expected to drop back to 53,000. The "tug 'o war" between jobs reactions and inflation worries will get an added ingredient on Friday.
Happy trading!
Tom