
EB Weekly Market Report - Monday, June 8, 2026
ChartLists/Spreadsheets
The following ChartLists/Spreadsheets were updated last Thursday and have been updated on our website:
- Strong Earnings (SECL)
- Strong Future Earnings (SFECL)
- Raised Guidance (RGCL)
- Bullish Trifecta (BTCL)
- Short Squeeze (SSCL)
- Leading Stocks (LSCL)
- Matt's Hot Stocks (HTCL) - updated this morning
The above ChartLists and spreadsheet have been updated through Friday, June 5th. You can view and/or download these ChartLists from our website, and also read about them to gain a better understanding of how they can help in your trading success.
Weekly Market Recap
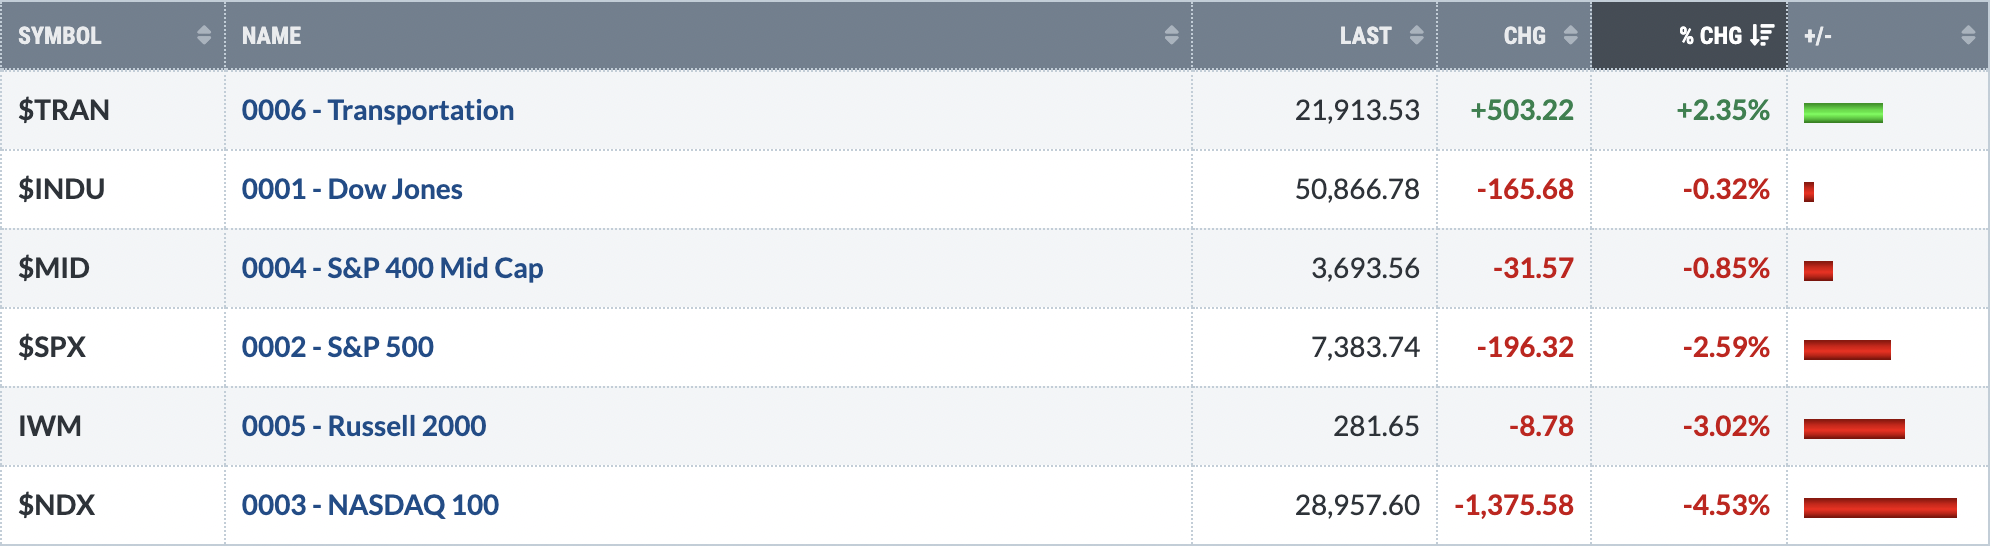
Major Indices
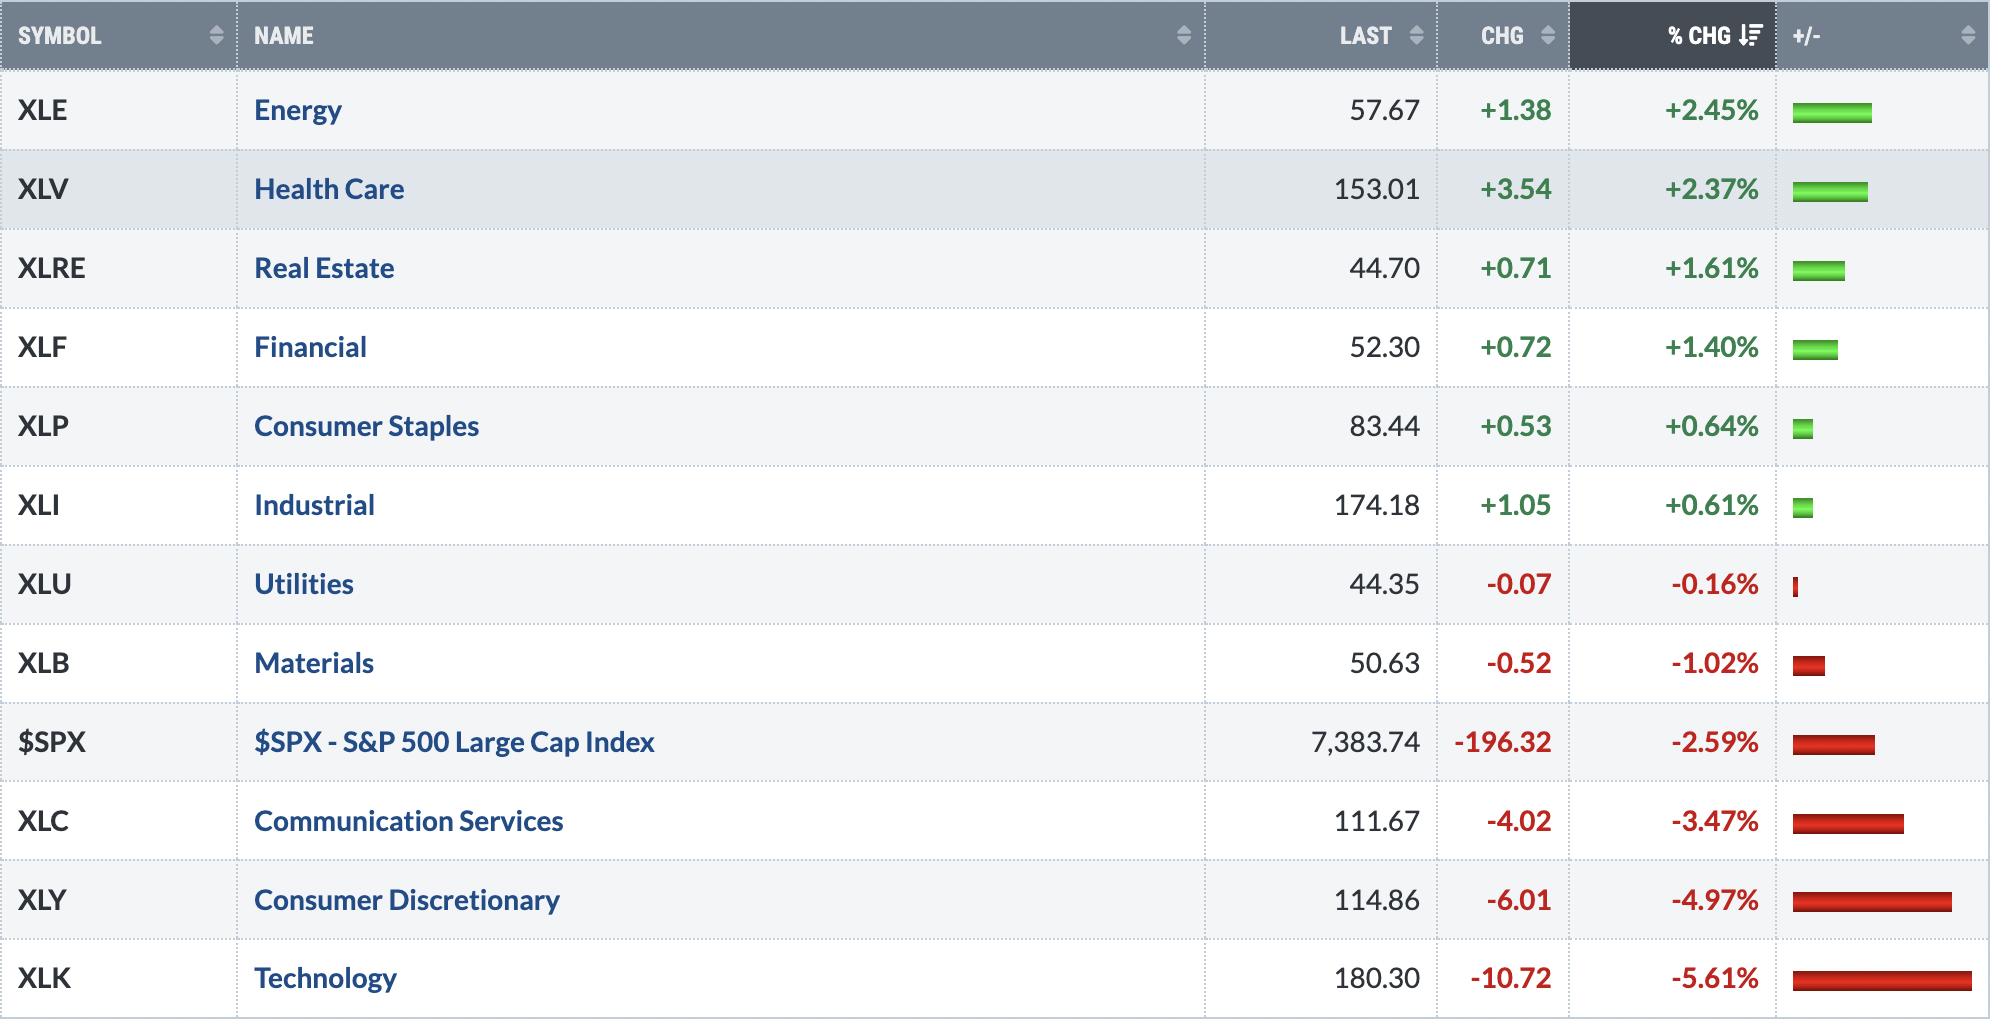
Sectors
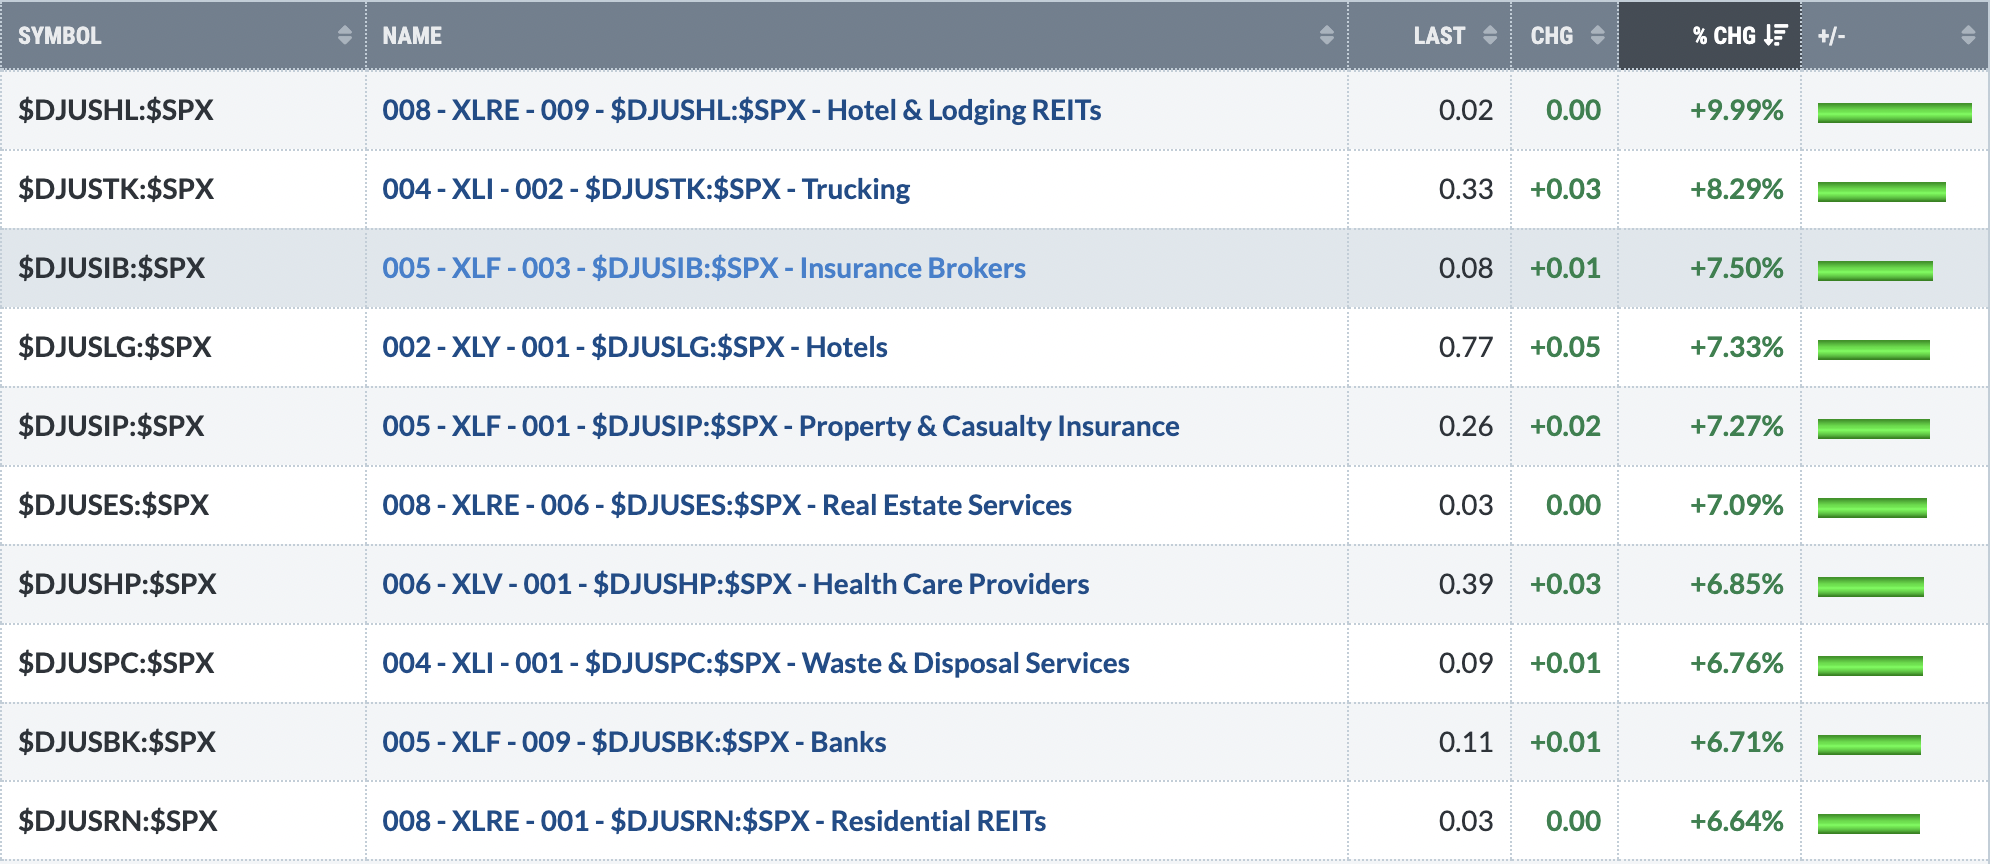
Top 10 Industries Last Week
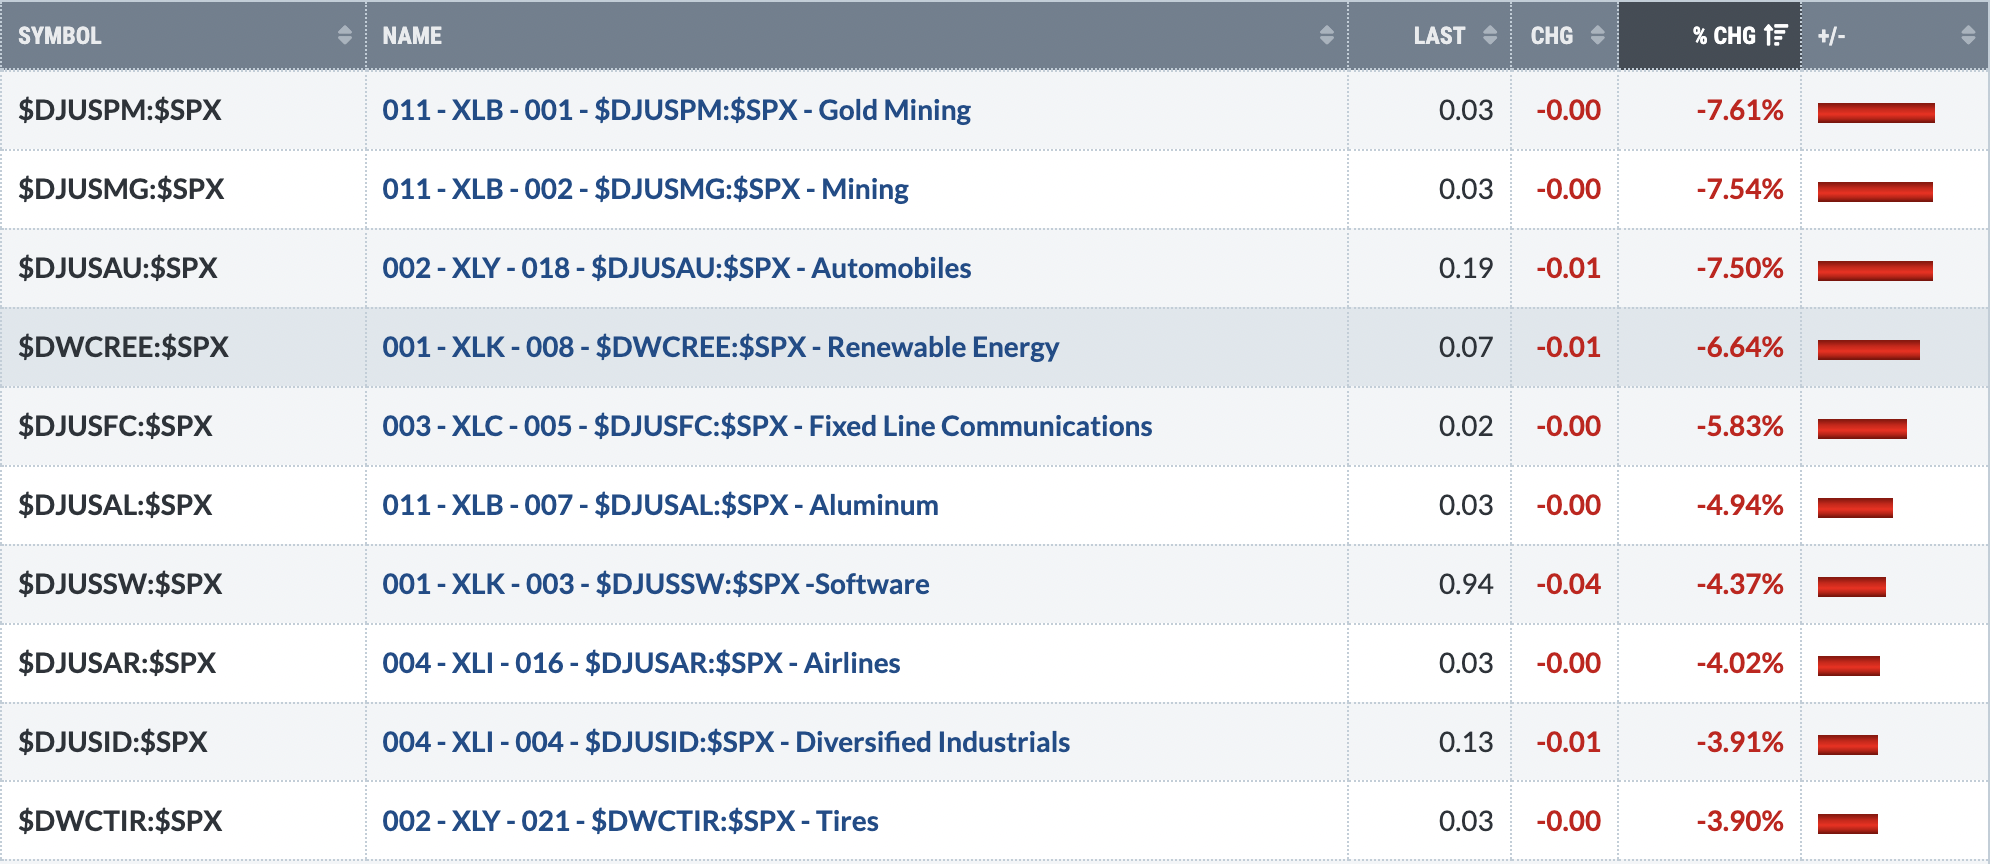
Bottom 10 Industries Last Week
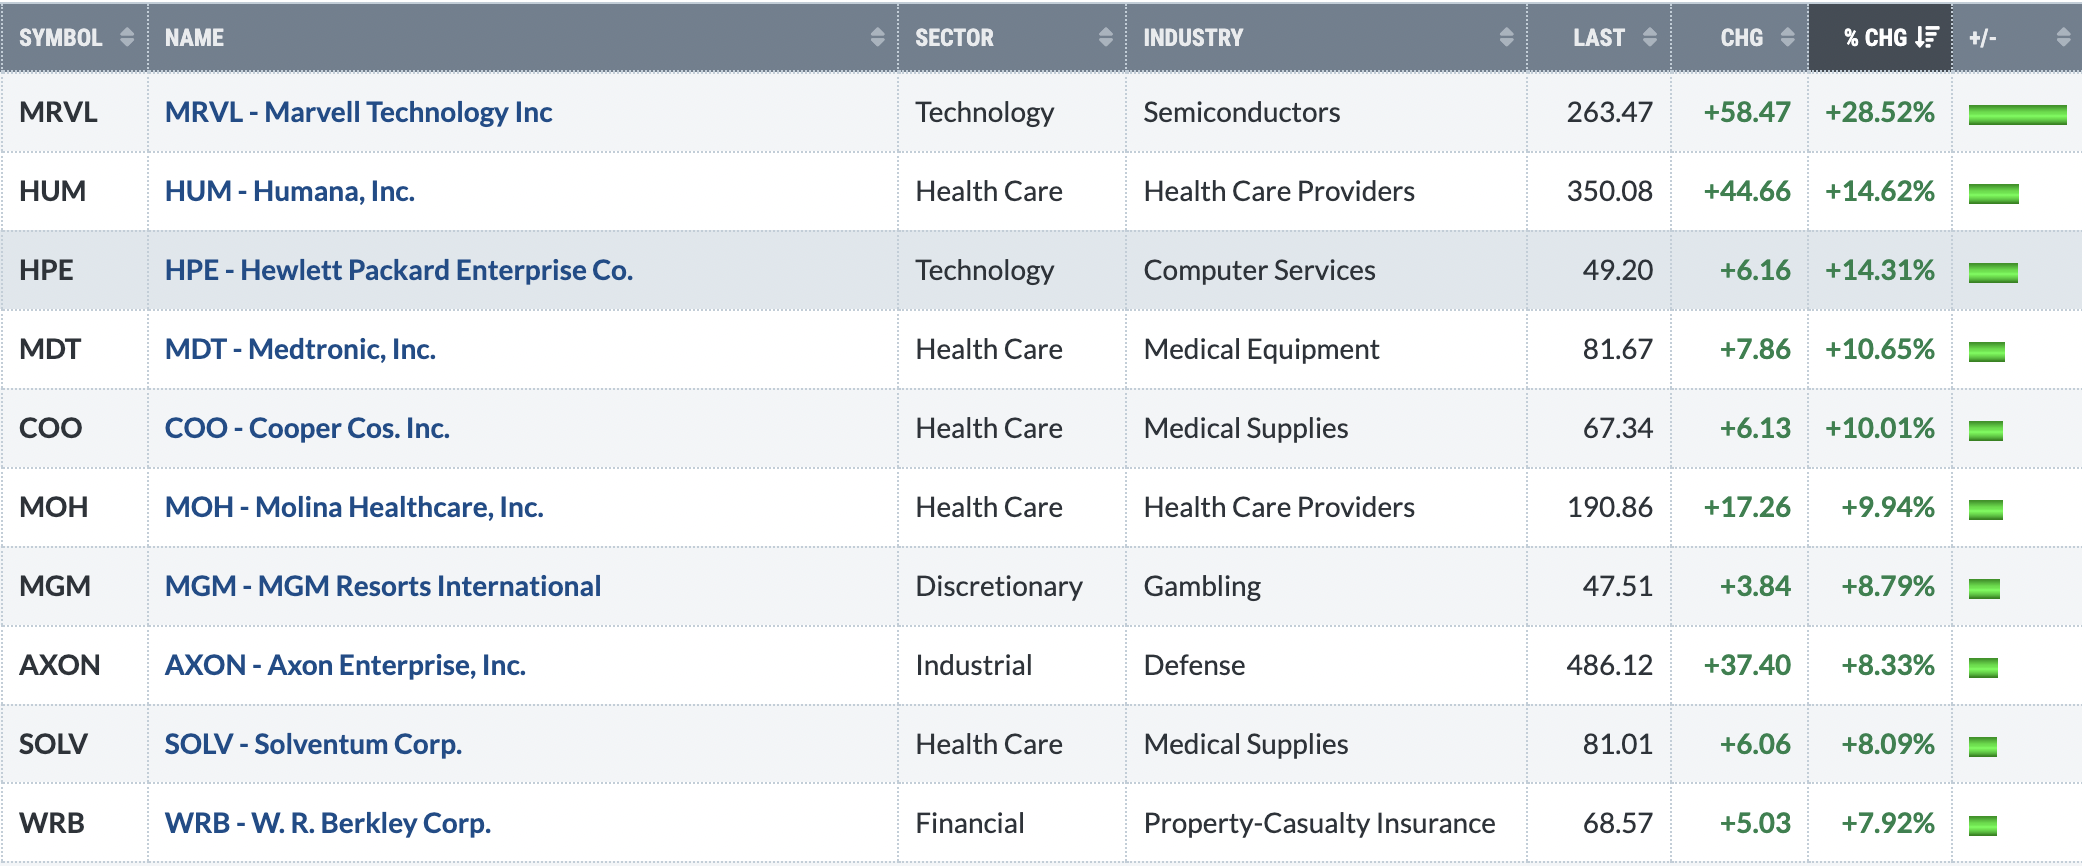
Top 10 Stocks - S&P 500/NASDAQ 100
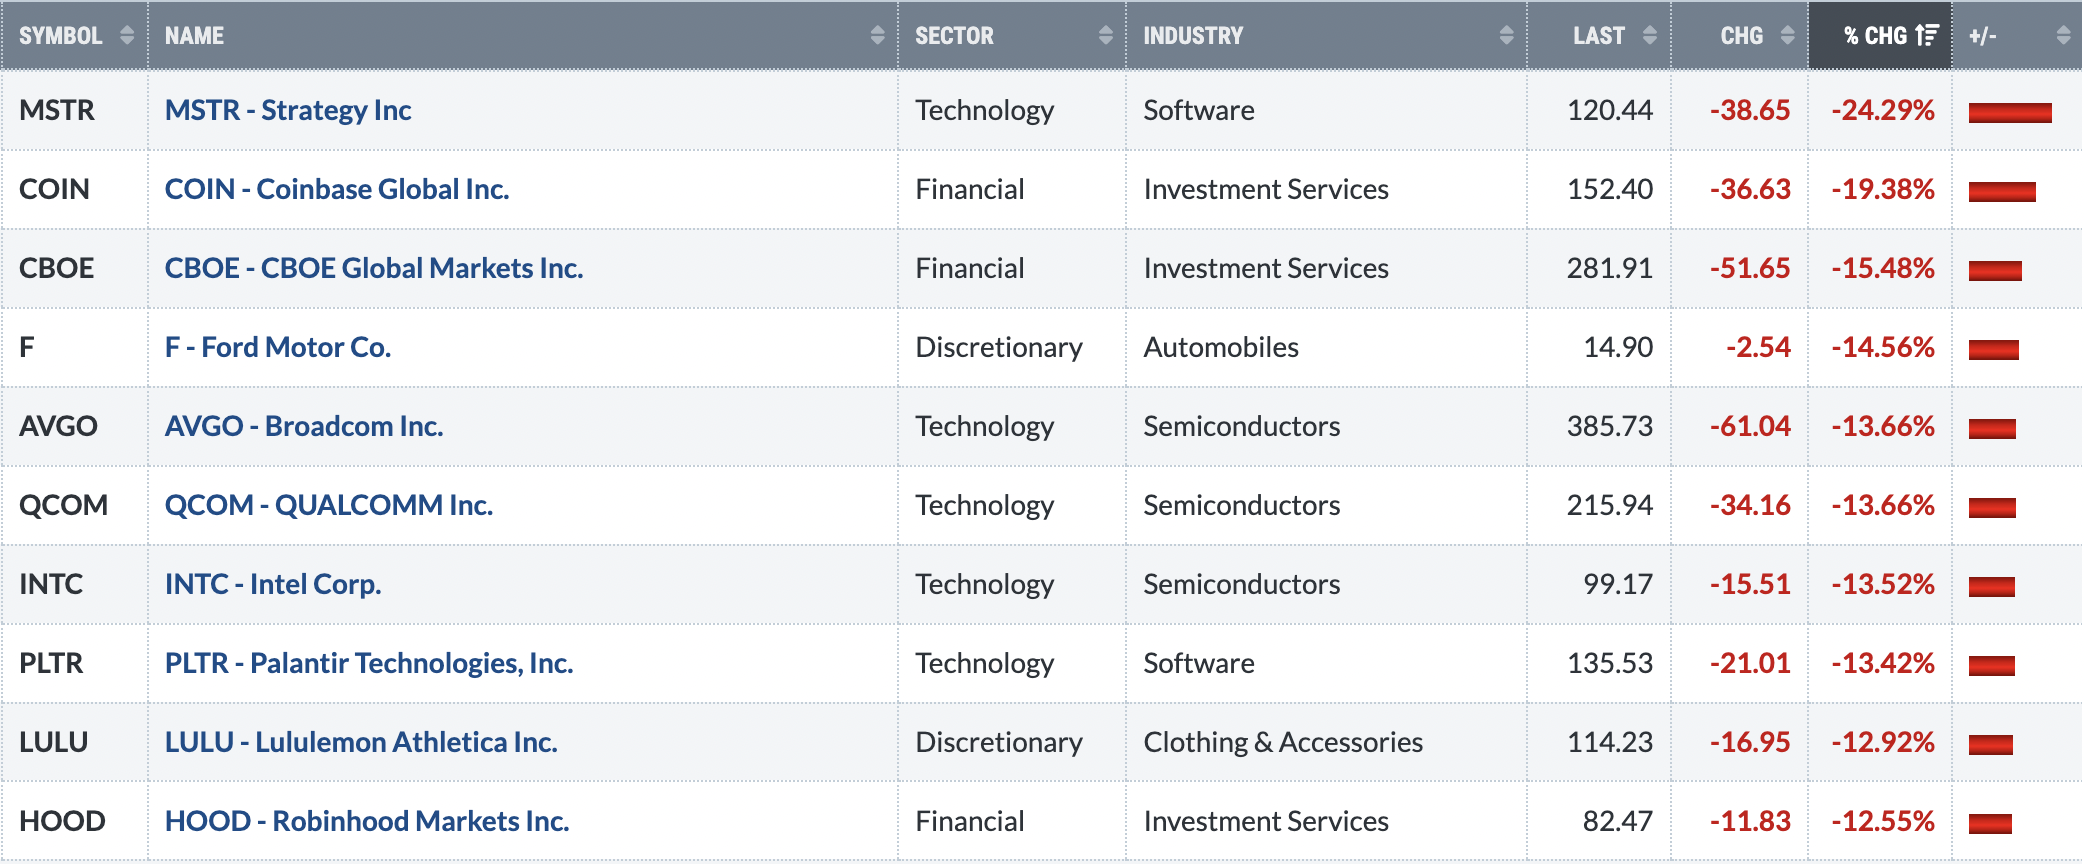
Bottom 10 Stocks - S&P 500/NASDAQ 100
Big Picture
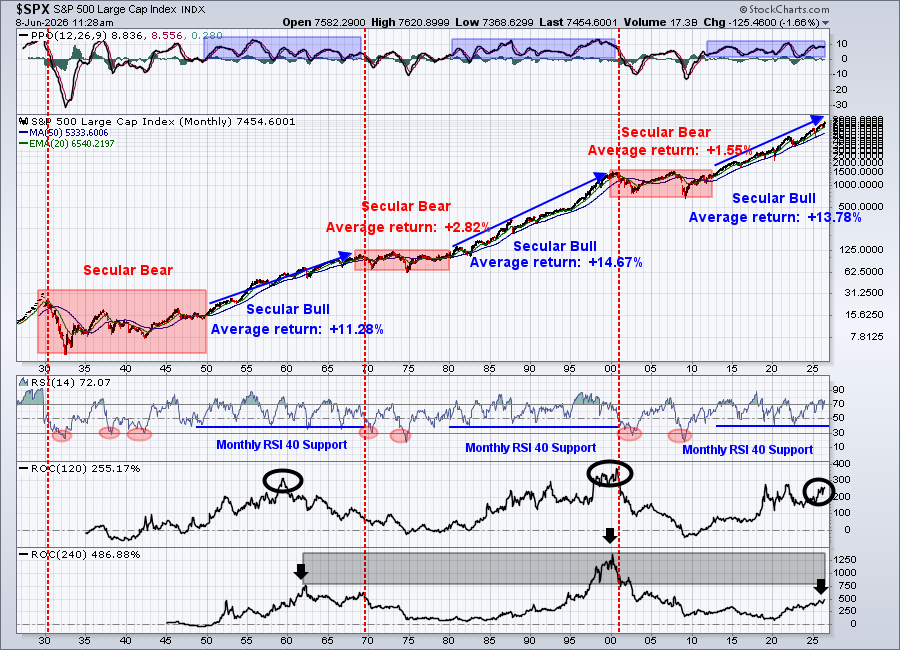
Friday's big selloff is nothing more than a blip here on the long-term S&P 500 chart. These types of sudden selloffs no doubt rattle most of us when they occur, especially if we focus on short-term trading. Sizable gains turn into losses in minutes and then quickly grow. It seems as if buyers have disappeared and, technically, they have. I always refer to it as "market makers going on vacation". Even though institutional investors have bought shares of many stocks at higher prices, they don't worry about short-term selling, because they have a long-term mindset. Institutions are moving way too much money to trade in and out in the near-term.
Most of the time these steep declines occur during bear markets and generally results in massive volume as individual investors panic and sell. On Friday, the S&P 500 volume was a bit more than average, but not massive. The heaviest volume occurred in the final two hours. I believe there may have been some panicked selling between 2pm and 3pm ET, particularly in many of the growth stocks (semiconductors for sure), then things stabilized in the final hour - likely due to market makers finally stepping in to support (buy) the market at much lower prices.
Usually, these types of selling events do not occur in just one single day. I'm expecting to see more selling near-term, possibly selling and consolidation until Q2 pre-earnings activity begins later this month into early July, when market conditions tend to be very bullish.
Sustainability Ratios
Here's the latest look at our key intraday ratios as we follow where the money is traveling on an INTRADAY basis (ignoring gaps):
QQQ:SPY
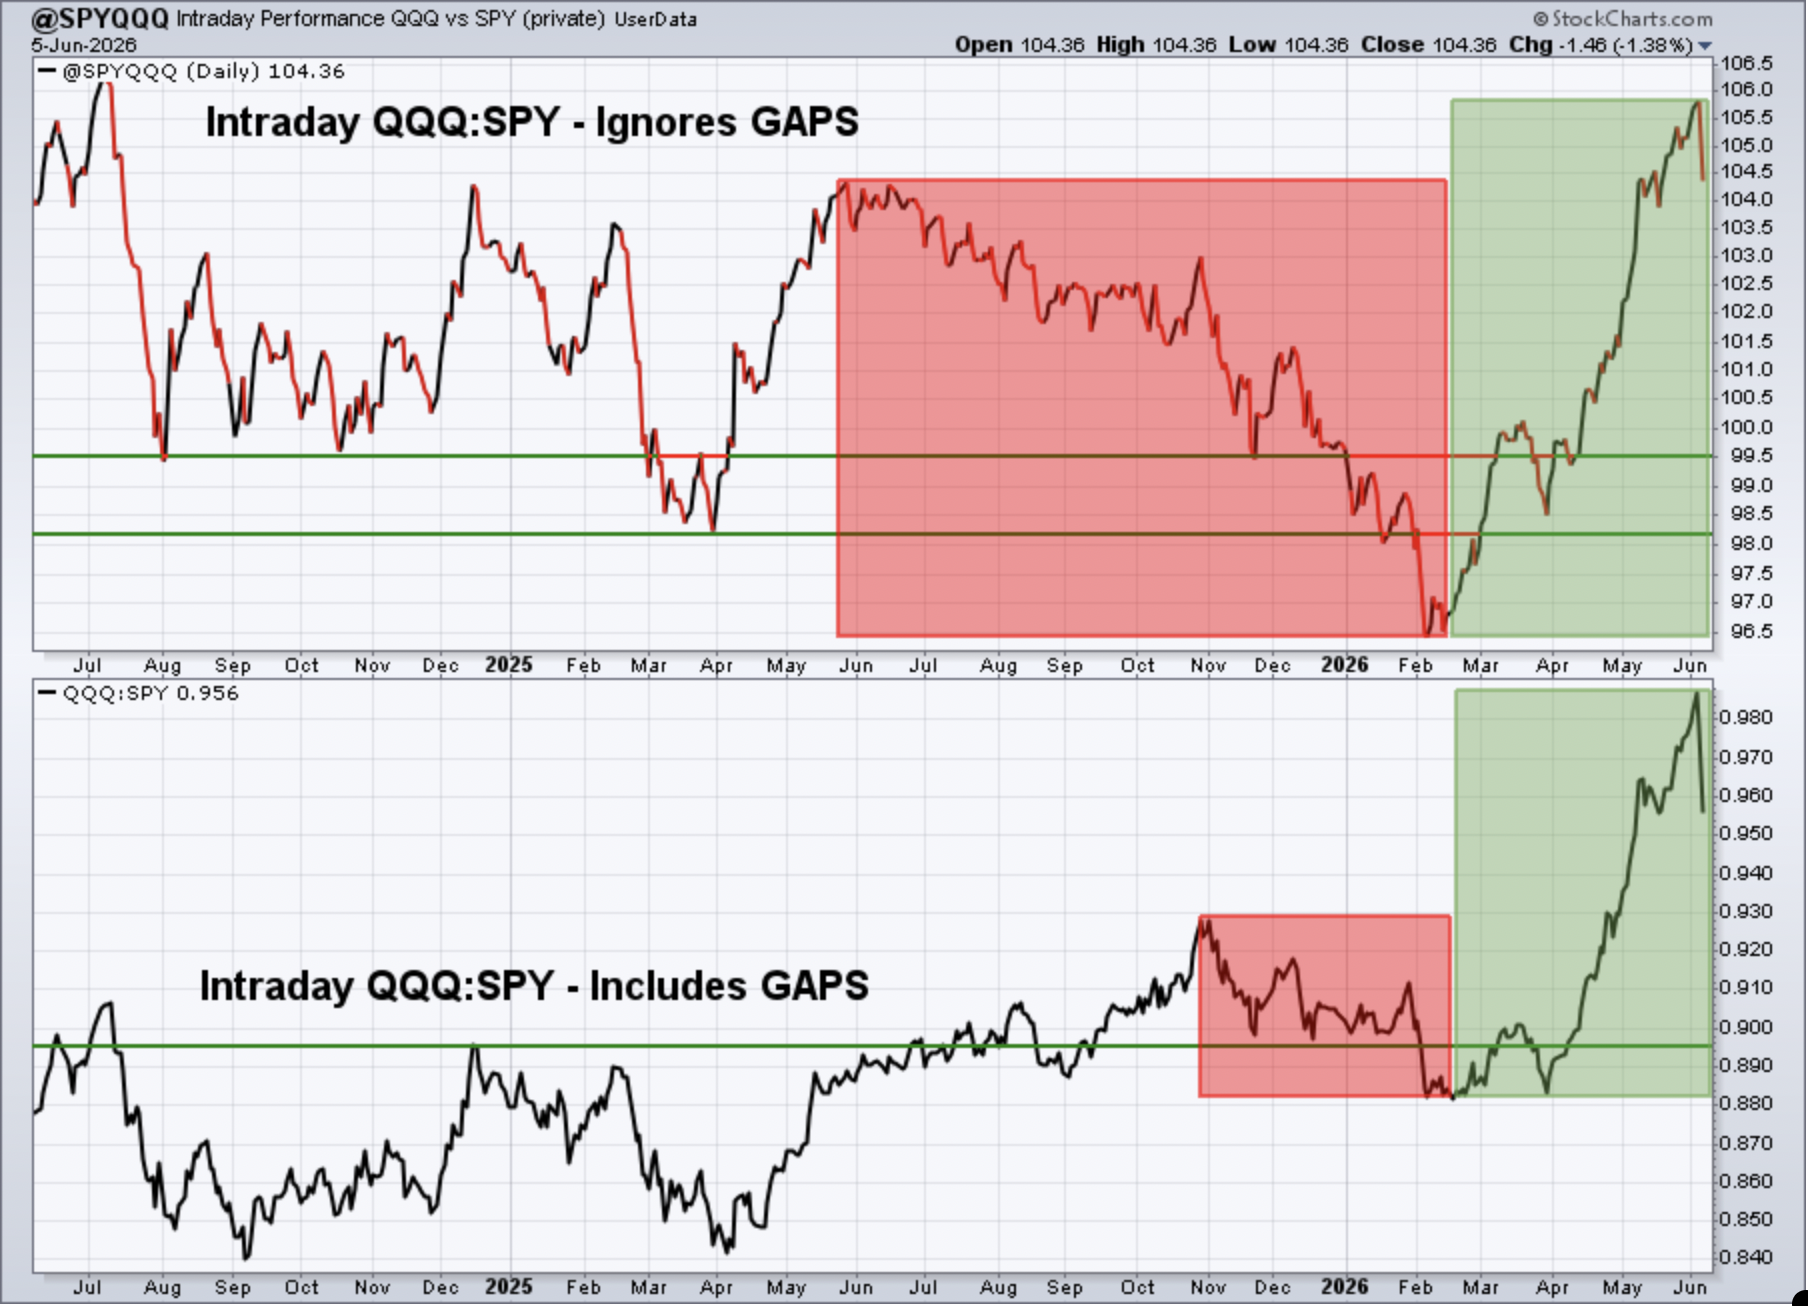
Keep in mind that the intraday analysis provided is a "work in progress". I continue to analyze this data to see if it helps provide us clues about calling market direction. It makes common sense to me that it should help in some sense, but it'll require a much longer-term study to determine its worth.
After weeks of parabolically higher action in this ratio, Friday reversed everything - at least in the short-term. Growth stocks were decidedly weaker and that translated into a falling QQQ:SPY ratio. Profit taking is part of the game, so don't be surprised if we see further weakness in this ratio throughout June.
IWM:QQQ
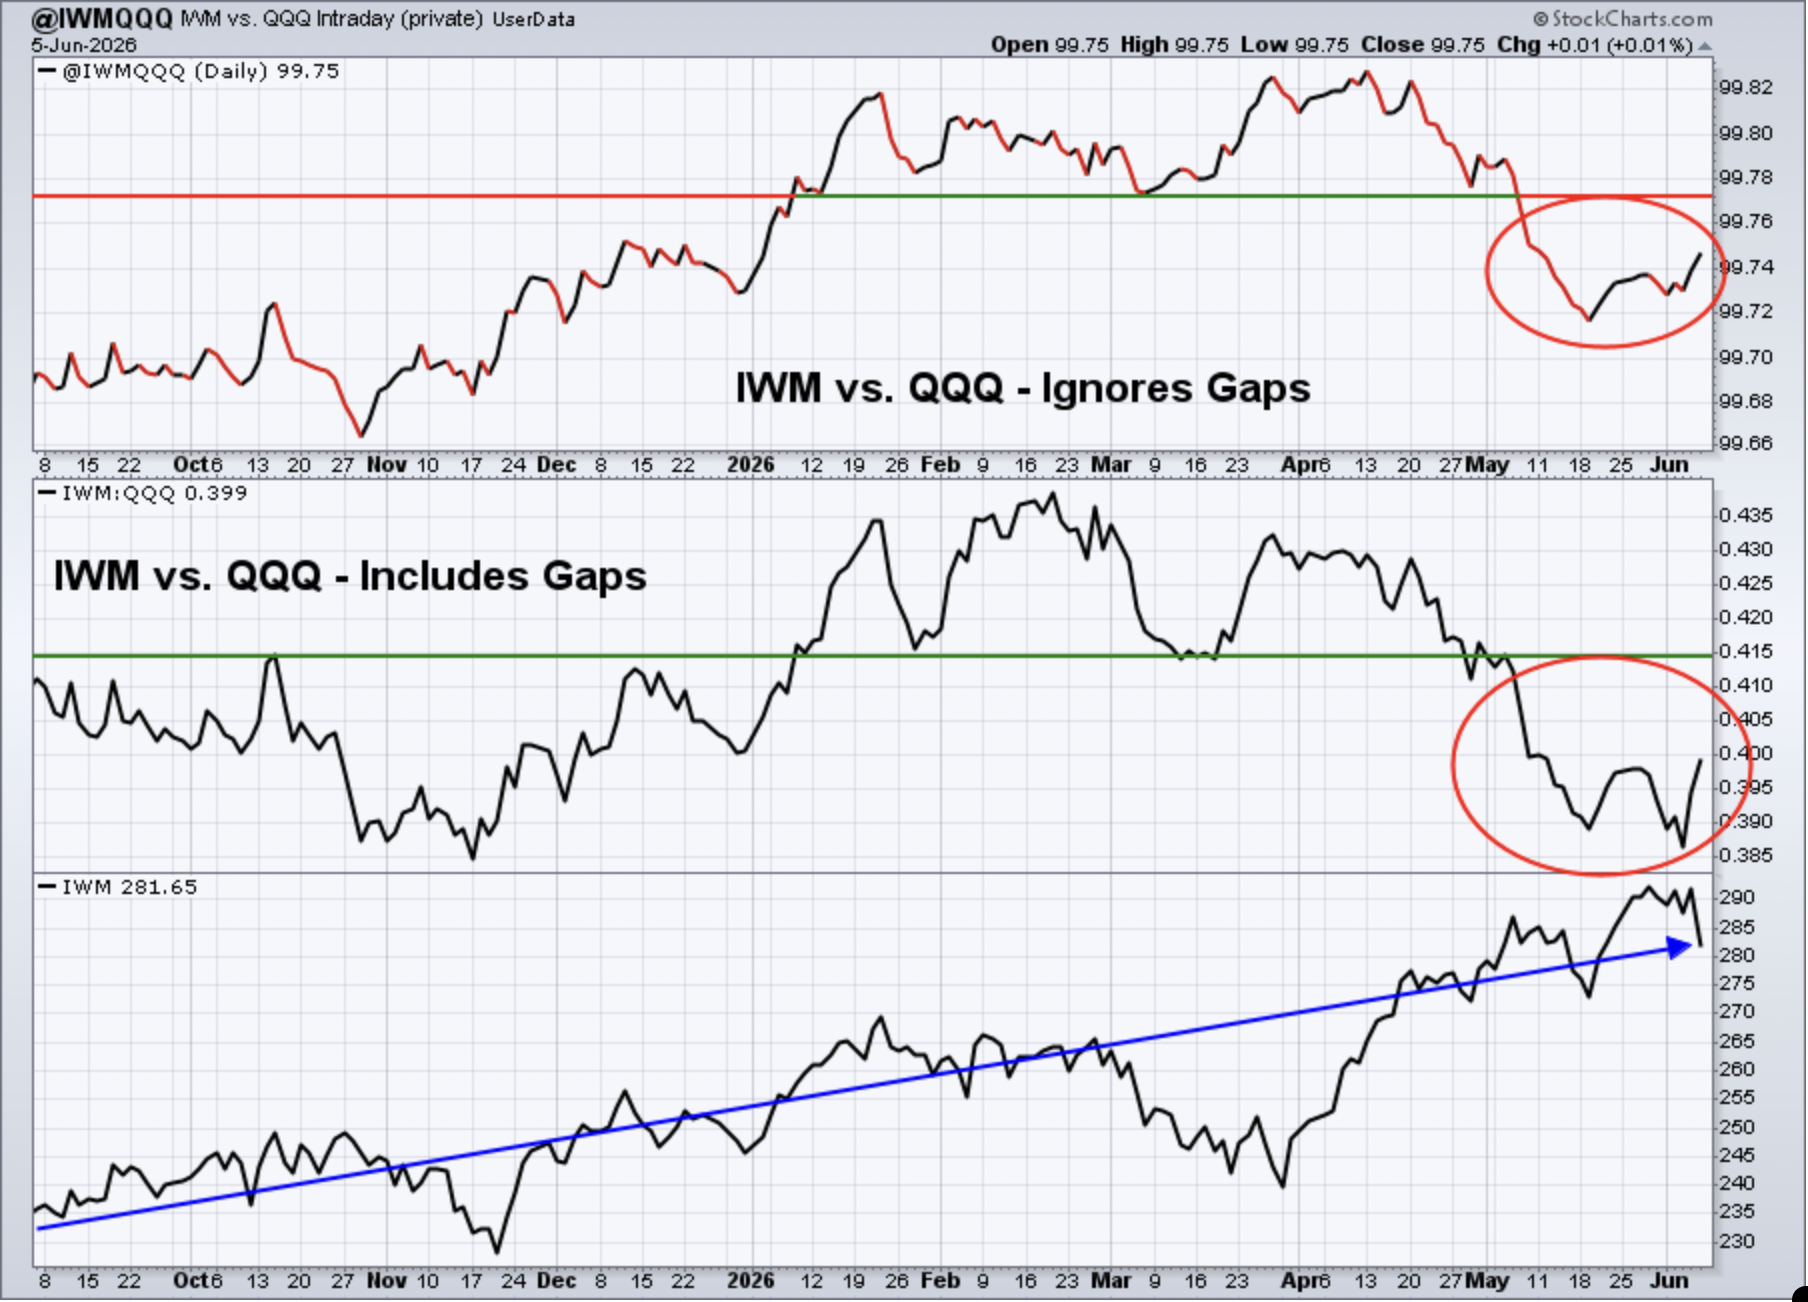
The small cap IWM weakened considerably vs. the growth-oriented NASDAQ 100 during the first half of last week, but it avoided some of the damage inflicted late last week. The IWM still fell on Friday, but it did manage to outperform the NASDAQ. Two inflation reports will be out later this week. If they turn out to be rather benign, which I believe they will, there's a reasonable chance that we'll see the IWM's relative strength on Thursday and Friday continue this week. If growth stocks have a difficult next few weeks, that money will go somewhere and small caps could be a beneficiary.
XLY:XLP
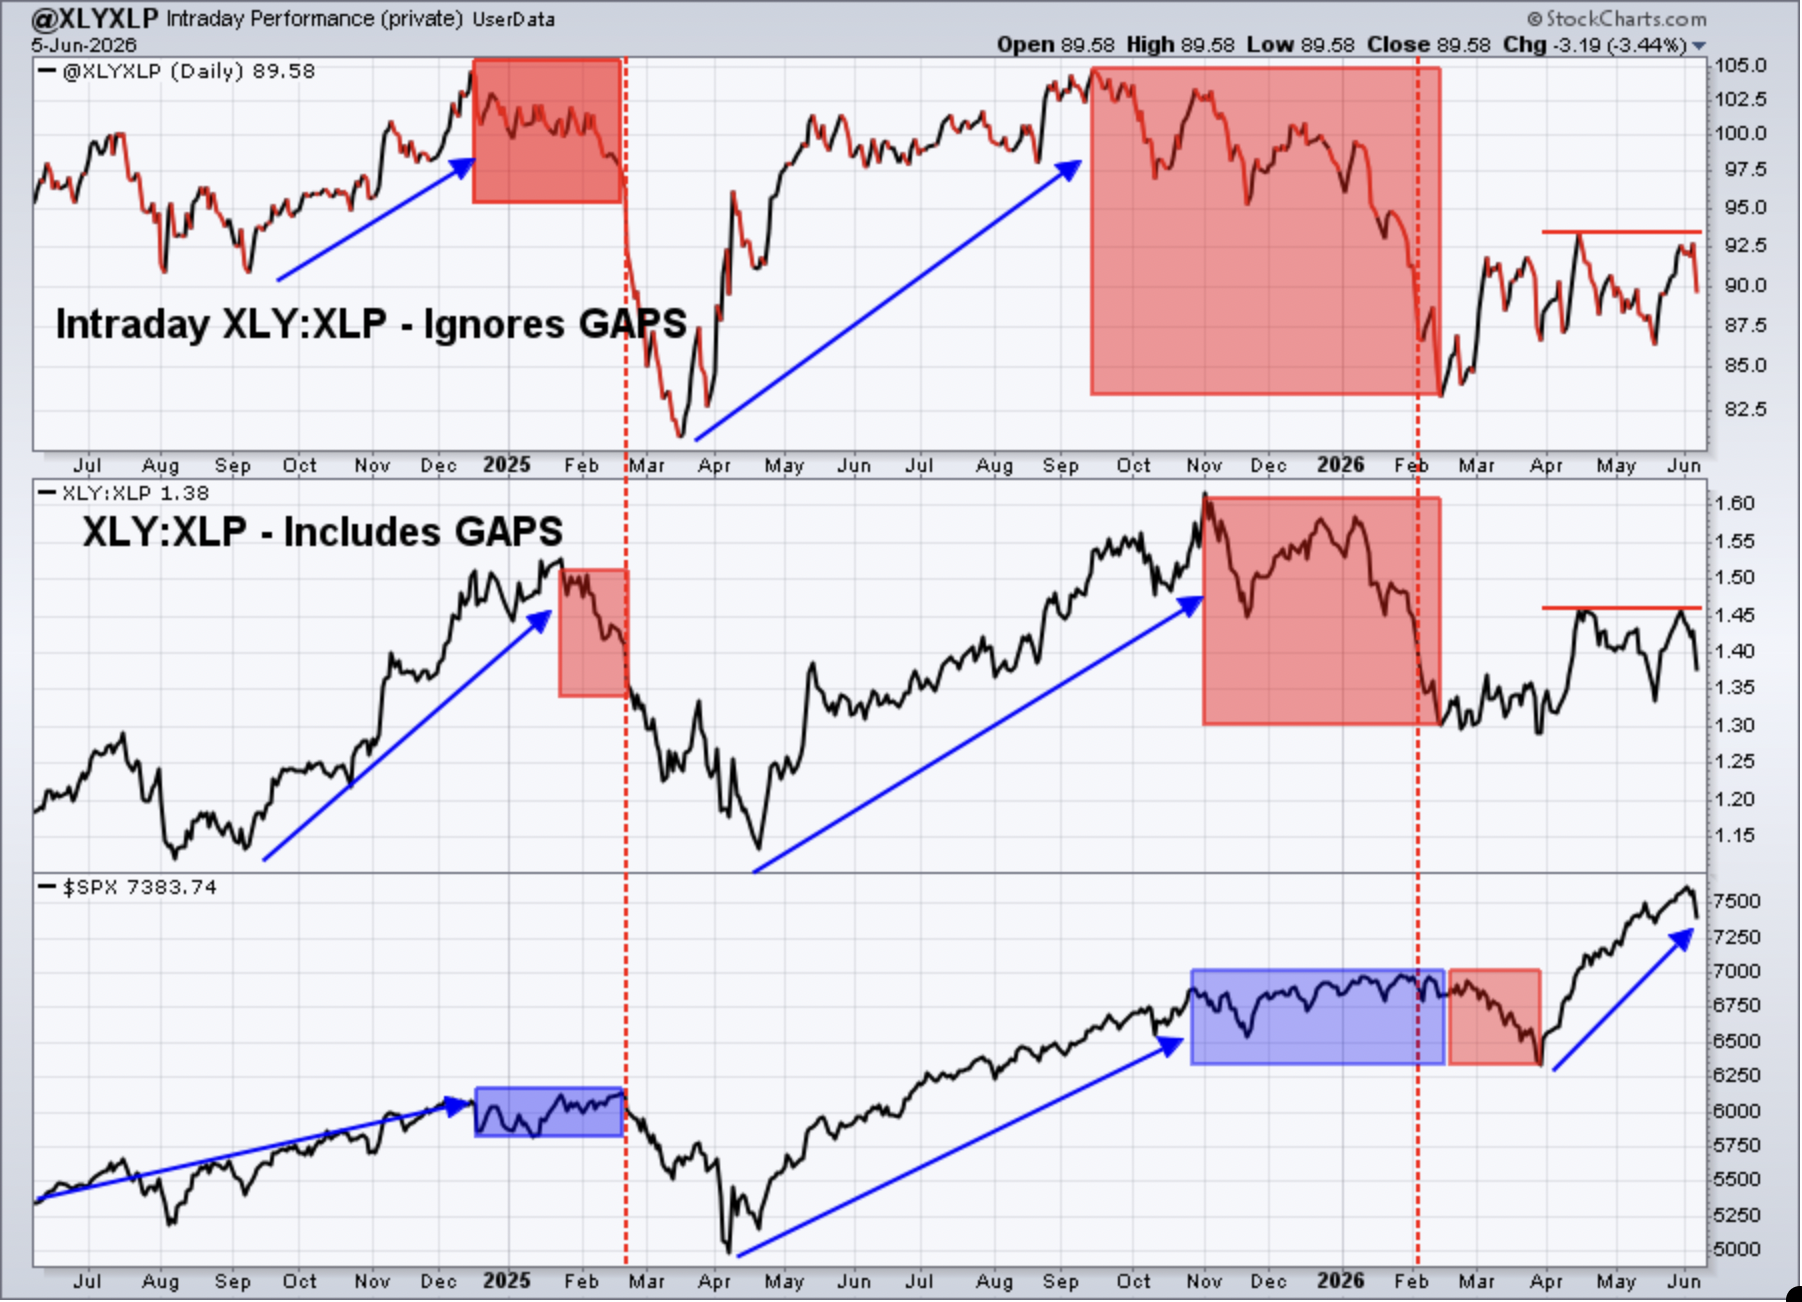
Last week, I was anticipating a potential breakout in this ratio above the April high. Instead, the ratio turned back down, so we'll have to wait for a potential breakout. Friday was a particularly rough day for this ratio as the defensive staples sector (XLP) advanced as money rotated heavily away from aggressive areas and favored defensive sectors.
Sentiment
5-day SMA ($CPCE)
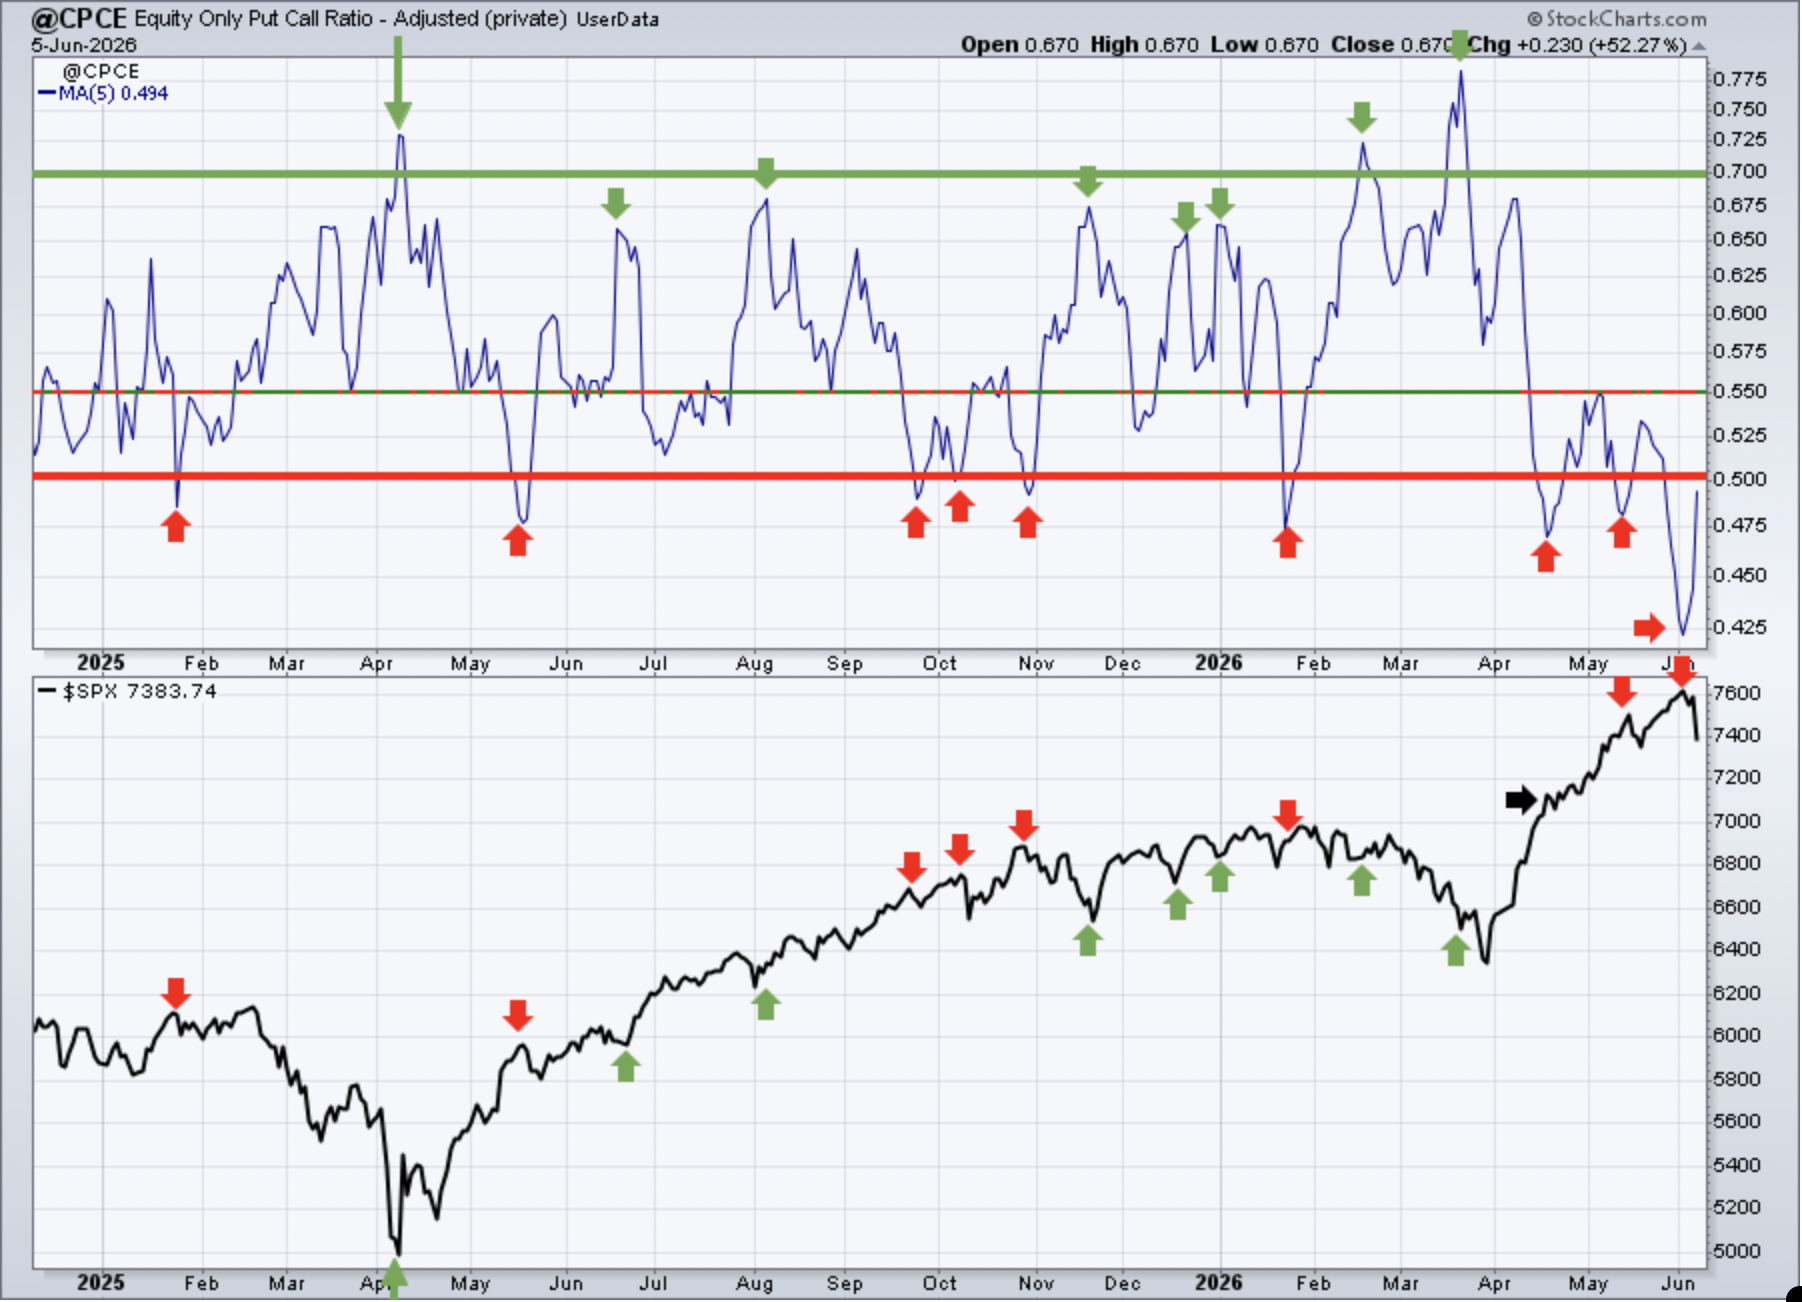
Sentiment indicators are contrarian indicators. When they show extreme bullishness, we need to be a bit cautious and when they show extreme pessimism, it could be time to become much more aggressive. Major market bottoms are carved out when pessimism is at its absolute highest level.
One indicator that nailed the selling was the 5-day CPCE. I mentioned last week that this indicator suggested the S&P 500 wasn't likely to go much higher and.....voila! History tells us to be short-term cautious any time this 5-day SMA dips down below .50. At the low last week, this 5-day SMA hit 0.42, its lowest level since several readings below .40 in 2021. That extreme complacency can't predict with precision a big selloff, but it does warn us of a potential selloff at any moment.
253-day SMA ($CPCE)
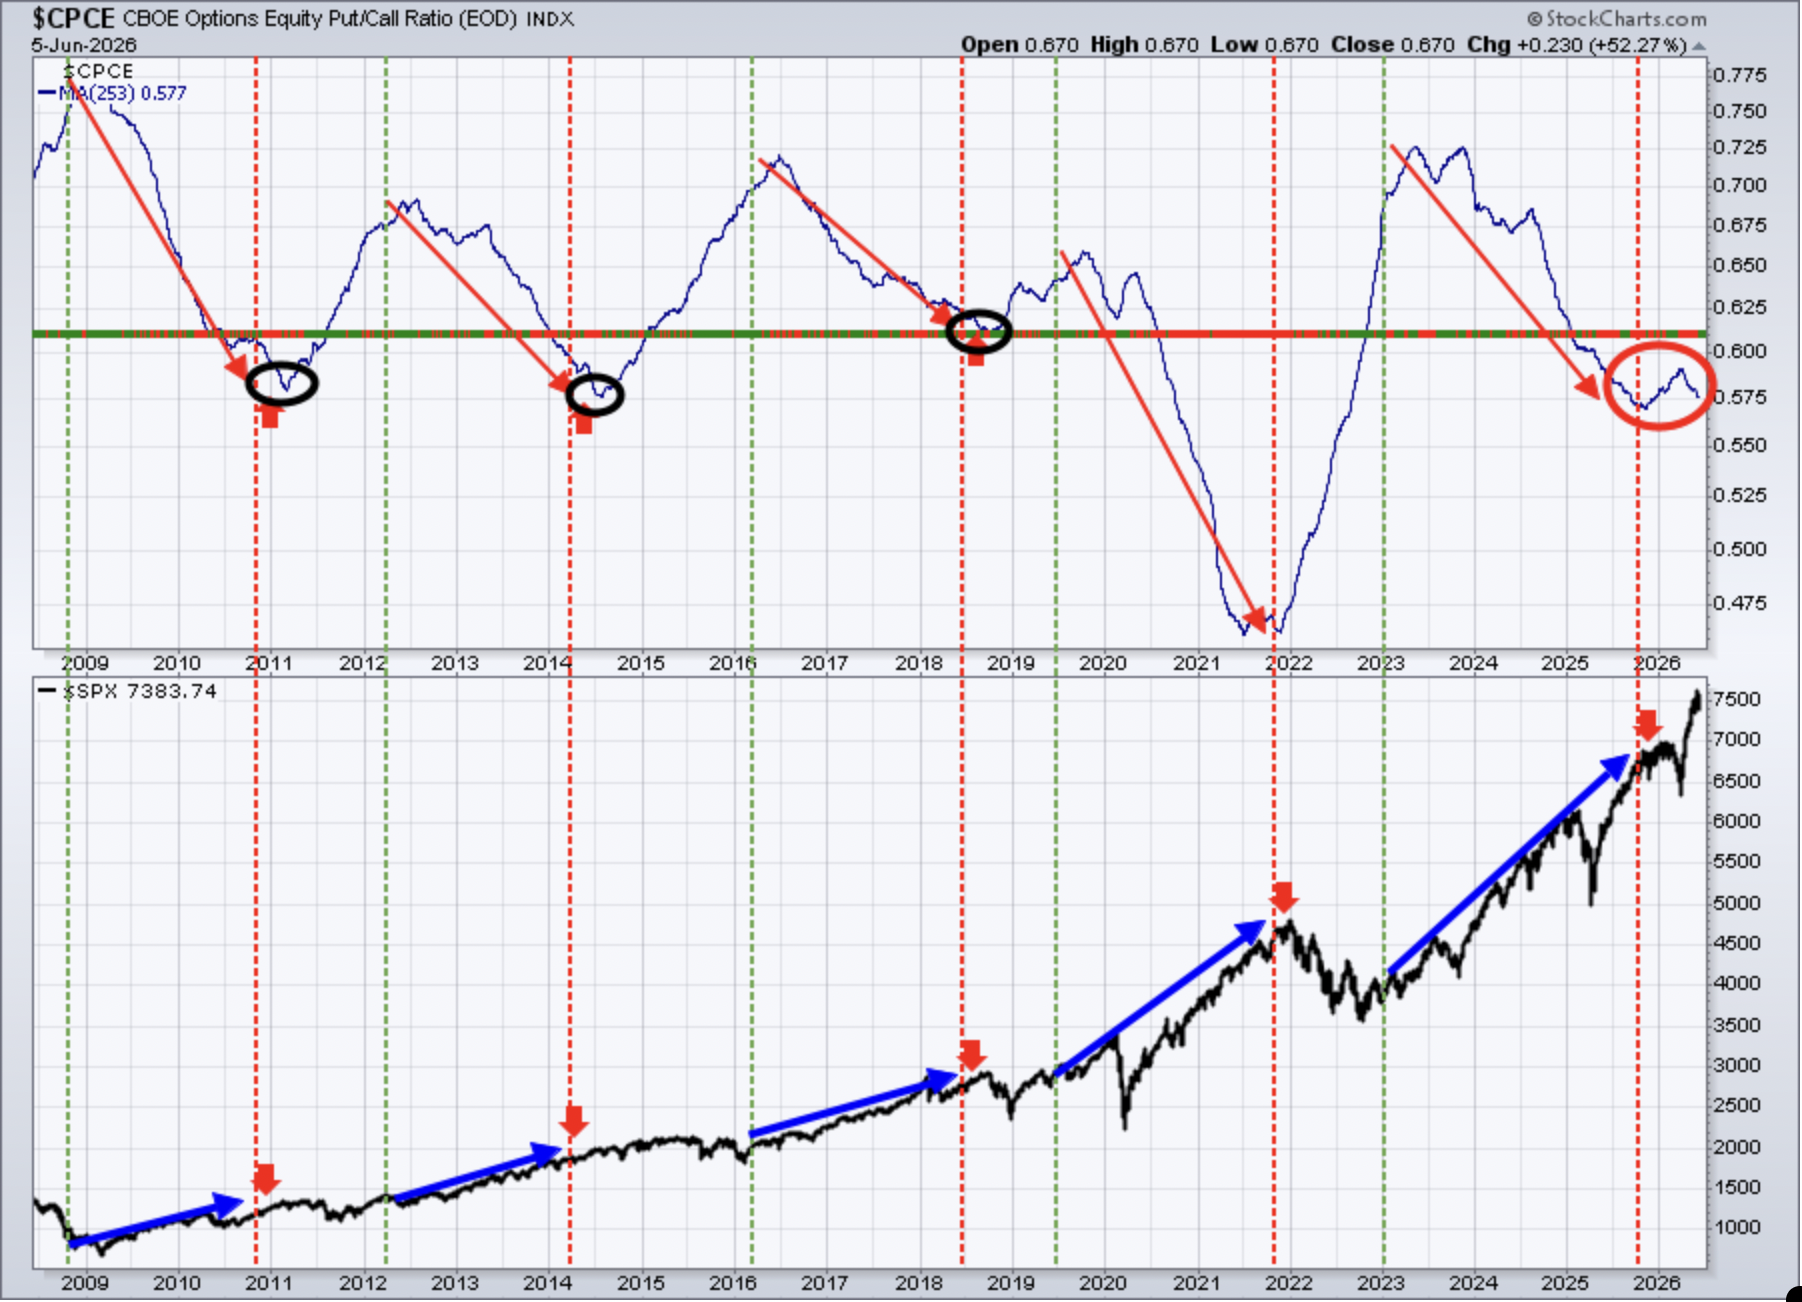
This longer-term 253-day SMA of the CPCE is our "ocean-liner" signal, unlike our short-term speedboat indicator. Any significant change in direction in this 253-day CPCE, in the past, has had profound effects on the S&P 500.
If I'm being honest, I'm really not quite sure what this 253-day SMA is telling us. At the beginning of the year, I expected that we'd see selling, followed by choppy action, in order for the recent uptrend to mature. Then I figured we'd be set up for more bullish action later in 2026. Instead, the uptrend in this 253-day SMA has been stymied as it's rolled over. At this point, I'm just not using this moving average in trying to determine market direction as its signal isn't clear.
Long-Term Trade Setups
Since beginning this Weekly Market Report in September 2023, I've discussed the long-term trade candidates below that I really like. Generally, these stocks have excellent long-term track records, and many pay nice dividends that mostly grow every year. Only in specific cases (exceptions) would I consider a long-term entry into a stock that has a poor or limited long-term track record and/or pays no dividends. I try to review the long-term picture once a month, and below is how I viewed each chart as of Friday, May 29th:
- JPM - trending above its 20-day EMA, bullish
- BA - since the 2020 drop, overhead resistance has been set at 270-275
- FFIV - broke to all-time high in May
- MA - steady decline has stock approaching its 50-month SMA; nice entry spot
- GS - relative leader in space, setting new all-time highs, bullish
- FDX - setting new records, despite AMZN announcement to compete
- AAPL - also setting new records, looks excellent
- CHRW - consolidating in wide 150-200 range after 2025 breakout
- JBHT - keeps trending up after breakout to clear years of consolidation
- STX - astounding rally off April 2025 low continues
- HSY - sloppy cup with handle? If so, needs to hold 180 support
- DIS - lengthy consolidation from 80-125 now 4 years deep
- MSCI - nice advance past two months, long-awaited breakout coming?
- SBUX - another long-time consolidation stock, needs to clear 112-114
- KRE - long-term rally still intact, despite recent struggles
- ED - watching support near its 20-month EMA just above 100
- AJG - monthly RSI has dipped below 40 for only the second time since 2009
- NSC - cup with handle breakout in mid-2025, measurement to 360 or so
- RHI - has bottom finally been found? Huge dividend yield, if dividend not cut
- ADM - purchase back in 40s now looks genius as it approaches a double in a yr
- BG - uptrending in all-time high territory
- CVS - tested all-time high resistance, but then failed; still remains solid
- HRL - dividend aristocrat reversed nicely in May; bottom in?
- DE - pulling back to approach rising 20-month EMA
- LULU - pierced the 2020 pandemic low of 128.84 and bounced
- TTD - even with a much stronger software group, TTD is trading poorly
- META - trading right around its 20-month EMA, likely solid entry
- ADBE - strengthening with first MAJOR test at declining 20-month EMA
- KMB - another dividend aristocrat, looking for support in the 90s to hold
- ORCL - jumped 40% in May, suggesting our entry earlier was a smart one
- ABBV - very nice recovery off 20-month EMA test
- MCD - trades 6 bucks above its 50-month SMA; hasn't closed beneath this MA in 23 years
Keep in mind that our Weekly Market Reports favor those who are more interested in the long-term market picture. Therefore, the list of stocks above are stocks that we believe are safer (but nothing is ever 100% safe) to own with the long-term in mind. Nearly everything else we do at EarningsBeats.com favors short-term momentum trading, so I wanted to explain what we're doing with this list and why it's different.
Also, please keep in mind that I'm not a Registered Investment Advisor (and neither is EarningsBeats.com nor any of its employees) and am only providing (mostly) what I believe to be solid dividend-paying stocks for the long term. Companies periodically go through adjustments, new competition, restructuring, management changes, etc. that can have detrimental long-term impacts. Neither the stock price nor the dividend is ever guaranteed. I simply point out interesting stock candidates for longer-term investors. Do your own due diligence and please consult with your financial advisor before making any purchases or sales of securities.
Looking Ahead
Upcoming Earnings
The following list of companies is NOT a list of all companies scheduled to report quarterly earnings, however, just key reports, so please be sure to check for earnings dates of any companies that you own. Any company in BOLD represents a stock in one of our portfolios and the amount in parenthesis represents the market capitalization of each company listed:
- Monday: None
- Tuesday: CASY ($28 billion)
- Wednesday: ORCL ($680 billion)
- Thursday: ADBE ($104 billion), LEN ($23 billion)
- Friday: None
Key Economic Reports
- Monday: None
- Tuesday: May existing home sales, April wholesale inventories
- Wednesday: May CPI
- Thursday: Initial jobless claims, May PPI
- Friday: June consumer sentiment
Historical Data
I'm a true stock market historian. I am absolutely PASSIONATE about studying stock market history to provide us more clues about likely stock market direction and potential sectors/industries/stocks to trade. While I don't use history as a primary indicator, I'm always very aware of it as a secondary indicator. I love it when history lines up with my technical signals, providing me with much more confidence to make particular trades.
Below you'll find the next two weeks of historical data and tendencies across the three key indices that I follow most closely. The percentage for each calendar day represents the annualized return for that day. An example of how this is calculated is reflected next to the first day under the S&P 500 and in parenthesis:
S&P 500 (since 1950)
- Jun 8: -18.56% (Ex: cumulative gains =
-3.96% over 54 trading days since 1950. -3.96% x 253/54 = -18.56%) - Jun 9: -62.24%
- Jun 10: +12.68%
- Jun 11: -17.37%
- Jun 12: +12.05%
- Jun 13: +6.39%
- Jun 14: -12.52%
- Jun 15: +18.27%
- Jun 16: +27.89%
- Jun 17: +14.10%
- Jun 18: -22.20%
- Jun 19: -13.89%
- Jun 20: -23.59%
- Jun 21: +13.57%
NASDAQ (since 1971)
- Jun 8: -18.14%
- Jun 9: -46.06%
- Jun 10: -0.57%
- Jun 11: -66.85%
- Jun 12: +7.94%
- Jun 13: -7.85%
- Jun 14: -22.67%
- Jun 15: +45.66%
- Jun 16: +63.63%
- Jun 17: +22.65%
- Jun 18: -53.04%
- Jun 19: +31.68%
- Jun 20: -48.87%
- Jun 21: +16.55%
Russell 2000 (since 1987)
- Jun 8: +1.50%
- Jun 9: -60.71%
- Jun 10: -50.39%
- Jun 11: -153.91%
- Jun 12: -17.62%
- Jun 13: -28.83%
- Jun 14: -40.88%
- Jun 15: +84.42%
- Jun 16: +9.97%
- Jun 17: +19.06%
- Jun 18: -33.56%
- Jun 19: -8.37%
- Jun 20: -67.36%
- Jun 21: +30.23%
The S&P 500 data dates back to 1950, while the NASDAQ and Russell 2000 information date back to 1971 and 1987, respectively.
Final Thoughts
In my opinion, the media wants us to believe the inflation story. Personally, I don't. Maybe I'm wrong. Until Friday, there's been very little evidence that Wall Street believes the inflation story. Growth stocks had been soaring, prior to Friday, which is completely opposite what we would see if inflation was a problem. So the million dollar question is this: Did Friday change everything? I don't believe so. I was traveling on Friday and was aware of the selloff, but really couldn't drive and study the action simultaneously. So I didn't really evaluate much until late last night.
Here's what I think after reviewing a number of charts last night and looking ahead to this week:
Inflation. Well, we're getting two more key inflation reports this week in the CPI on Wednesday and the PPI on Thursday. Wednesday's report is much more important, in my view. The April Core CPI, which is the number I watch closely, jumped to +0.4%. I really don't want to see a Core CPI number any higher than that. May Core CPI is expected to retreat slightly to +0.3%. That number, or anything lower, should be solid for growth stocks, even if we do see further short-term weakness.
Seasonality. Earnings season has wound down, except for a few companies (like ORCL later this week). The stock market gets bored once earnings season is behind us, and we do see some weakness during this period (third month) of each calendar quarter. Remember, the first half of calendar quarters has a LONG history of performing better than second halves. Don't let some weakness in the second half of this quarter misguide you. Short-term, we could see more turbulence. Longer-term, however, I remain very bullish.
Semiconductors. This has been the lifeline of the S&P 500 for years. The group (SOXX) was annihilated on Friday to the tune of 10.44%. It also lost its 20-day EMA....barely. A quick recovery and close back above the 20-day EMA could help to stave off more selling, but another close below the 20-day EMA could present a big problem. There's a negative divergence in play, so loss of the 20-day EMA could lead to a larger drop and a 50-day SMA test to reset the PPO closer to the zero line. Over the past 20 years, June has been one of the weaker months for semis.
Technical Indicators. The negative divergences on the daily charts are probably the most worrisome short-term issue for me. Whether we see weakness play out to 50-day SMAs is almost assuredly dependent upon the semiconductors. Therefore, keep a close eye on the SOXX to see if it can remain above its 20-day EMA. Thus far today, the rebound has been fairly impressive, but action this afternoon and into the close will be much more meaningful. To give you a golf analogy, "drive for show, putt for dough". It's how you close that matters.
Long-Term Clarity. I remain VERY bullish the long-term. This is just my opinion, and I'm not a Registered Investment Advisor (RIA), but I believe long-term investors should continue to stay the course. It's what I said at the beginning of the year and it's what I continue to say. I believe that stock prices are going higher over time. I do NOT see any significant long-term period of selling on the horizon and would be very surprised to see the current selling morph into anything greater than a short-term pullback. From a LONG-TERM perspective, I view 7000 as solid support on the S&P 500.
Happy trading!
Tom