
EB Weekly Market Report - Monday, June 22, 2026
ChartLists/Spreadsheets
The following ChartLists/Spreadsheets were updated Friday and have been updated on our website:
- Strong Earnings (SECL)
- Strong Future Earnings (SFECL)
- Raised Guidance (RGCL)
- Bullish Trifecta (BTCL)
- Leading Stocks (LSCL)
- Matt's Hot Stocks (HTCL)
The above ChartLists and the Key Manipulation spreadsheet have been updated through Thursday, June 18th (Market was closed on Friday, June 19th). You can view and/or download these ChartLists from our website, and also read about them to gain a better understanding of how they can help in your trading success.
Weekly Market Recap
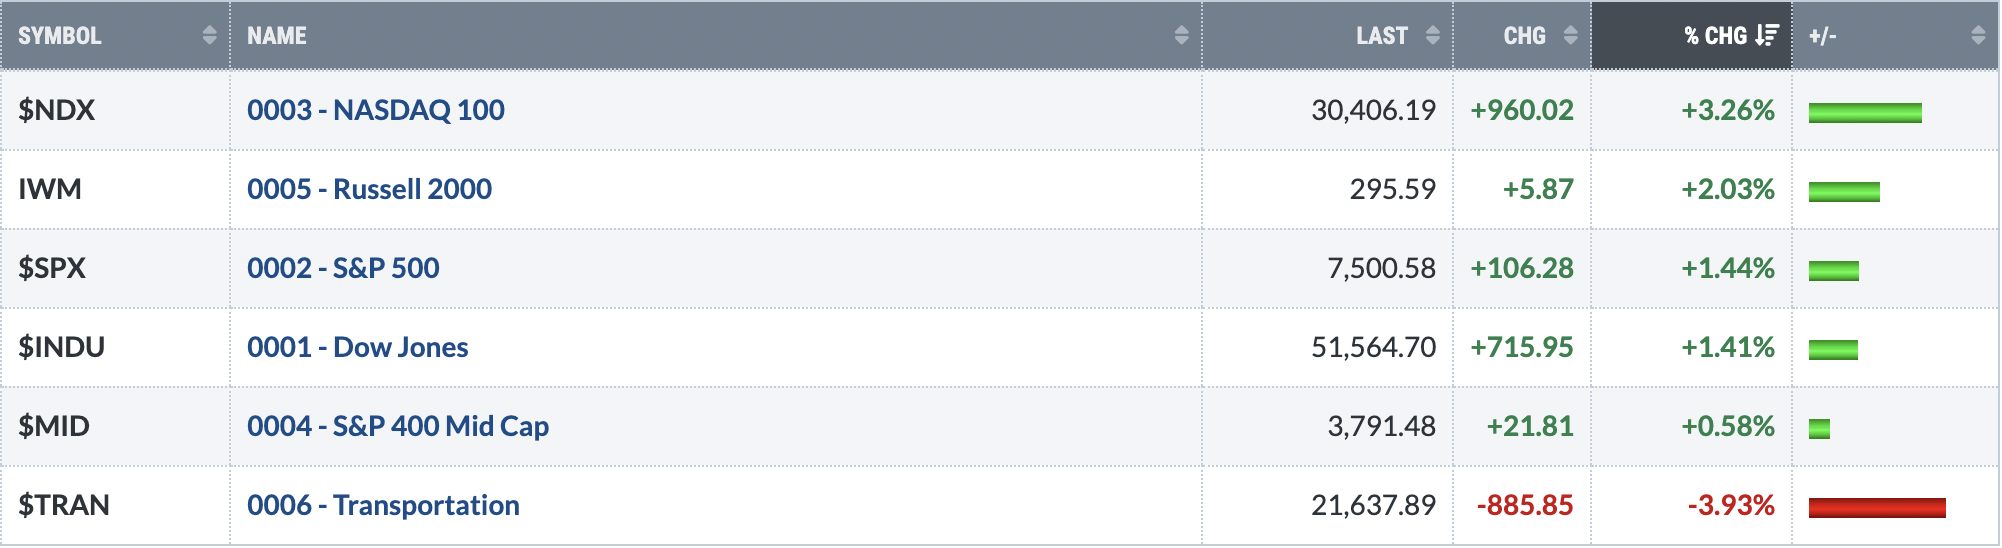
Major Indices
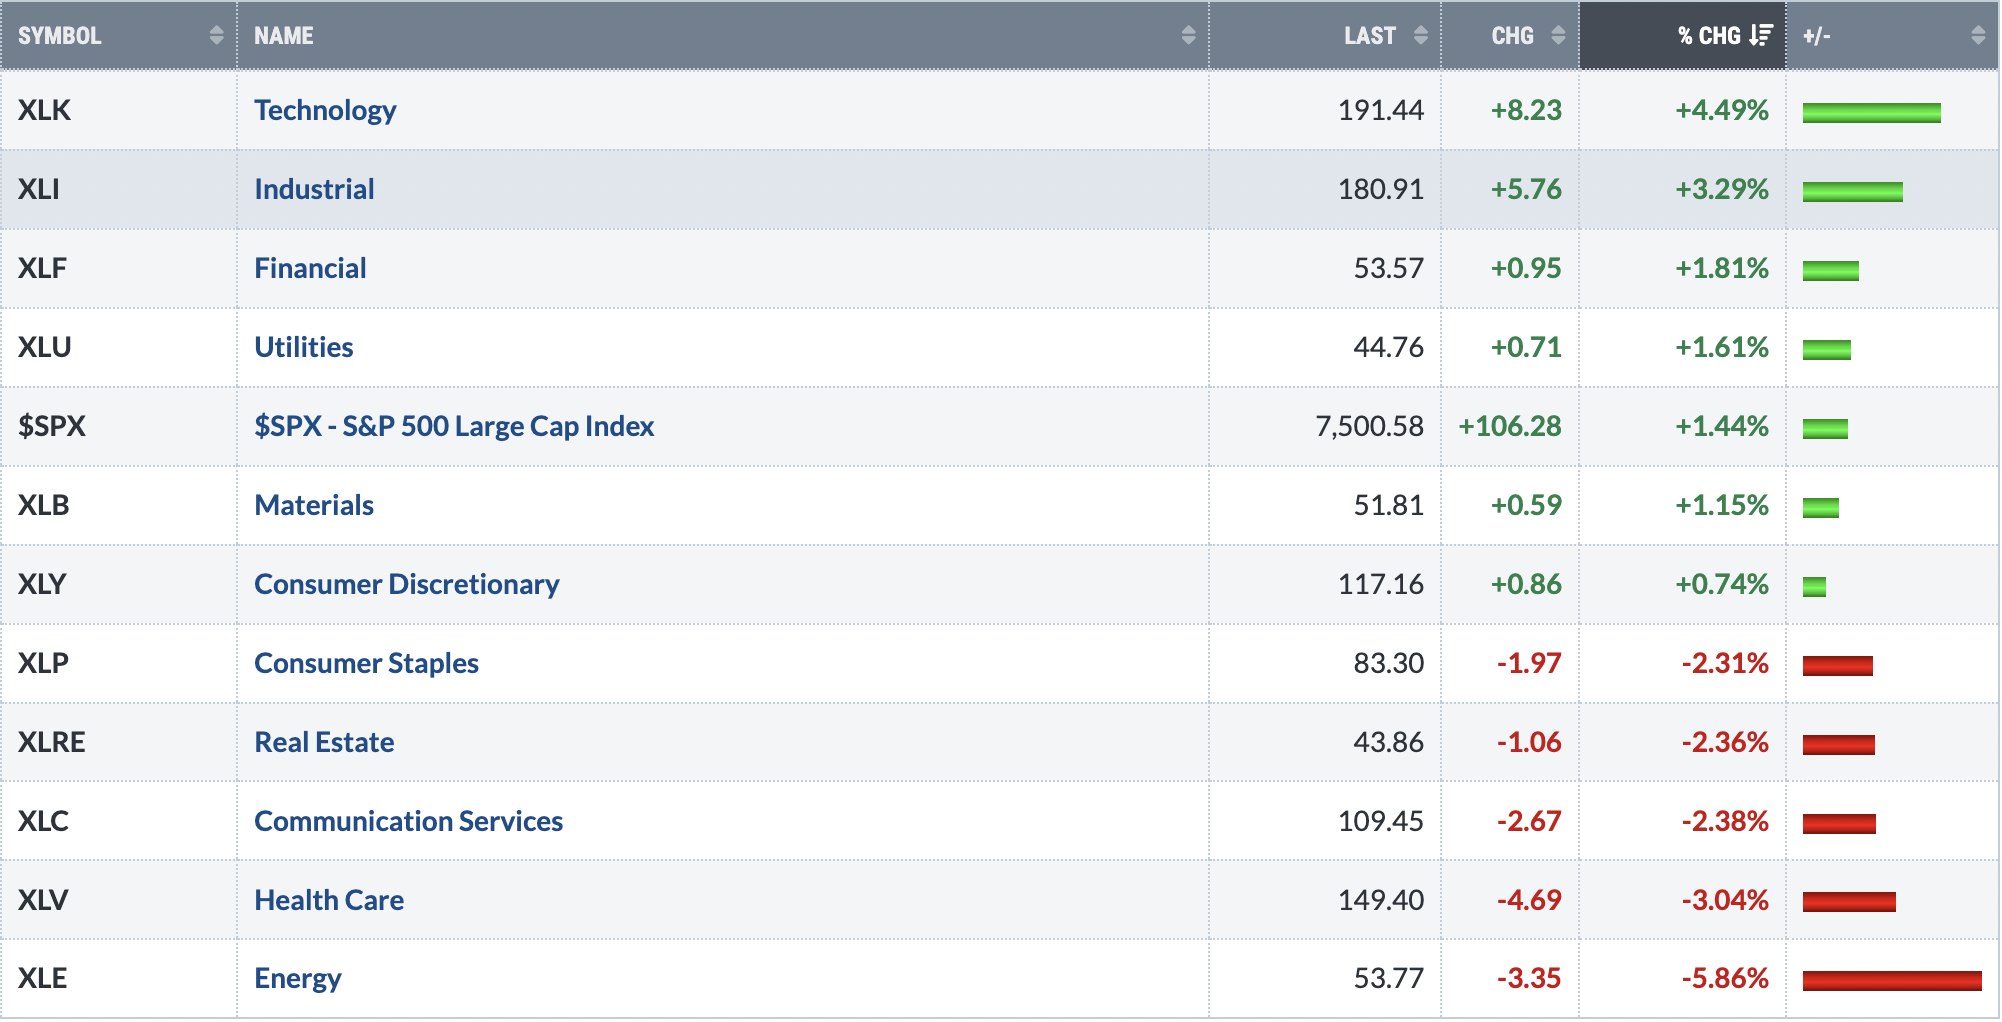
Sectors
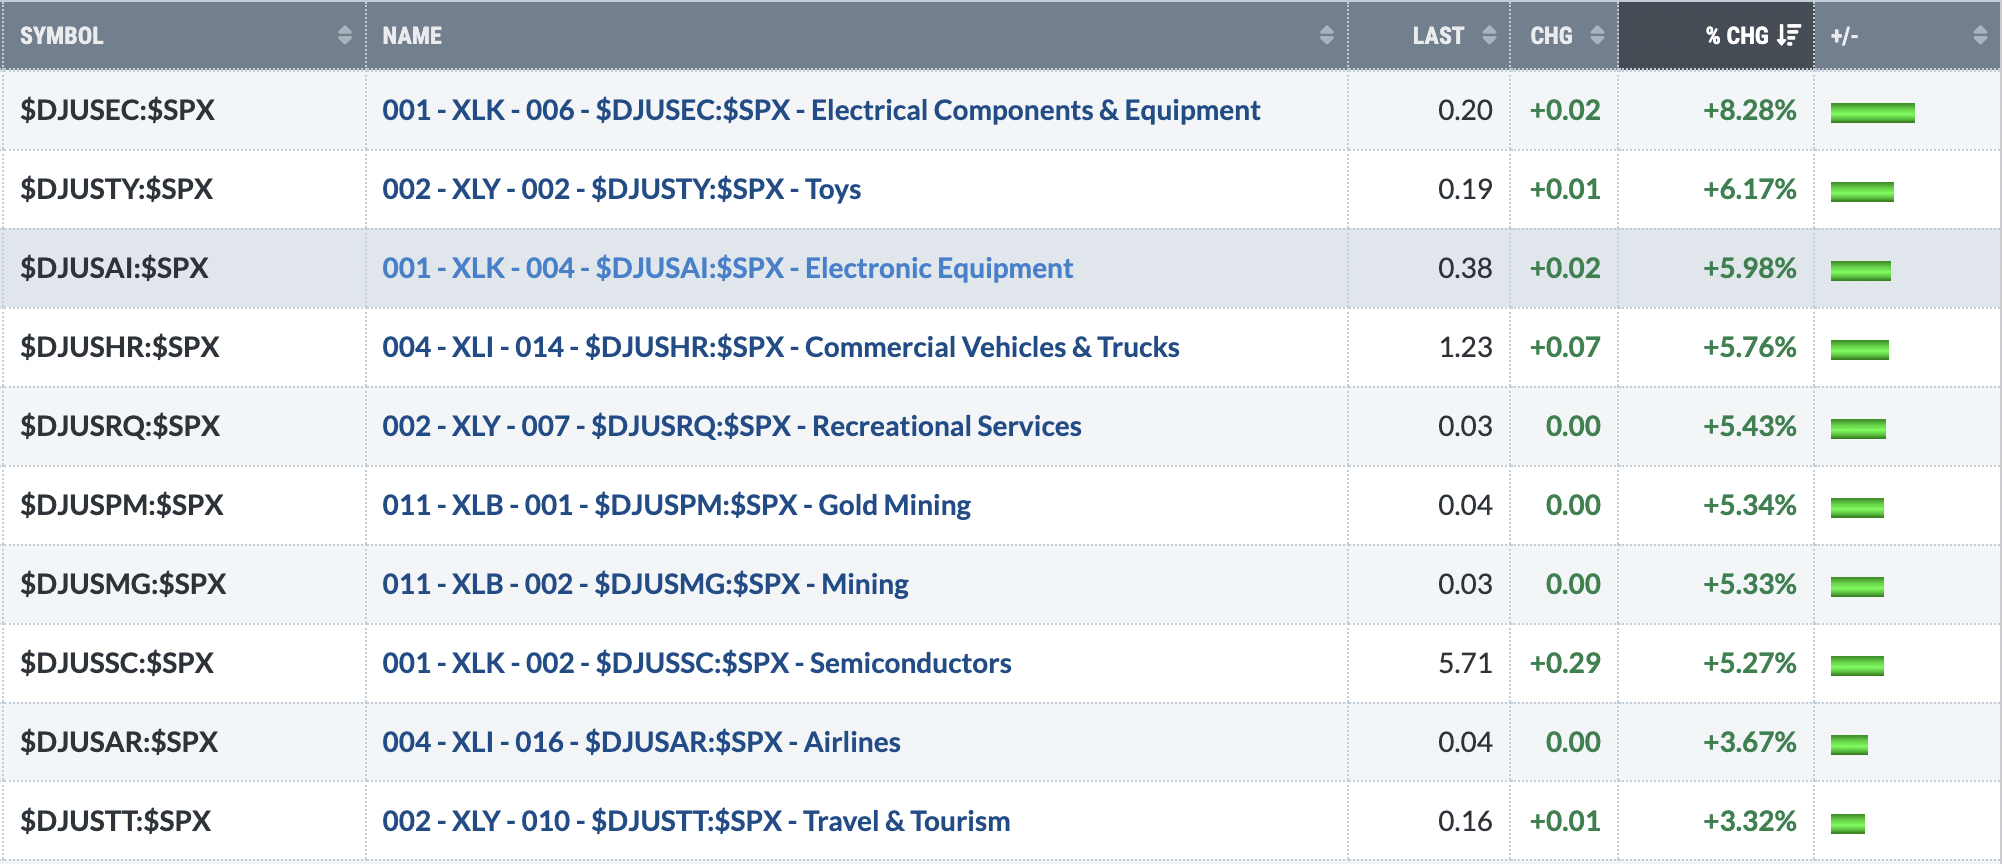
Top 10 Industries Last Week
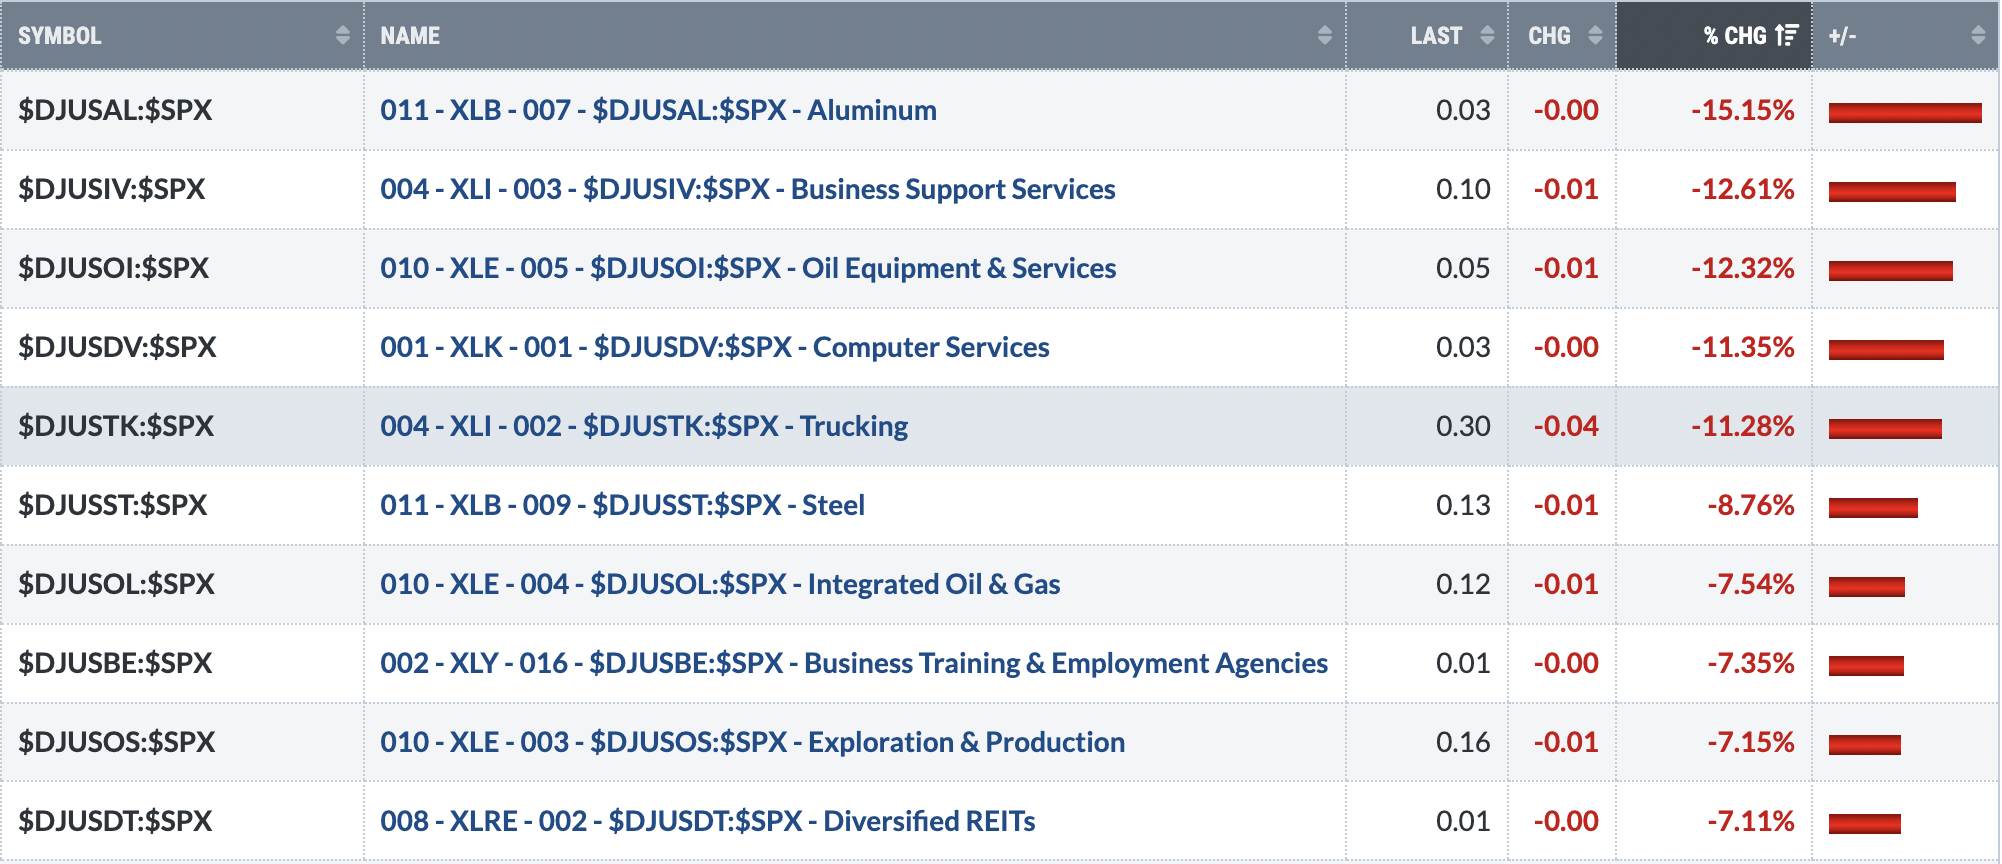
Bottom 10 Industries Last Week
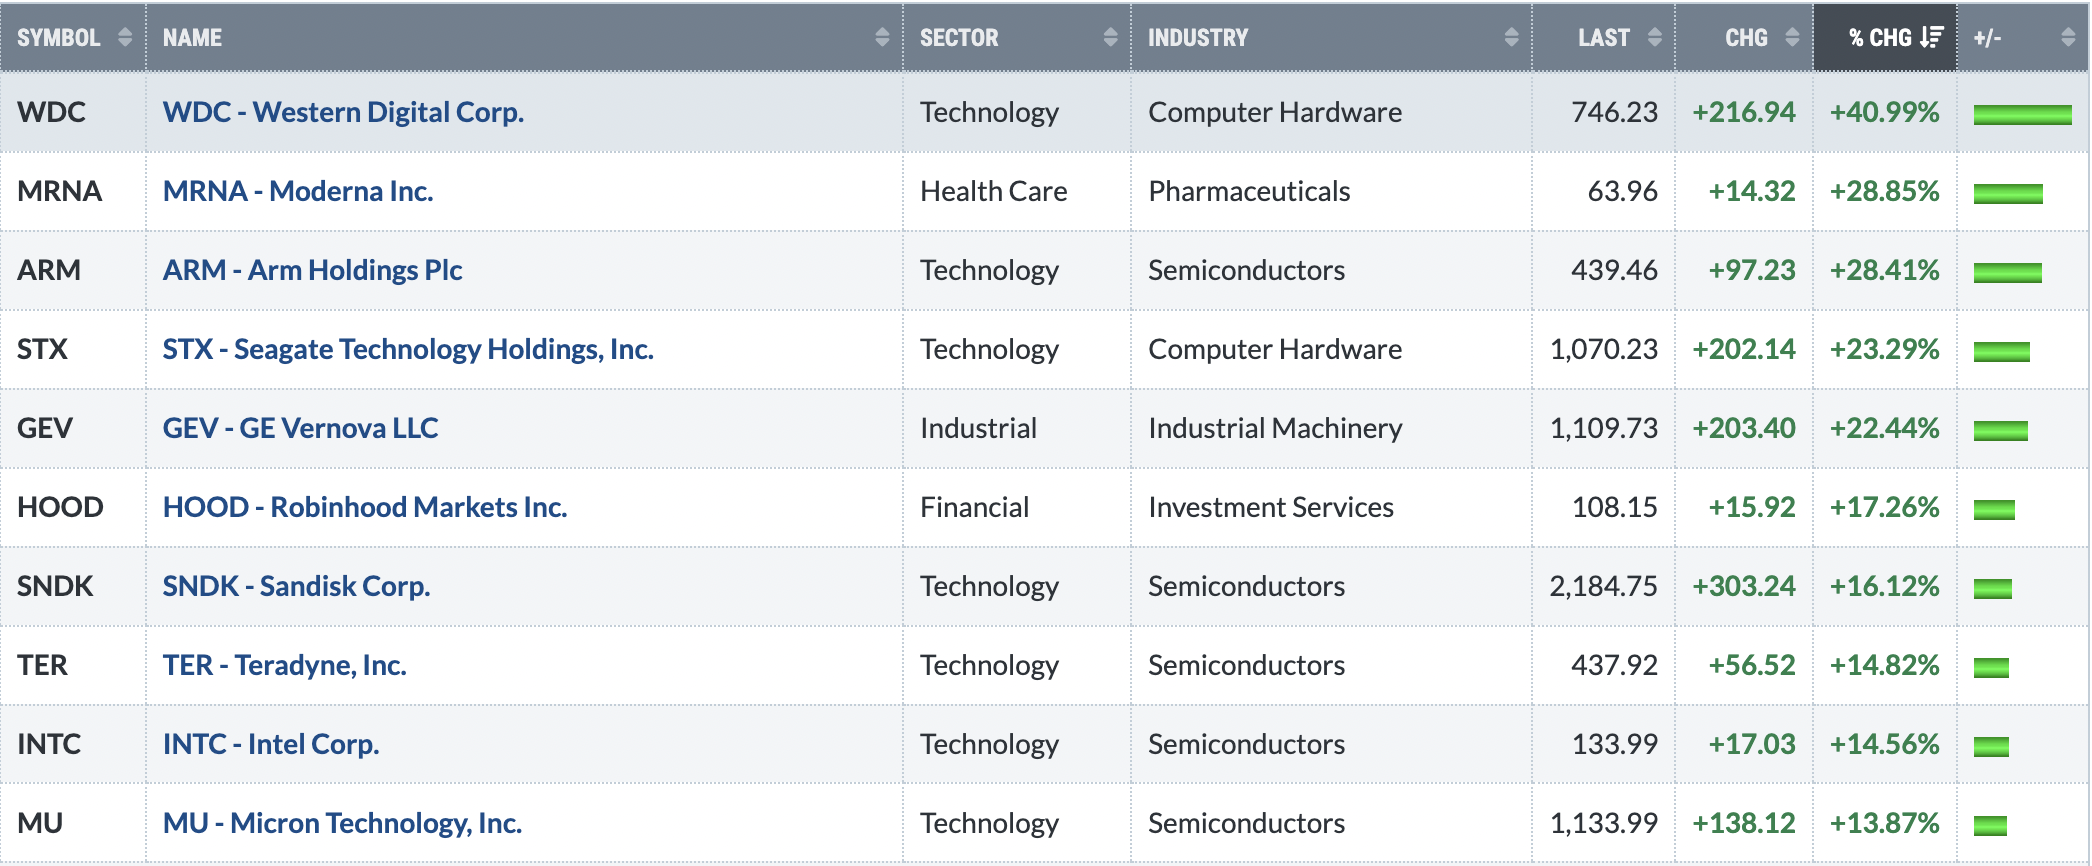
Top 10 Stocks - S&P 500/NASDAQ 100
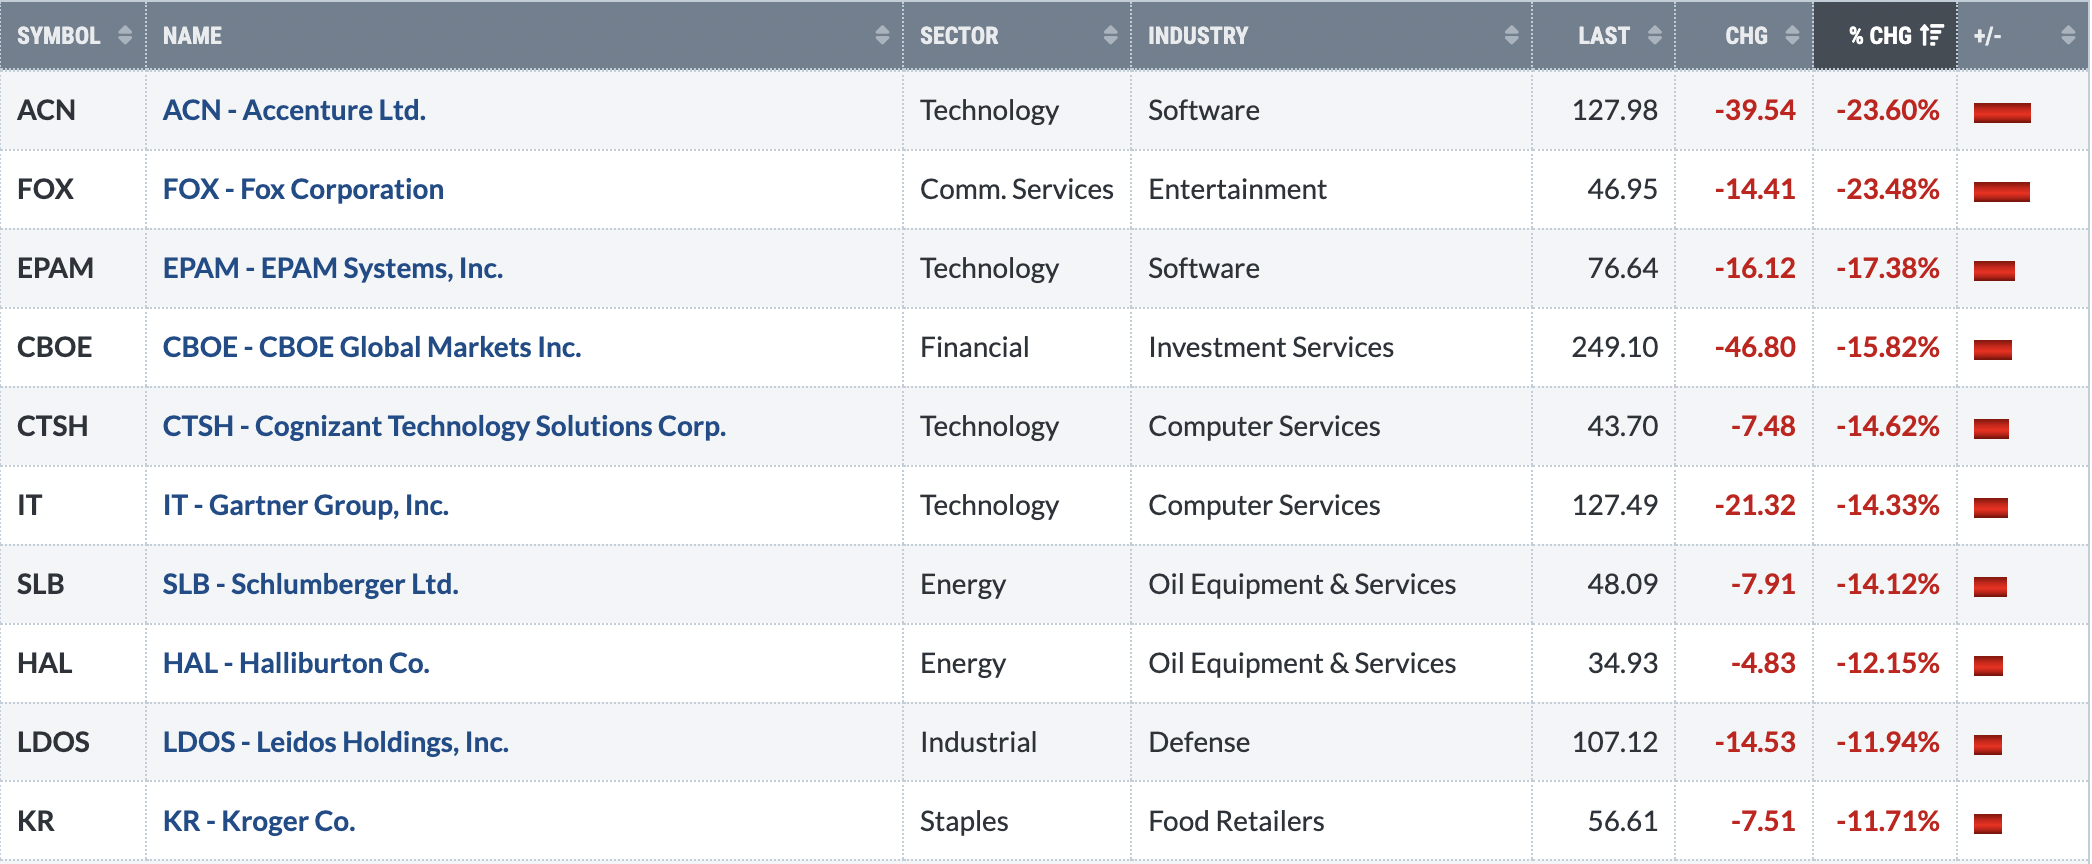
Bottom 10 Stocks - S&P 500/NASDAQ 100
Big Picture
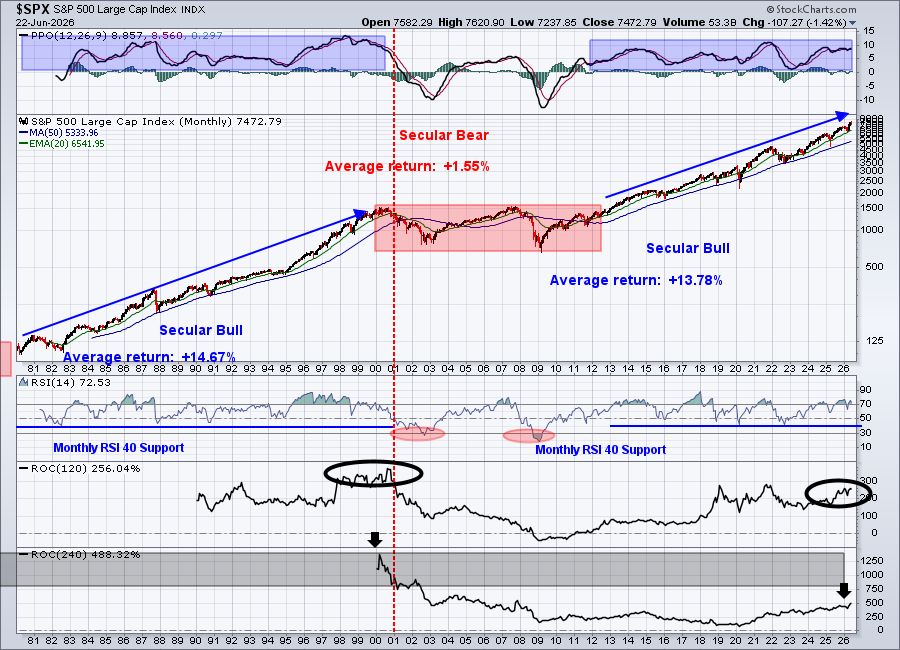
This chart doesn't change much, does it? If you're a long-time member of EB, then you know it's easy to remain on the long side as a long-term investor, if you concentrate on a chart like this one, instead of a 1-year chart. And you especially don't want to listen to all the noise in the headlines. Every "expert" in the world is trying to explain the positives and negatives and it definitely gets confusing.
Now, for a trader, this chart isn't all that useful.
But if you're a long-term investor, stick with this one chart and sleep better at night.
Sustainability Ratios
Here's the latest look at our key intraday ratios as we follow where the money is traveling on an INTRADAY basis (ignoring gaps):
QQQ:SPY
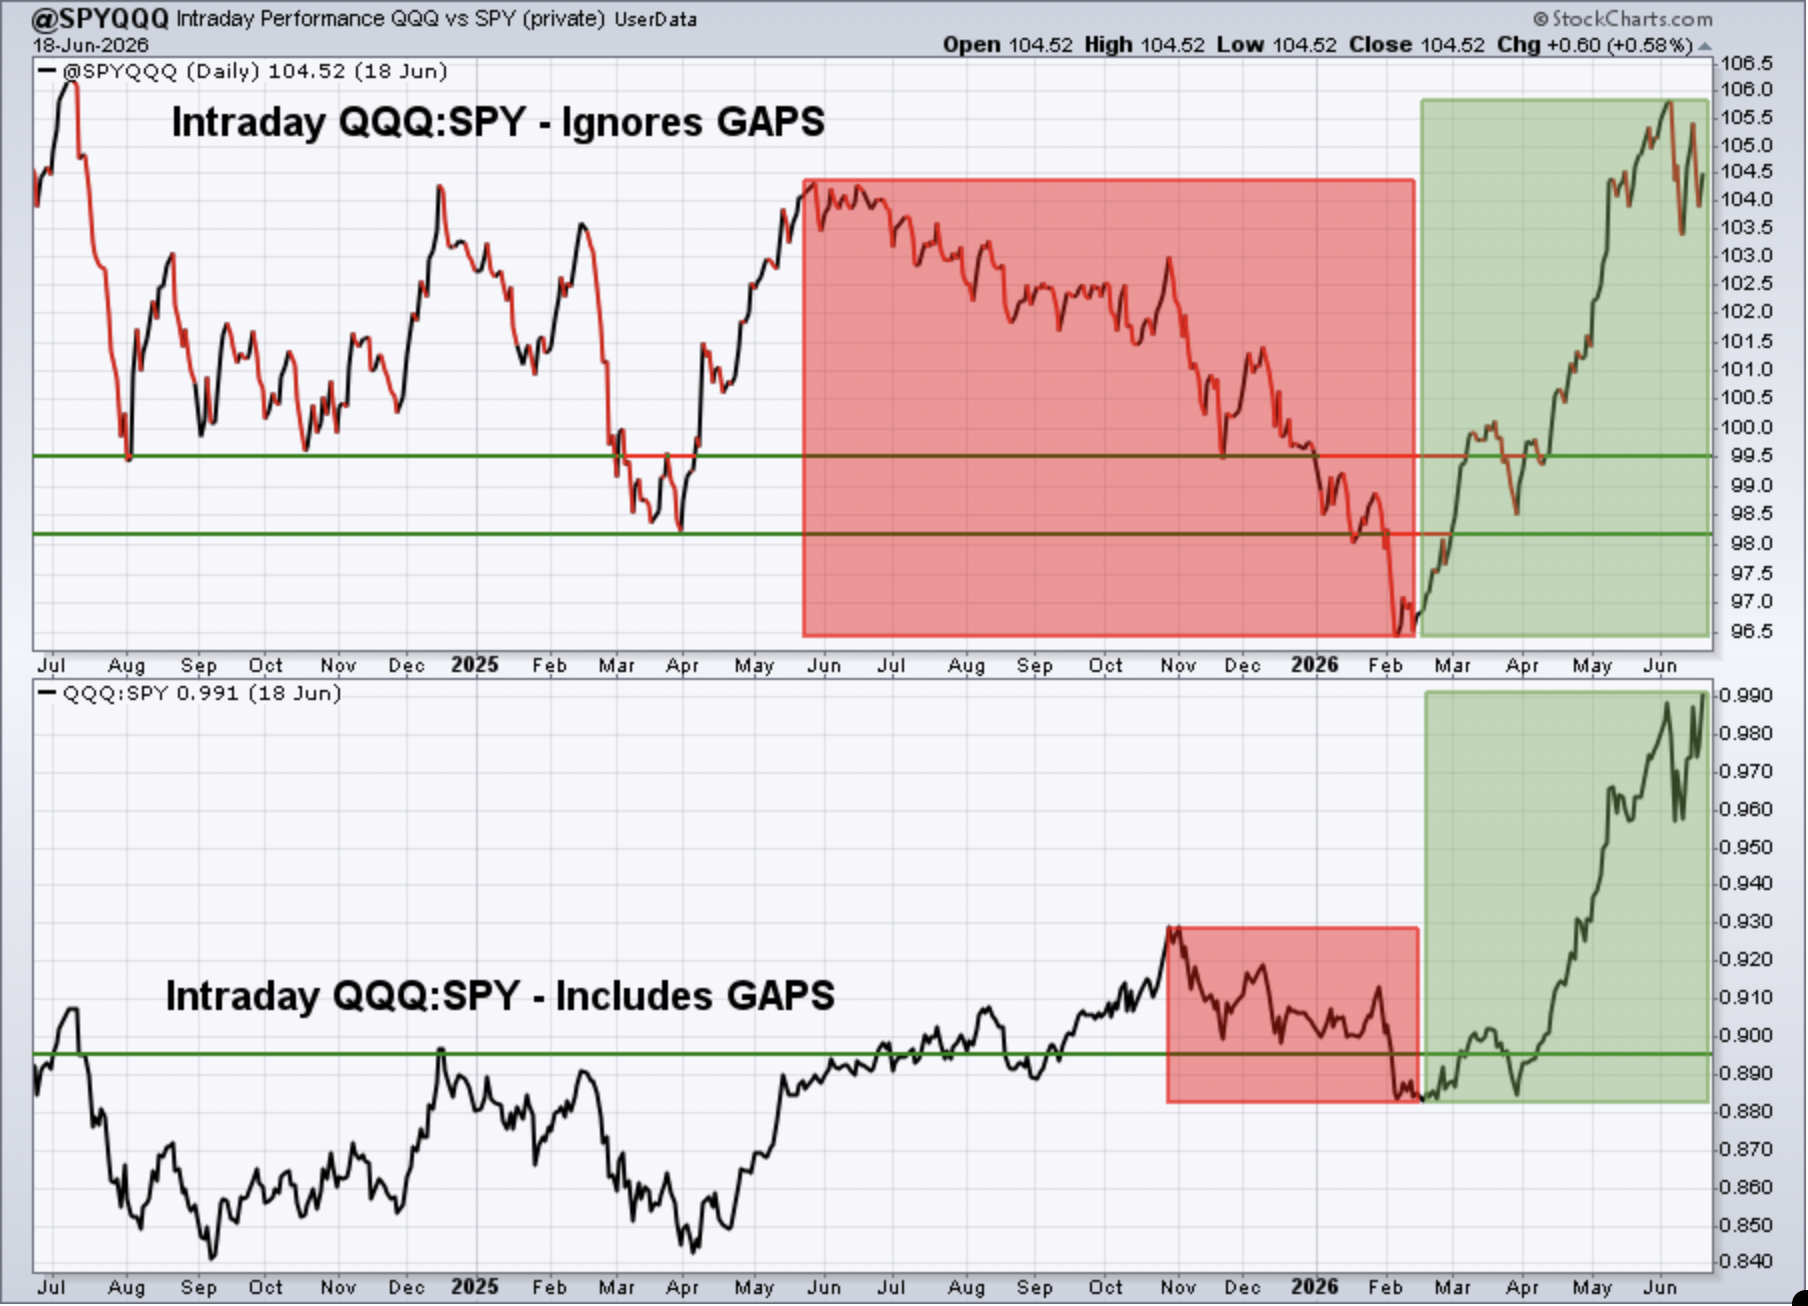
Keep in mind that the intraday analysis provided is a "work in progress". I continue to analyze this data to see if it helps provide us clues about calling market direction. It makes common sense to me that it should help in some sense, but it'll require a much longer-term study to determine its worth.
If we include gaps, the QQQ:SPY ratio broke out again last week, even though the benchmark S&P 500 did not. That's generally a pretty good sign. The intraday QQQ:SPY ratio, which excludes gaps and focuses entirely on what happens after the opening bell, continued to consolidate.
Nothing here is bearish.
IWM:QQQ
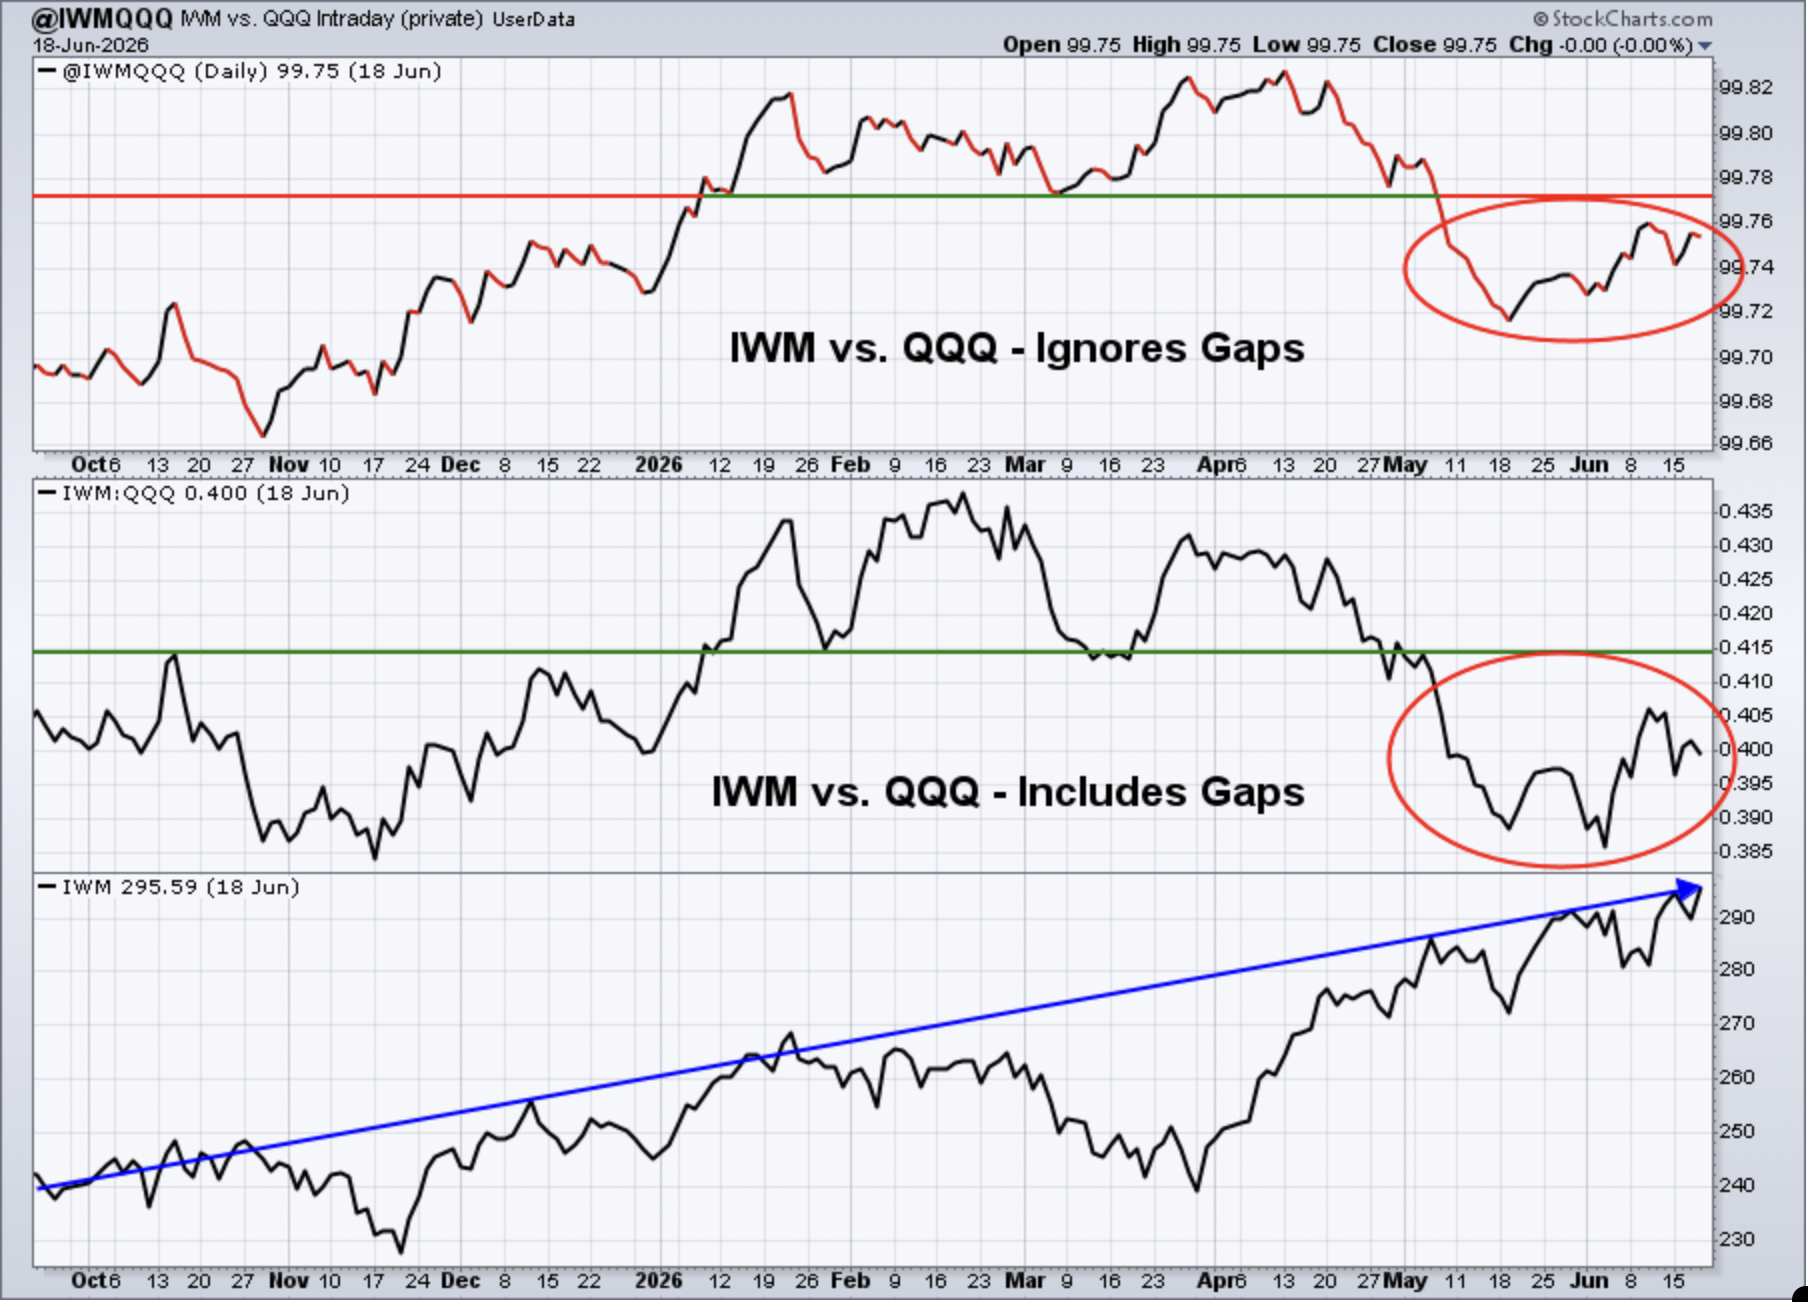
While small caps (IWM) broke out last week to an all-time high on its absolute chart, its relative performance vs. the large cap growth NASDAQ 100 index (QQQ is ETF that tracks this index) was simply okay, nothing special. The lack of clarity on the future direction of interest rates is weighing on small caps (on a relative basis) for now, in my opinion.
XLY:XLP
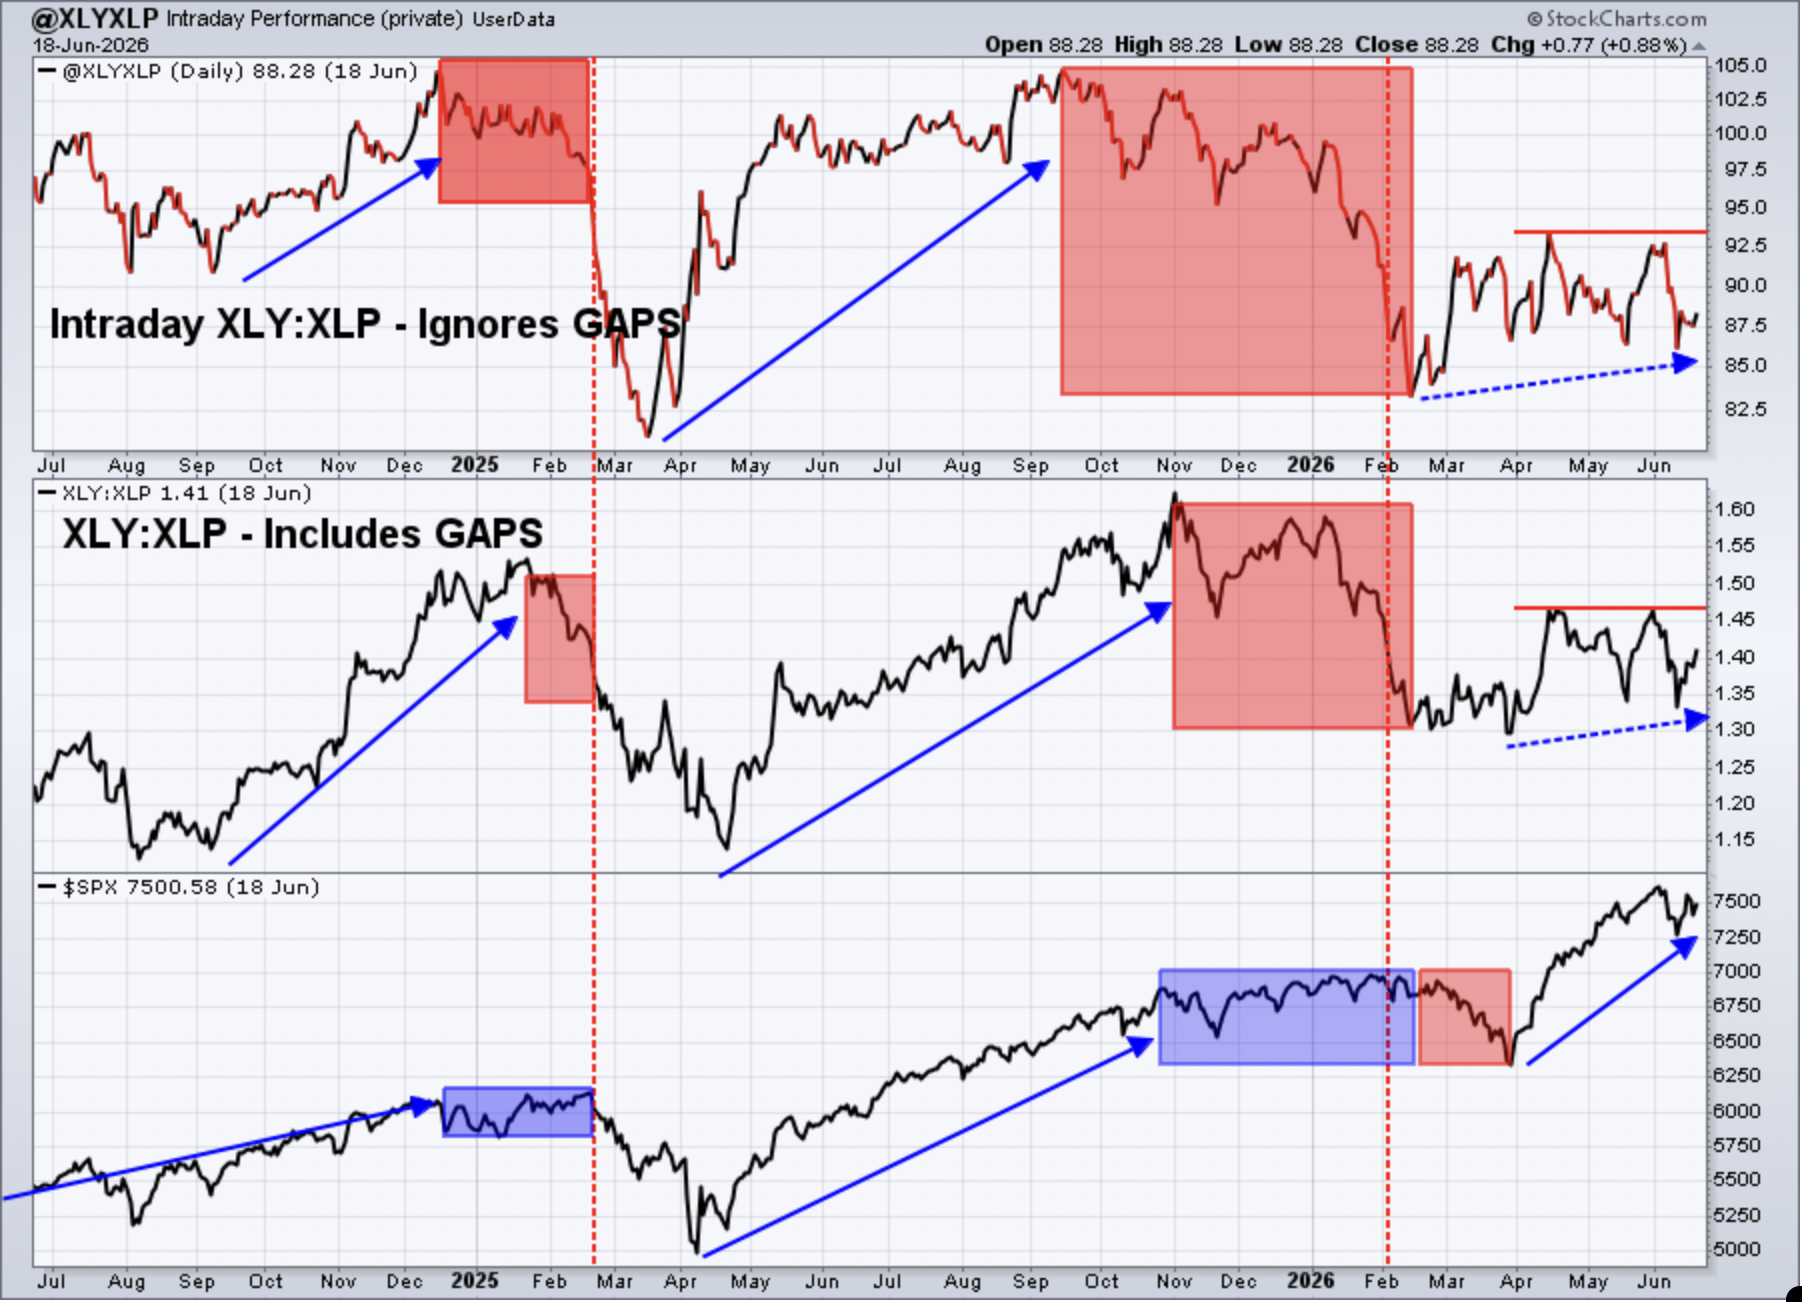
The consolidation in the XLY:XLP ratio continues for now. I don't view this ratio as either bullish or bearish. I grow much more cautious when the S&P 500 breaks out with this ratio declining. Currently, both the SPX and this ratio are trading sideways. Furthermore, even if I wanted to consider this ratio a bit bearish, none of my other sustainability ratios are performing that poorly. I don't like to force a bearish opinion, it should come naturally from simply looking at these charts.
Sentiment
5-day SMA ($CPCE)
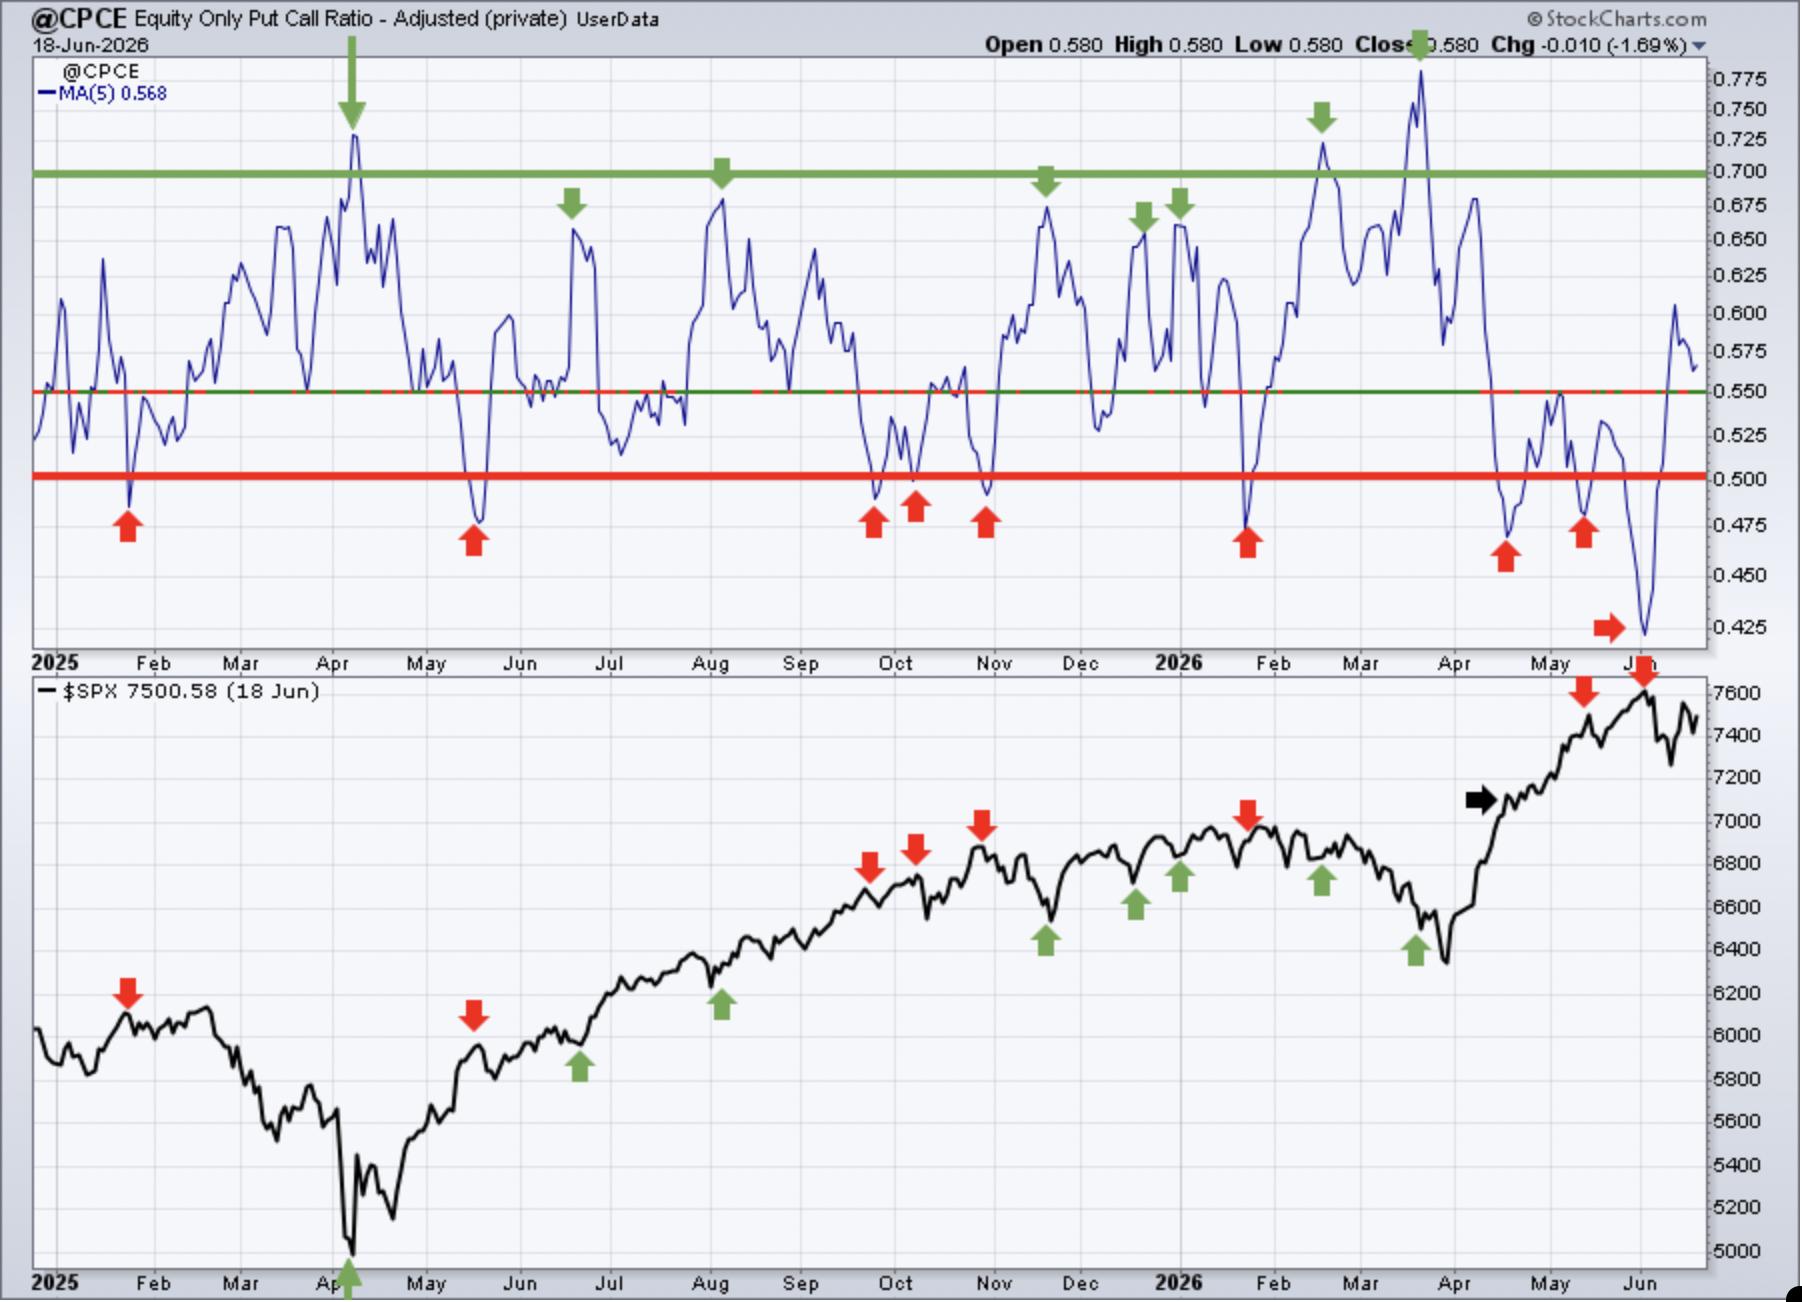
Sentiment indicators are contrarian indicators. When they show extreme bullishness, we need to be a bit cautious and when they show extreme pessimism, it could be time to become much more aggressive. Major market bottoms are carved out when pessimism is at its absolute highest level.
Now that the 5-day SMA of the CPCE has moved back into the .50s, there's really no directional clues being provided. It's neutral.
253-day SMA ($CPCE)
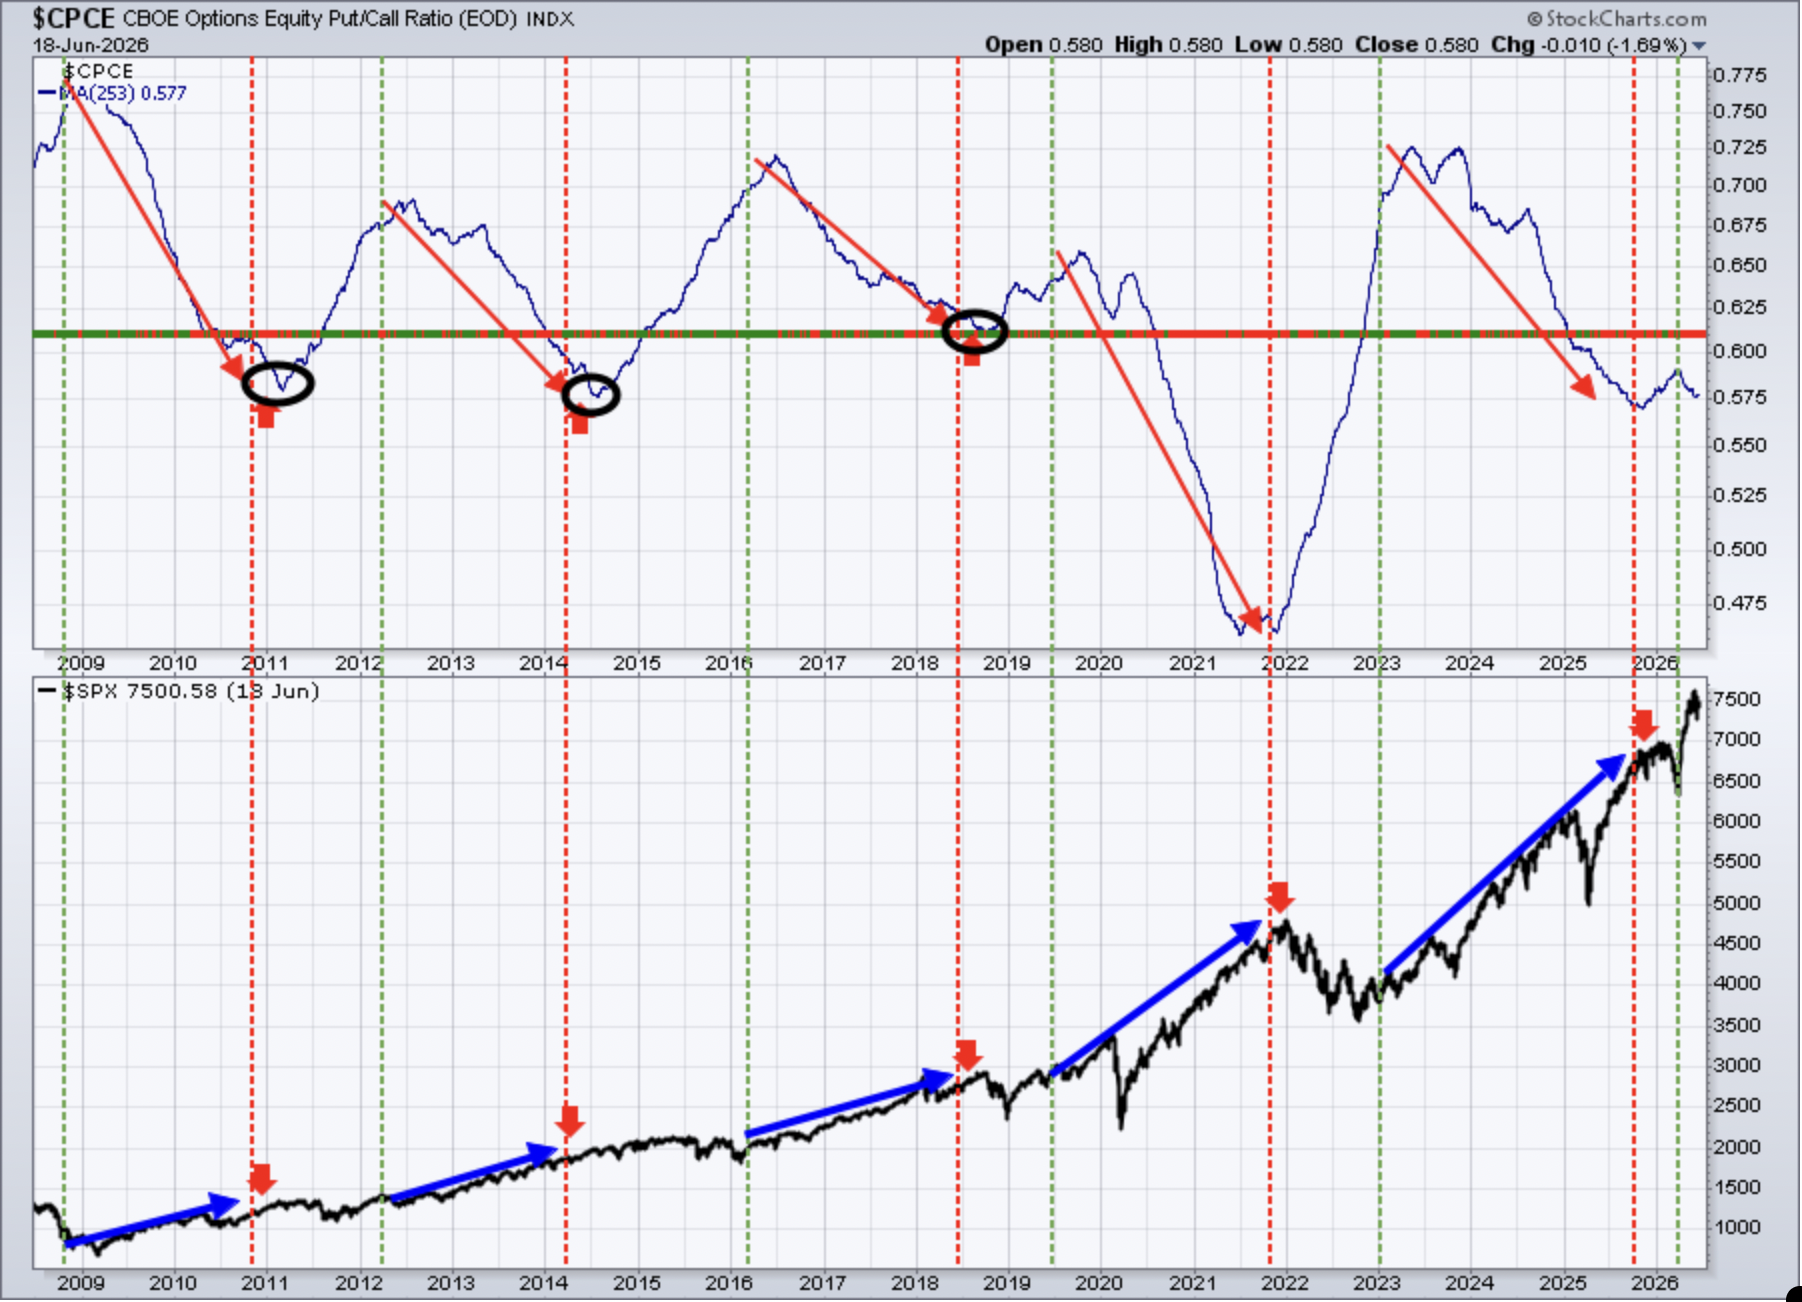
This longer-term 253-day SMA of the CPCE is our "ocean-liner" signal, unlike our short-term speedboat indicator. Any significant change in direction in this 253-day CPCE, in the past, has had profound effects on the S&P 500.
The fact that this long-term 253-day SMA has rolled back over and is now moving lower is bullish. If it breaks to a new low, clearing the Q4 2025 low, it would only add more confidence to the secular bull market scenario moving forward.
Long-Term Trade Setups
Since beginning this Weekly Market Report in September 2023, I've discussed the long-term trade candidates below that I really like. Generally, these stocks have excellent long-term track records, and many pay nice dividends that mostly grow every year. Only in specific cases (exceptions) would I consider a long-term entry into a stock that has a poor or limited long-term track record and/or pays no dividends. I try to review the long-term picture once a month, and below is how I viewed each chart as of Friday, May 29th:
- JPM - trending above its 20-day EMA, bullish
- BA - since the 2020 drop, overhead resistance has been set at 270-275
- FFIV - broke to all-time high in May
- MA - steady decline has stock approaching its 50-month SMA; nice entry spot
- GS - relative leader in space, setting new all-time highs, bullish
- FDX - setting new records, despite AMZN announcement to compete
- AAPL - also setting new records, looks excellent
- CHRW - consolidating in wide 150-200 range after 2025 breakout
- JBHT - keeps trending up after breakout to clear years of consolidation
- STX - astounding rally off April 2025 low continues
- HSY - sloppy cup with handle? If so, needs to hold 180 support
- DIS - lengthy consolidation from 80-125 now 4 years deep
- MSCI - nice advance past two months, long-awaited breakout coming?
- SBUX - another long-time consolidation stock, needs to clear 112-114
- KRE - long-term rally still intact, despite recent struggles
- ED - watching support near its 20-month EMA just above 100
- AJG - monthly RSI has dipped below 40 for only the second time since 2009
- NSC - cup with handle breakout in mid-2025, measurement to 360 or so
- RHI - has bottom finally been found? Huge dividend yield, if dividend not cut
- ADM - purchase back in 40s now looks genius as it approaches a double in a yr
- BG - uptrending in all-time high territory
- CVS - tested all-time high resistance, but then failed; still remains solid
- HRL - dividend aristocrat reversed nicely in May; bottom in?
- DE - pulling back to approach rising 20-month EMA
- LULU - pierced the 2020 pandemic low of 128.84 and bounced
- TTD - even with a much stronger software group, TTD is trading poorly
- META - trading right around its 20-month EMA, likely solid entry
- ADBE - strengthening with first MAJOR test at declining 20-month EMA
- KMB - another dividend aristocrat, looking for support in the 90s to hold
- ORCL - jumped 40% in May, suggesting our entry earlier was a smart one
- ABBV - very nice recovery off 20-month EMA test
- MCD - trades 6 bucks above its 50-month SMA; hasn't closed beneath this MA in 23 years
- MKC - added last week; searching for a bottom with its monthly RSI at 32
Keep in mind that our Weekly Market Reports favor those who are more interested in the long-term market picture. Therefore, the list of stocks above are stocks that we believe are safer (but nothing is ever 100% safe) to own with the long-term in mind. Nearly everything else we do at EarningsBeats.com favors short-term momentum trading, so I wanted to explain what we're doing with this list and why it's different.
Also, please keep in mind that I'm not a Registered Investment Advisor (and neither is EarningsBeats.com nor any of its employees) and am only providing (mostly) what I believe to be solid dividend-paying stocks for the long term. Companies periodically go through adjustments, new competition, restructuring, management changes, etc. that can have detrimental long-term impacts. Neither the stock price nor the dividend is ever guaranteed. I simply point out interesting stock candidates for longer-term investors. Do your own due diligence and please consult with your financial advisor before making any purchases or sales of securities.
Looking Ahead
Upcoming Earnings
The following list of companies is NOT a list of all companies scheduled to report quarterly earnings, however, just key reports, so please be sure to check for earnings dates of any companies that you own. Any company in BOLD represents a stock in one of our portfolios and the amount in parenthesis represents the market capitalization of each company listed:
- Monday: None
- Tuesday: FDX ($78 billion), CCL ($38 billion)
- Wednesday: MU ($1.28 trillion), PAYX ($35 billion)
- Thursday: None
- Friday: None
Key Economic Reports
- Monday: None
- Tuesday: None
- Wednesday: May new home sales, May leading economic indicators
- Thursday: Initial jobless claims, Q1 GDP (final revision), May personal income & spending, May PCE index, May durable goods orders
- Friday: June consumer sentiment
Historical Data
I'm a true stock market historian. I am absolutely PASSIONATE about studying stock market history to provide us more clues about likely stock market direction and potential sectors/industries/stocks to trade. While I don't use history as a primary indicator, I'm always very aware of it as a secondary indicator. I love it when history lines up with my technical signals, providing me with much more confidence to make particular trades.
Below you'll find the next two weeks of historical data and tendencies across the three key indices that I follow most closely. The percentage for each calendar day represents the annualized return for that day. An example of how this is calculated is reflected next to the first day under the S&P 500 and in parenthesis:
S&P 500 (since 1950)
- Jun 22: -25.23% (Ex: cumulative gains =
-5.28% over 53 trading days since 1950. -5.28% x 253/53 = -25.23%) - Jun 23: -4.16%
- Jun 24: -35.49%
- Jun 25: -14.47%
- Jun 26: -69.28%
- Jun 27: +2.62%
- Jun 28: +41.58%
- Jun 29: +6.42%
- Jun 30: +36.16%
- Jul 1: +70.86%
- Jul 2: +18.71%
- Jul 3: +80.16%
- Jul 4: +0.00% (Market closed)
- Jul 5: +39.40%
NASDAQ (since 1971)
- Jun 22: -33.43%
- Jun 23: +19.56%
- Jun 24: -26.05%
- Jun 25: -9.22%
- Jun 26: -32.16%
- Jun 27: +1.35%
- Jun 28: +81.88%
- Jun 29: +51.99%
- Jun 30: +74.50%
- Jul 1: +56.06%
- Jul 2: -40.11%
- Jul 3: +52.86%
- Jul 4: +0.00% (Market closed)
- Jul 5: +7.04%
Russell 2000 (since 1987)
- Jun 22: -75.31%
- Jun 23: -7.82%
- Jun 24: -117.15%
- Jun 25: +15.68%
- Jun 26: -10.46%
- Jun 27: +44.32%
- Jun 28: +122.28%
- Jun 29: +66.61%
- Jun 30: +95.47%
- Jul 1: +29.36%
- Jul 2: -108.70%
- Jul 3: +42.54%
- Jul 4: +0.00% (Market closed)
- Jul 5: -4.89%
The S&P 500 data dates back to 1950, while the NASDAQ and Russell 2000 information date back to 1971 and 1987, respectively.
Final Thoughts
Small caps (IWM) managed to eke out new all-time highs last week, while we saw further consolidation in the S&P 500 and NASDAQ 100. Crude oil ($WTIC, -9.75%) tumbled to close well beneath key price support near the $84 per barrel level. Crude oil bounced a bit early in today's session, but has retreated again this afternoon, adding to last week's big drop.
Here's what I'll be thinking about this week:
The Fed. New Fed Chair Kevin Warsh officially began his term on May 22nd and, last week, presided over his first FOMC meeting. He put his stamp on this new era by significantly cutting the wording in the Fed statement. Most market watchers widely believe the Fed's communication regarding future policy will be drastically reduced. At this latest meeting, the Fed Chair refrained from giving his interest rate forecast (dot plot), with others split 9 to 9 regarding a potential rate hike later in 2026.
Options Max Pain. Today's weakness isn't all that unusual for the Monday that follows monthly options expiration Friday. In fact, I routinely talk about the bearishness of this day as it's been the worst-performing day of the calendar month over the past 76 years, dating back to 1950. That's an interesting stat for traders, but has little impact on long-term investors.
Technical Conditions and MU Earnings. There are few earnings scheduled this week, although the Micron Technology, Inc. (MU) earnings will be watched closely after MU's massive run higher in 2026. MU has more than quadrupled in 2026, so it will need a near-perfect report to keep the current momentum going. Its excellent relative strength suggests there will be much positivity coming out of this report. Semiconductors ($DJUSSC) remain the leading industry group, so how MU goes could determine a great deal about how well the overall market performs this week.
Seasonality. We have another week to navigate before historical tailwinds return. Generally speaking, U.S. stocks tend to move higher into initial quarterly earnings reports, kicked off by the large money center banks in mid-July. It's difficult to say if we'll see that pattern again, but I did want to mention that upcoming seasonal strength.
Happy trading!
Tom