
EB Weekly Market Report - Monday, June 29, 2026
ChartLists/Spreadsheets
The following ChartLists/Spreadsheets were updated over the weekend and have been updated on our website:
- Strong Earnings (SECL)
- Strong Future Earnings (SFECL)
- Raised Guidance (RGCL)
- Bullish Trifecta (BTCL)
- Short Squeeze (SSCL)
- Leading Stocks (LSCL)
- Matt's Hot Stocks (HTCL)
The above ChartLists and the Key Manipulation spreadsheet have been updated through Friday, June 26th. You can view and/or download these ChartLists from our website, and also read about them to gain a better understanding of how they can help in your trading success.
Weekly Market Recap
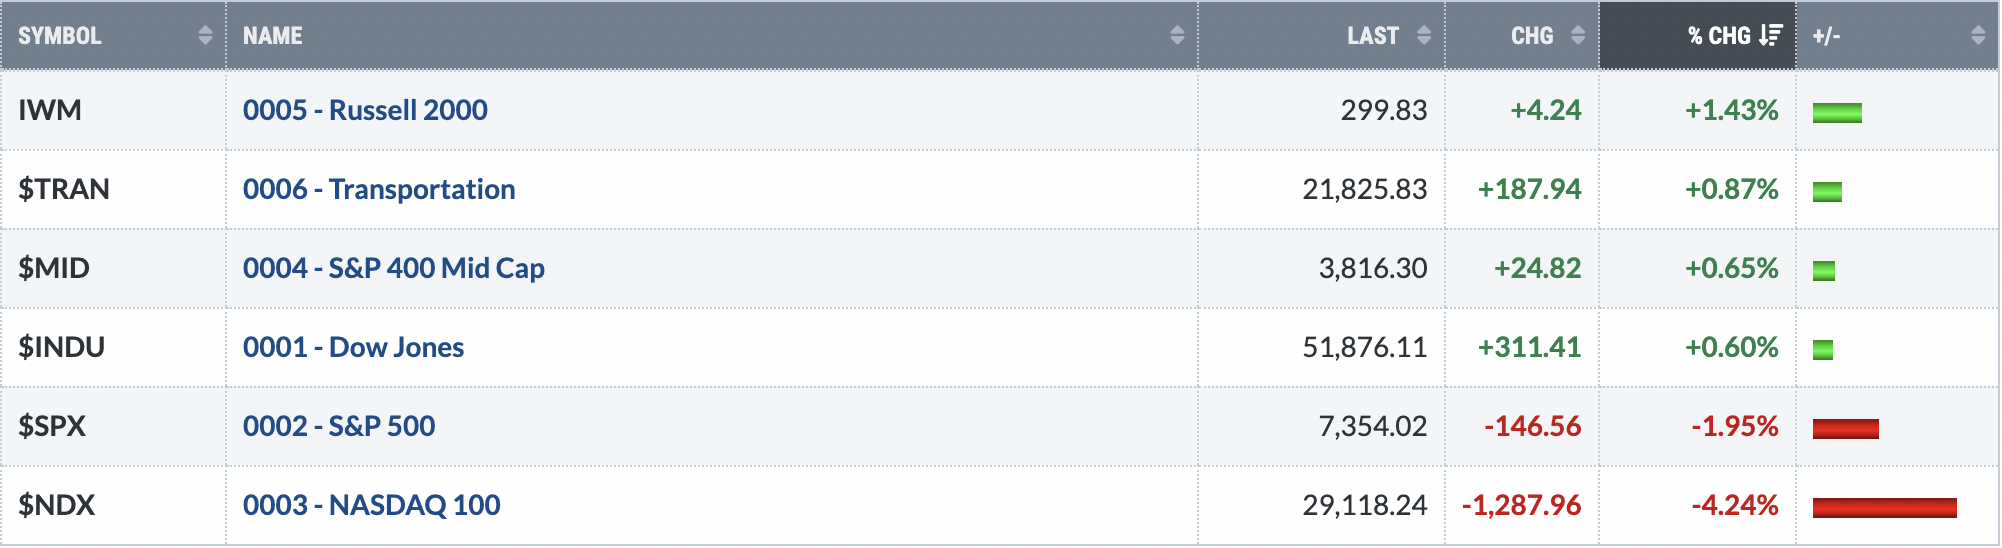
Major Indices
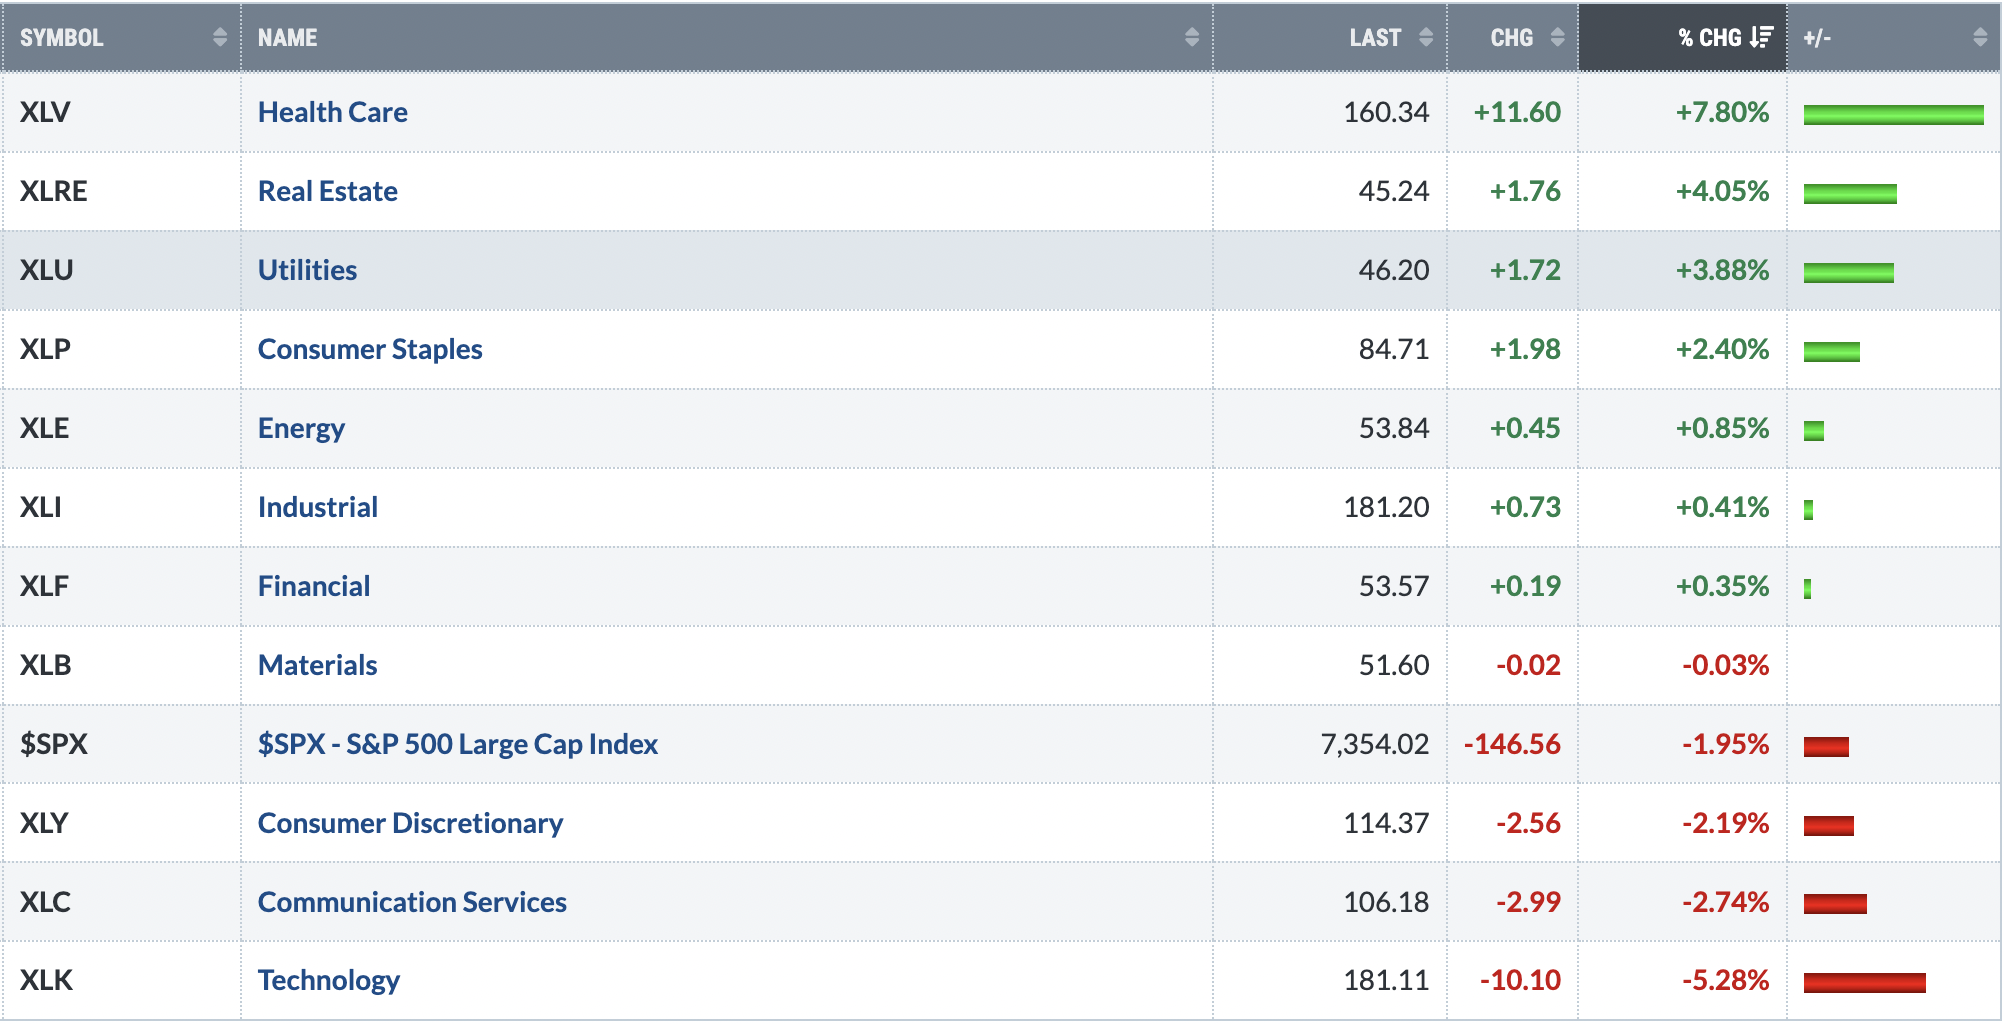
Sectors
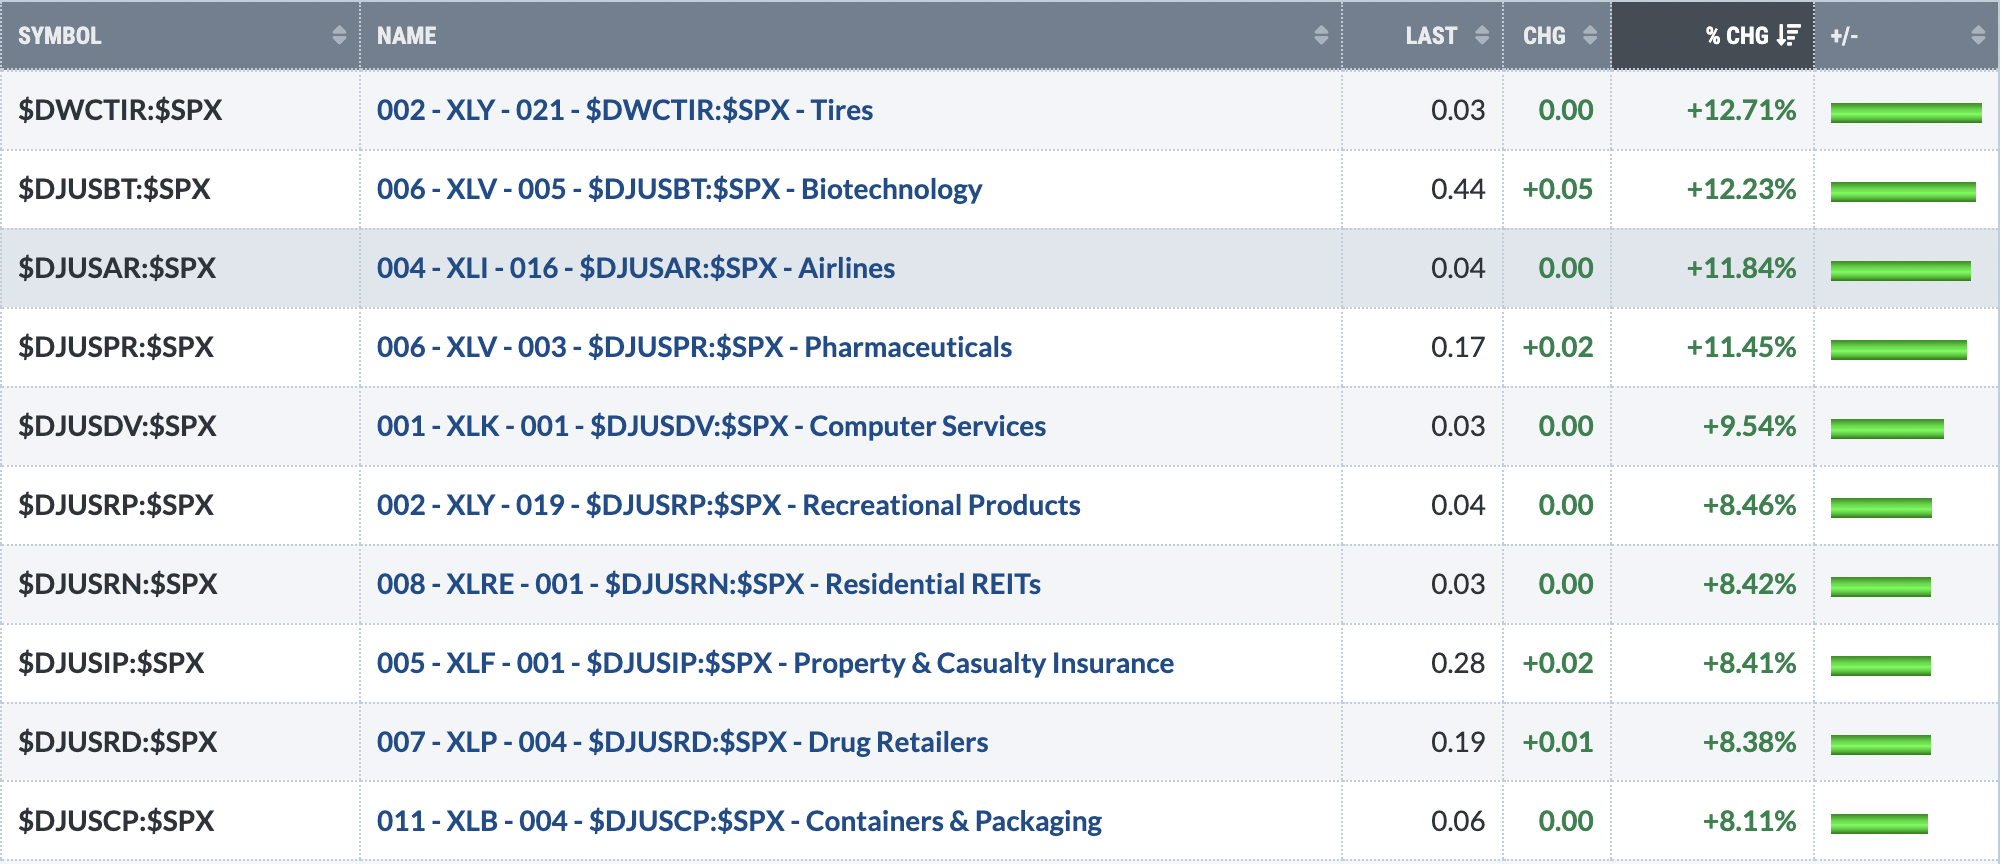
Top 10 Industries Last Week
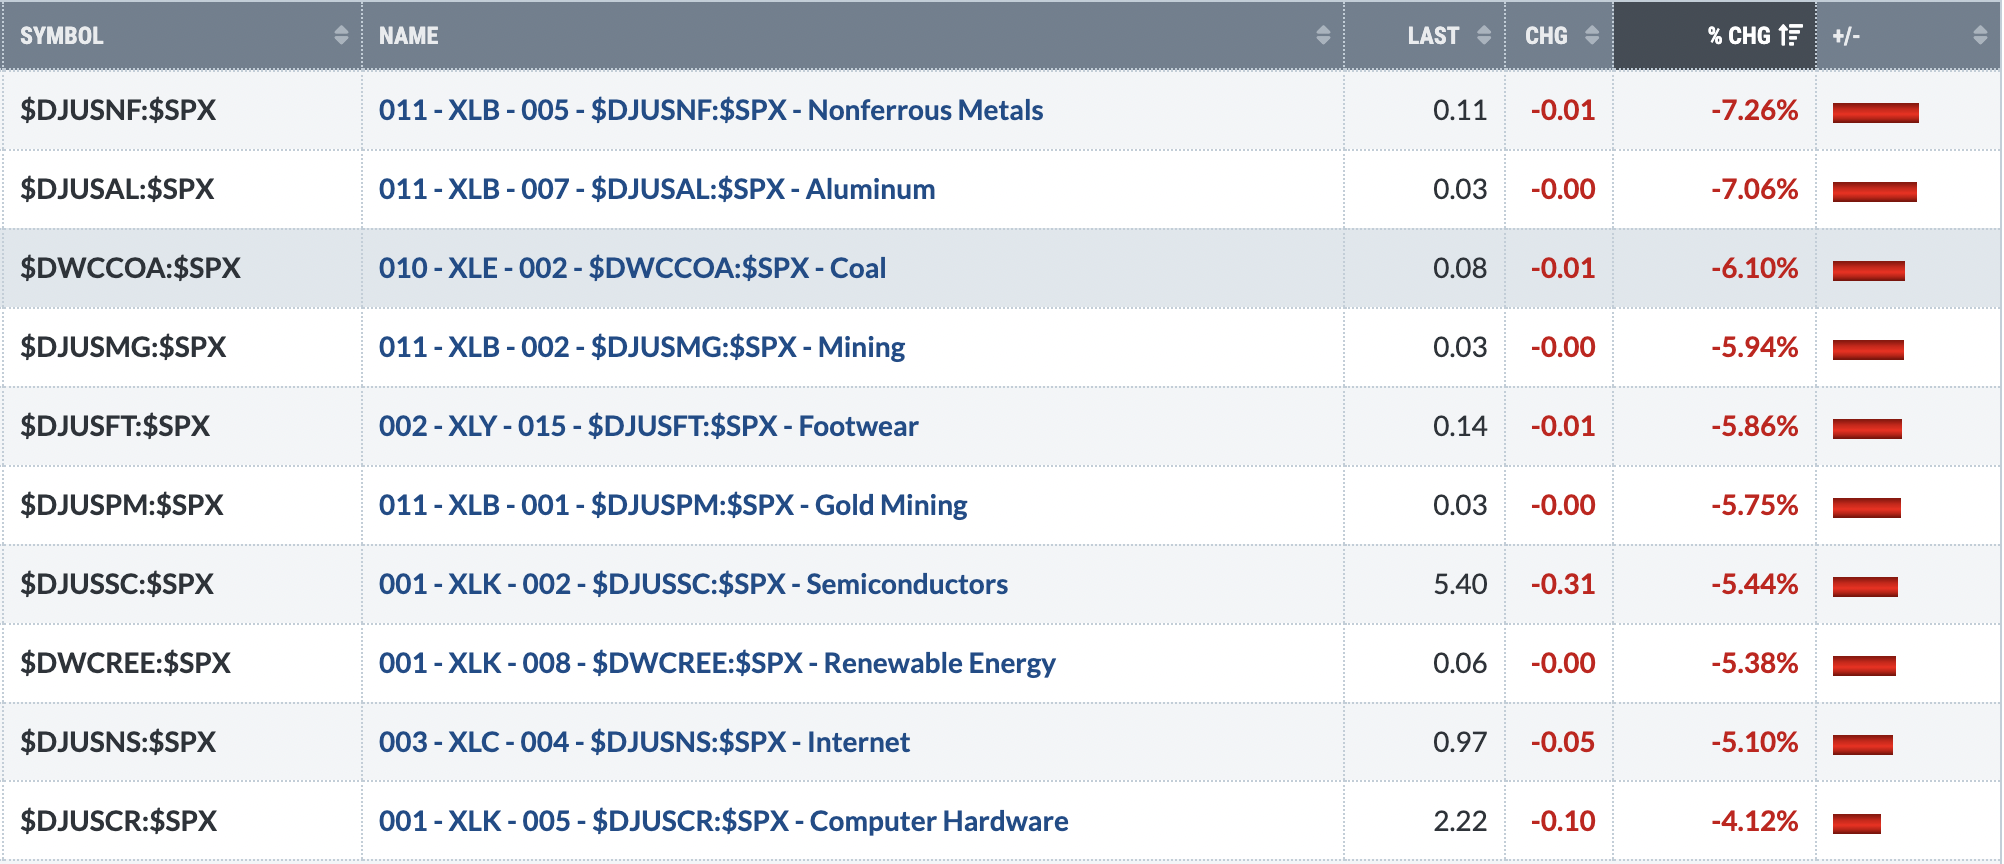
Bottom 10 Industries Last Week
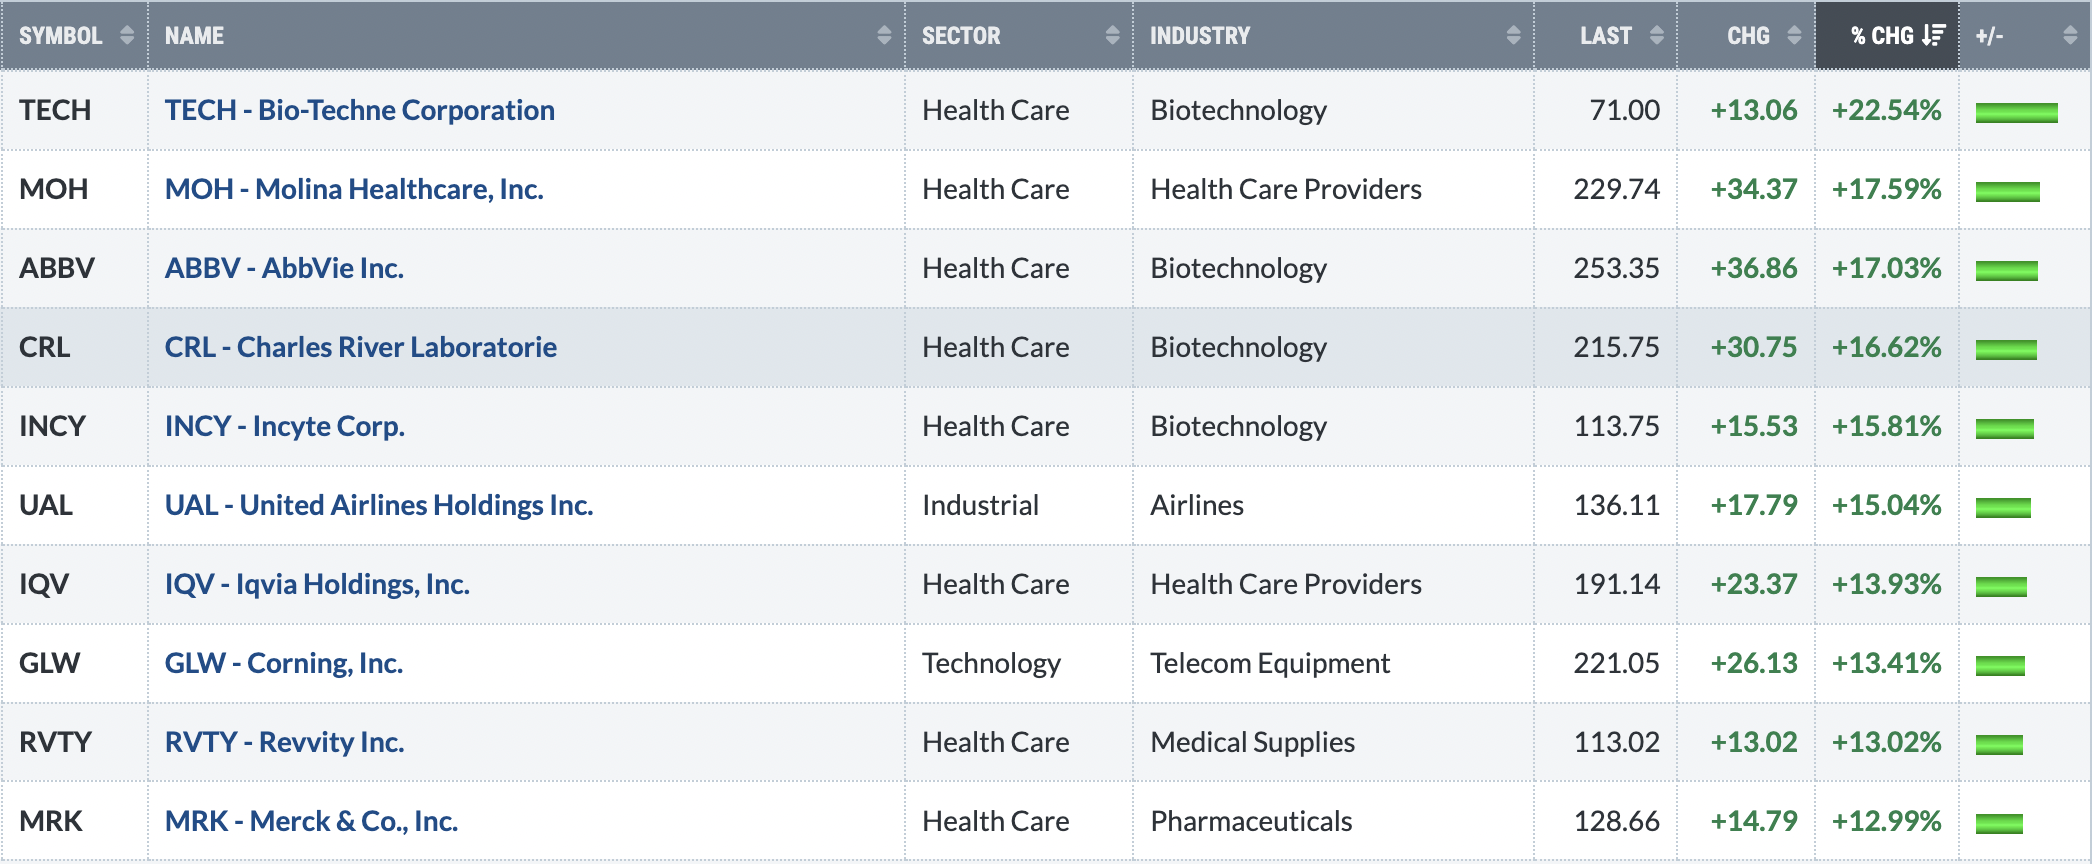
Top 10 Stocks - S&P 500/NASDAQ 100
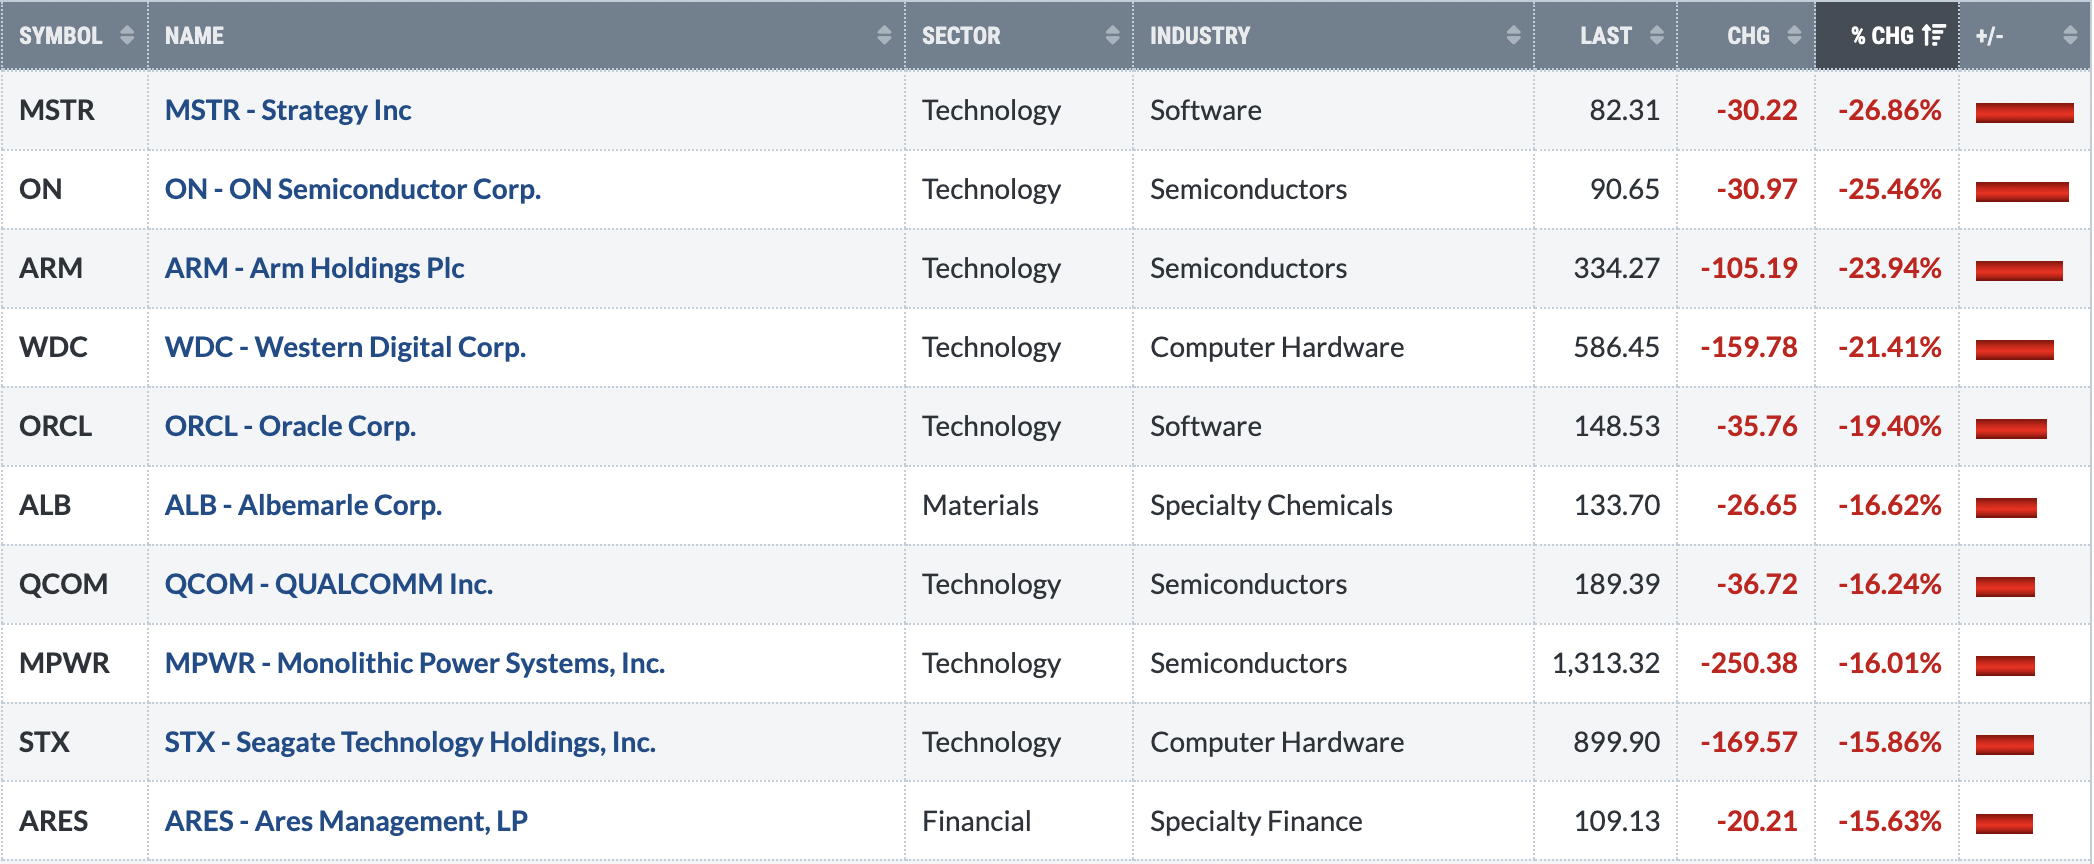
Bottom 10 Stocks - S&P 500/NASDAQ 100
Big Picture
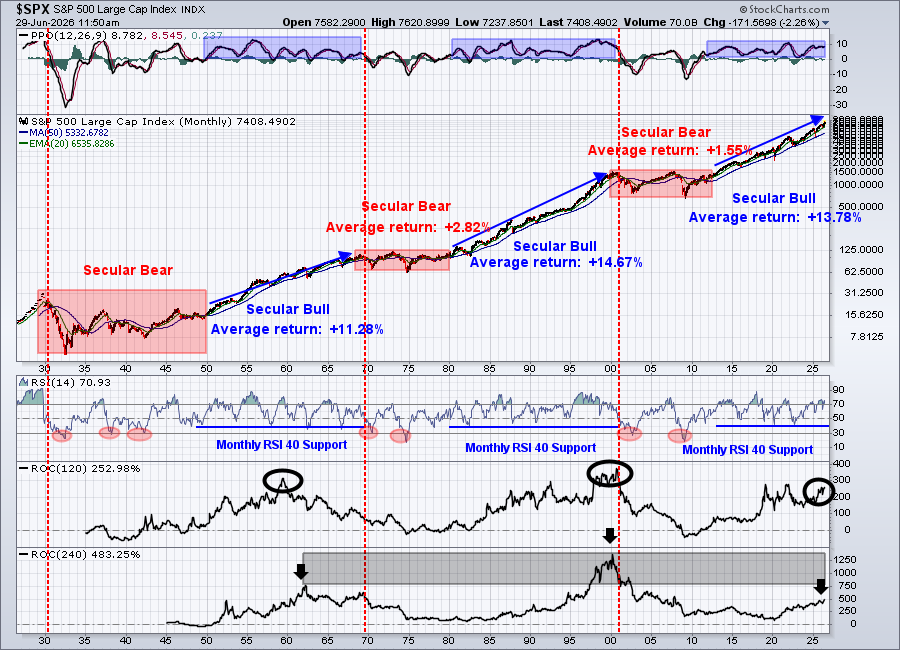
The secular bull market uptrend remains perfectly intact and doesn't get swayed by all of the short-term news stories and hype. It's always comforting to look at this Big Picture chart to start every week.
Sustainability Ratios
Here's the latest look at our key intraday ratios as we follow where the money is traveling on an INTRADAY basis (ignoring gaps):
QQQ:SPY
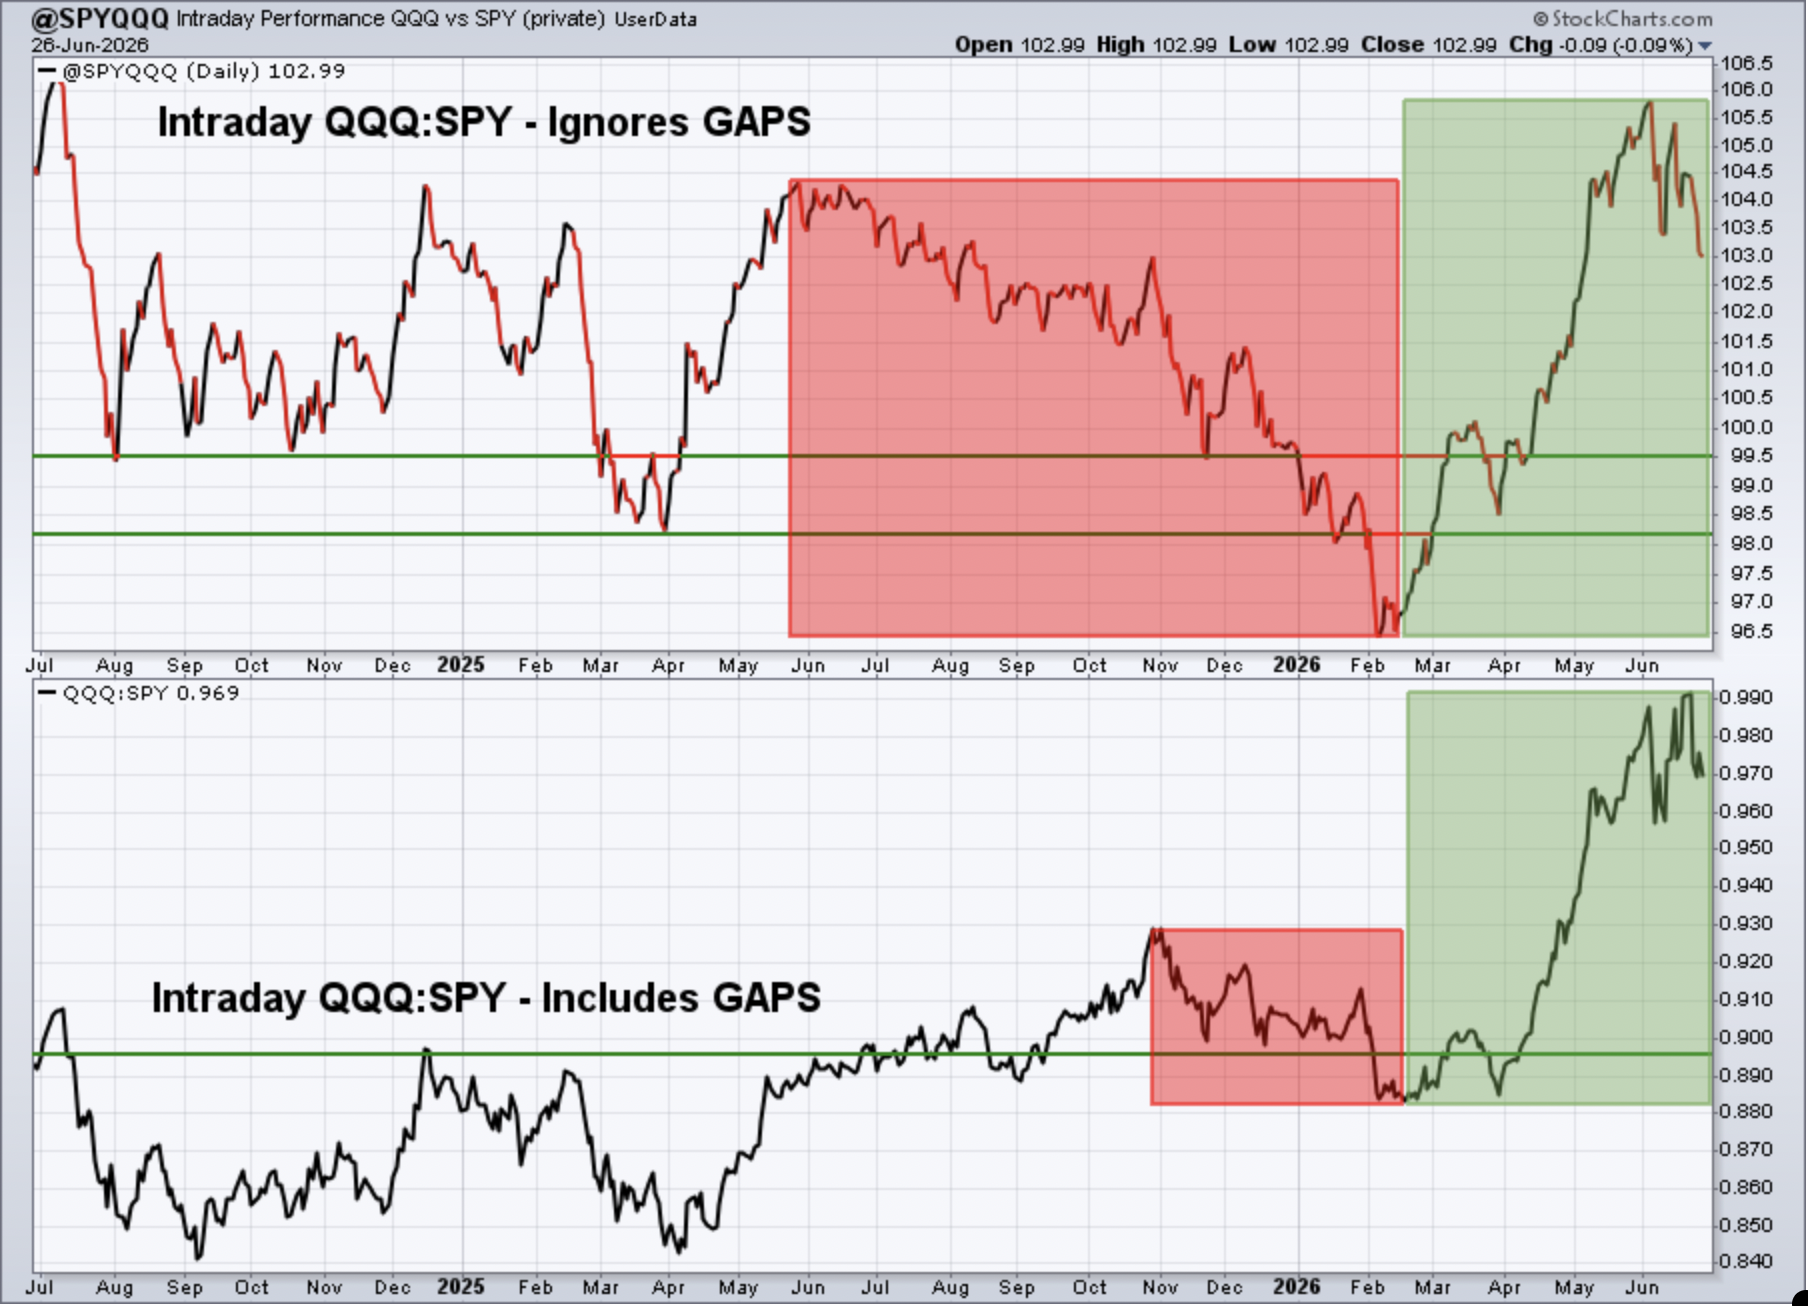
Keep in mind that the intraday analysis provided is a "work in progress". I continue to analyze this data to see if it helps provide us clues about calling market direction. It makes common sense to me that it should help in some sense, but it'll require a much longer-term study to determine its worth.
We saw more consolidation in this ratio, but after the straight-up move we saw in the relative performance of the QQQ, that's not anything to worry about at this point.
IWM:QQQ
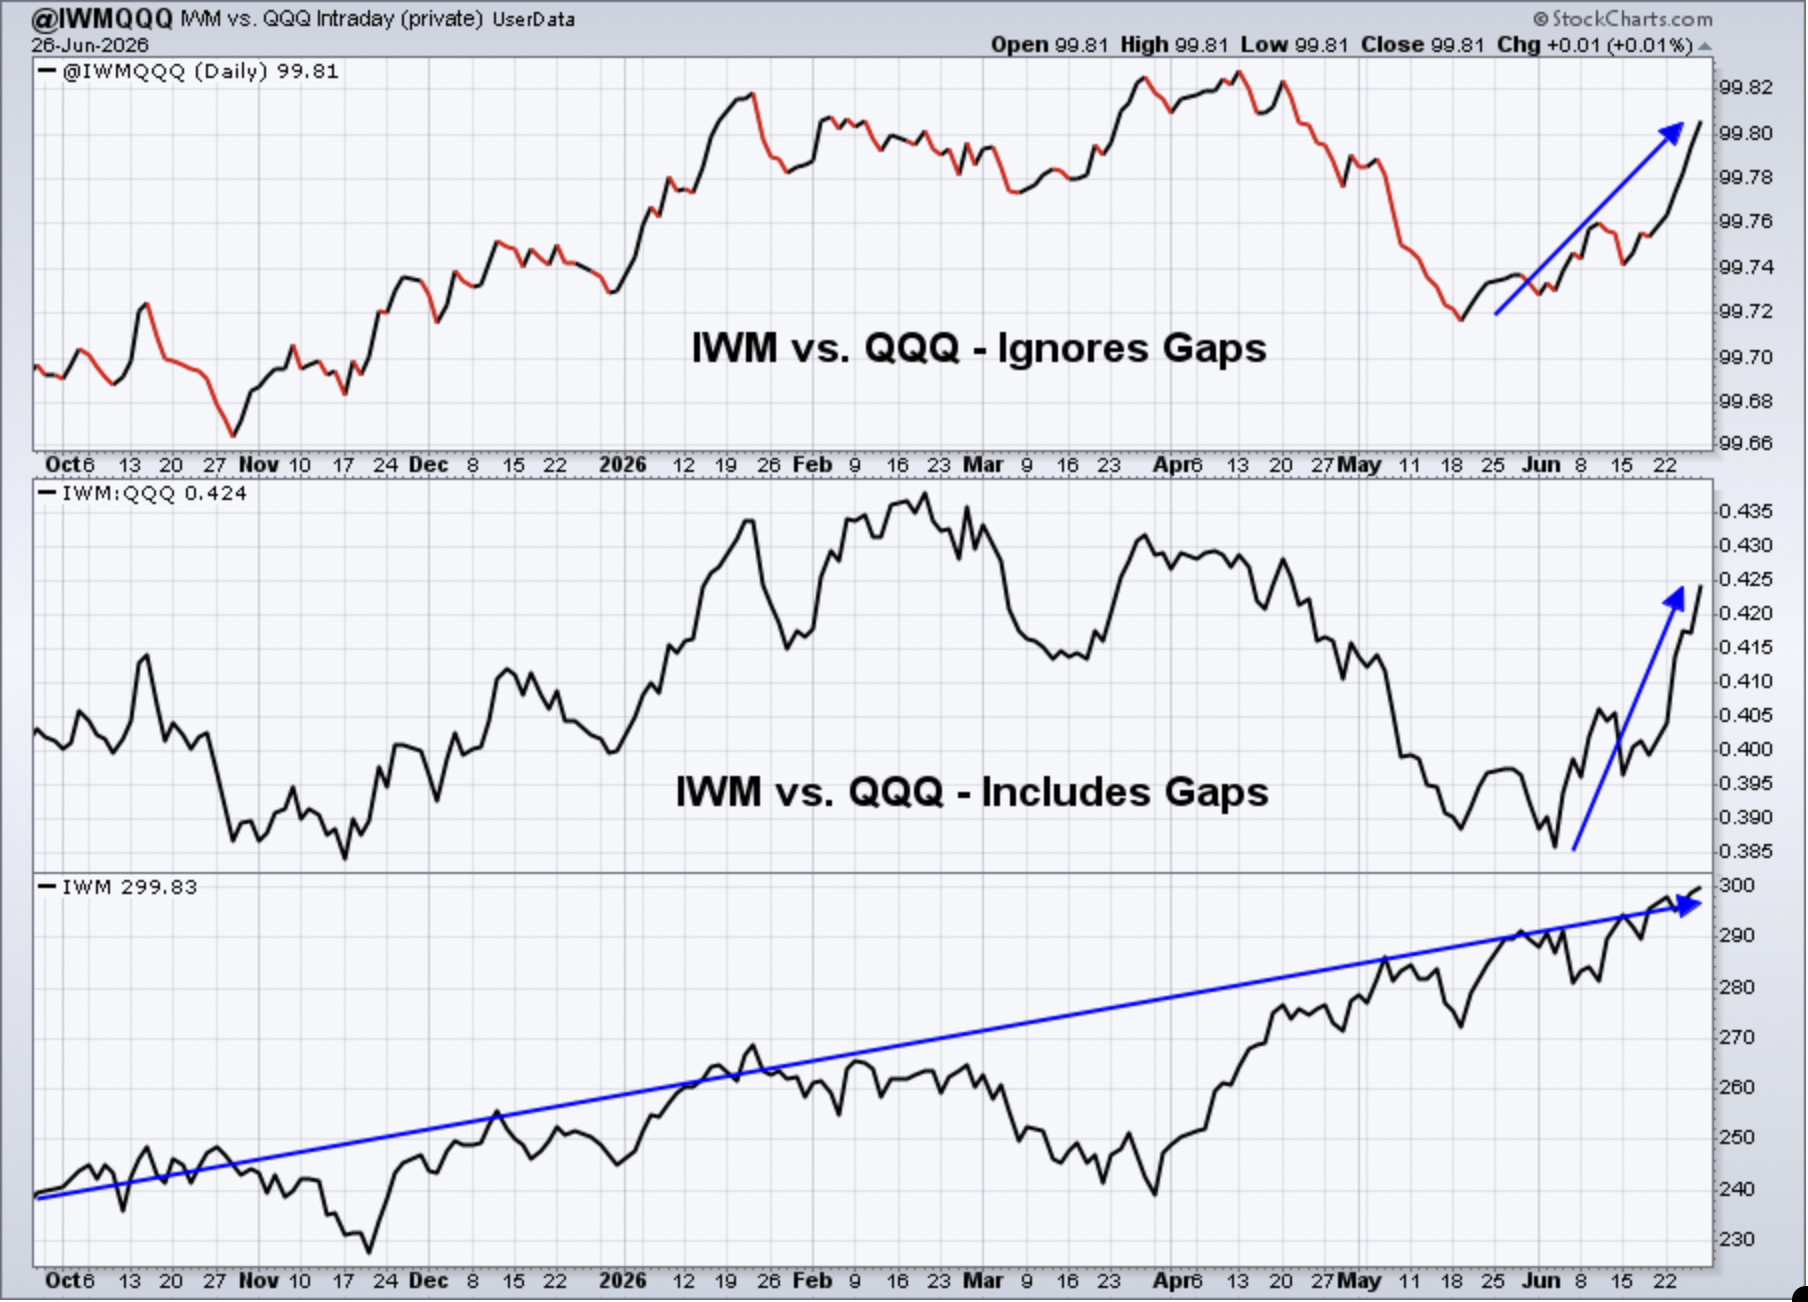
As the 10-year treasury yield ($TNX) has fallen, the relative strength of small caps (IWM) has risen. It's something I've talked about the past few years. If I'm right that the Fed cuts before they hike, I assume we'll see more relative strength in the IWM. Hopefully, with the new Fed chair, we'll see less frequent rotation and reduced volatility, when it comes to the small cap area.
XLY:XLP
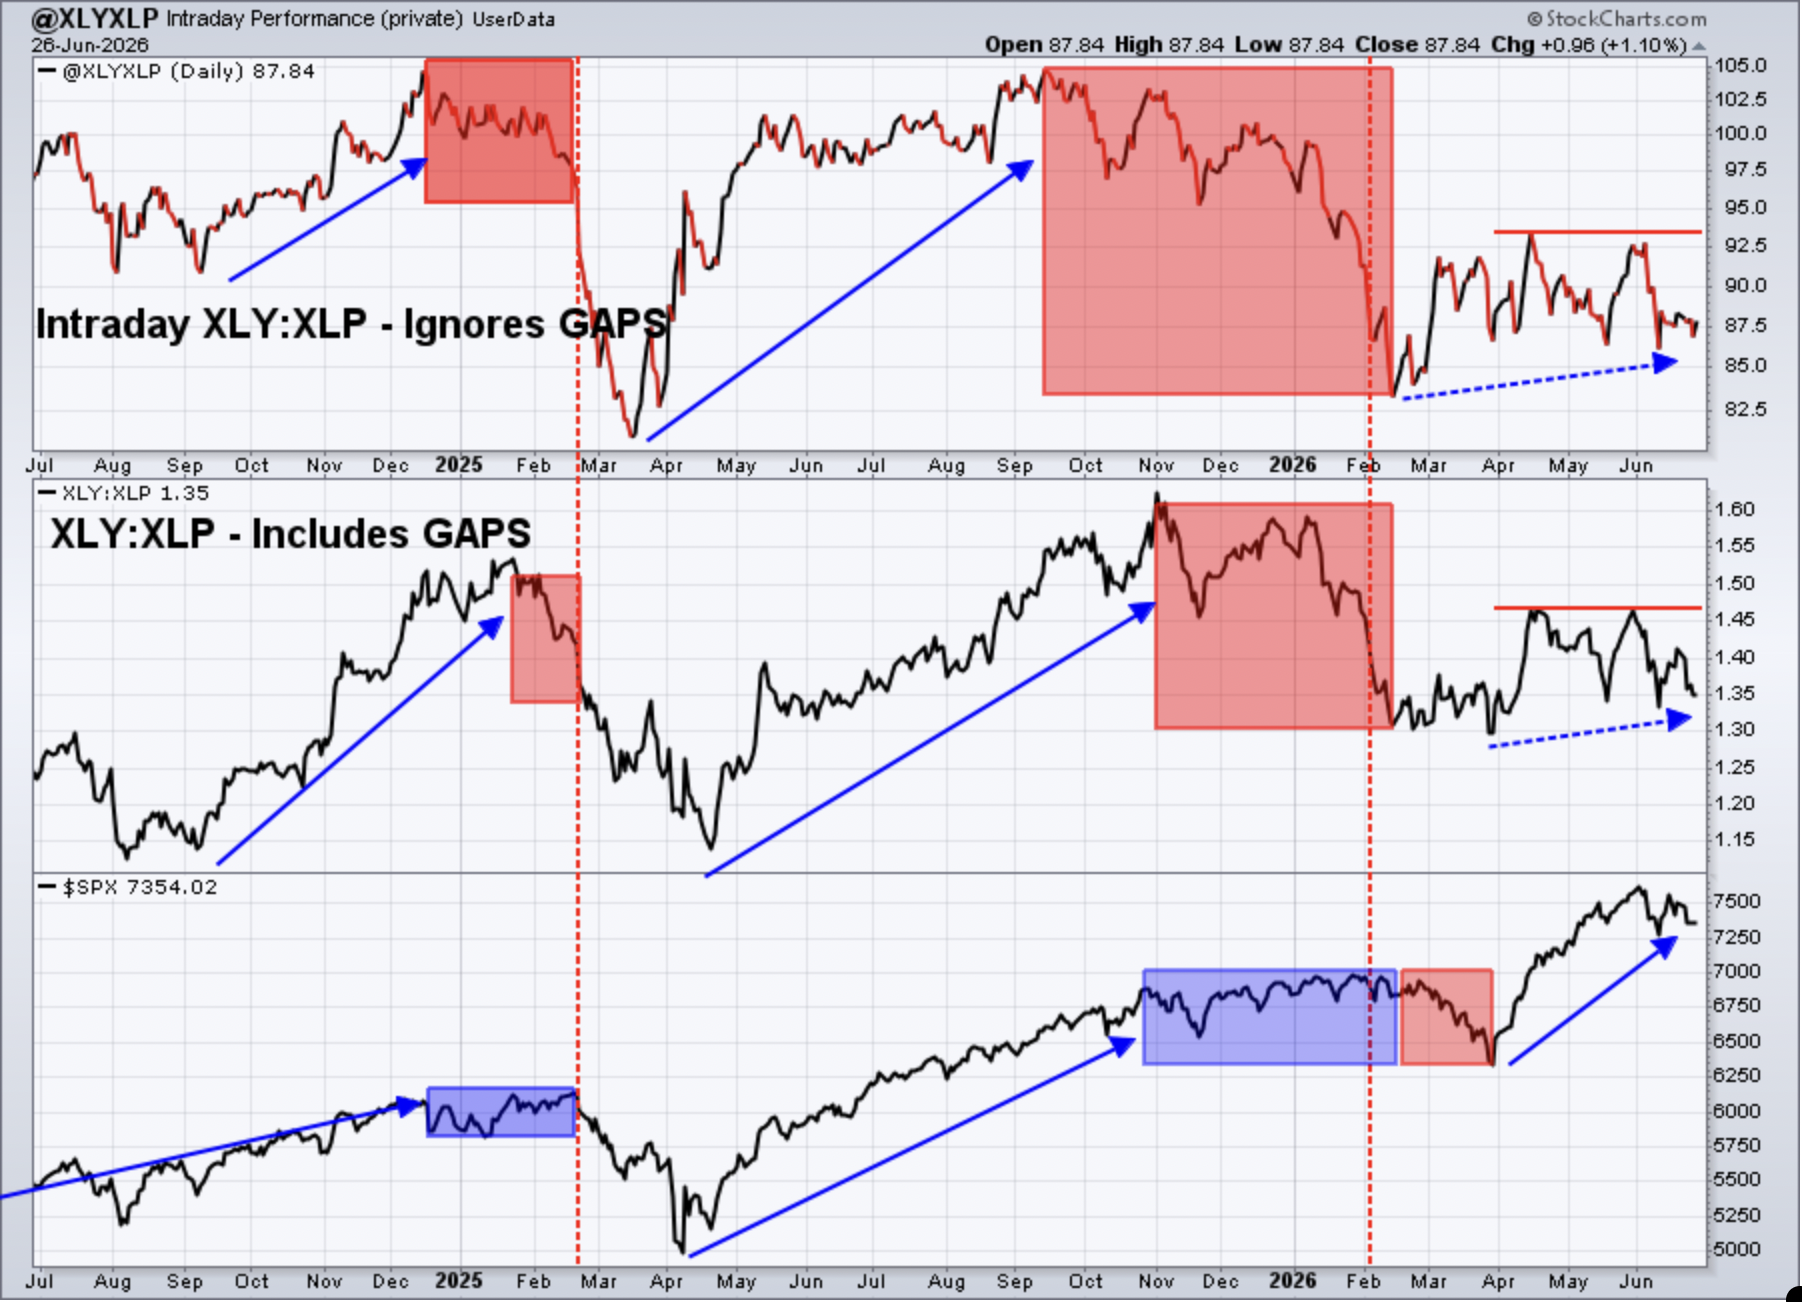
This ratio has weakened and is testing lows set in May and earlier in June. There's also a triple bottom in February and March just below the more recent relative lows. While one ratio breaking down is reason to at least consider a potential topping process, I want to see a number of warning signs. Panicking every time one piece of the jigsaw puzzle turns cautious or bearish will have us overreacting way too often. Just keep in mind that we need to see a series of bearish signals arising simultaneously to truly grow worried about an impending cyclical bear market approaching.
For what it's worth, and it's only two days, but the XLY has a very nice recovery on Friday and we're seeing follow through today. AMZN and TSLA are both strong intraday.
Sentiment
5-day SMA ($CPCE)
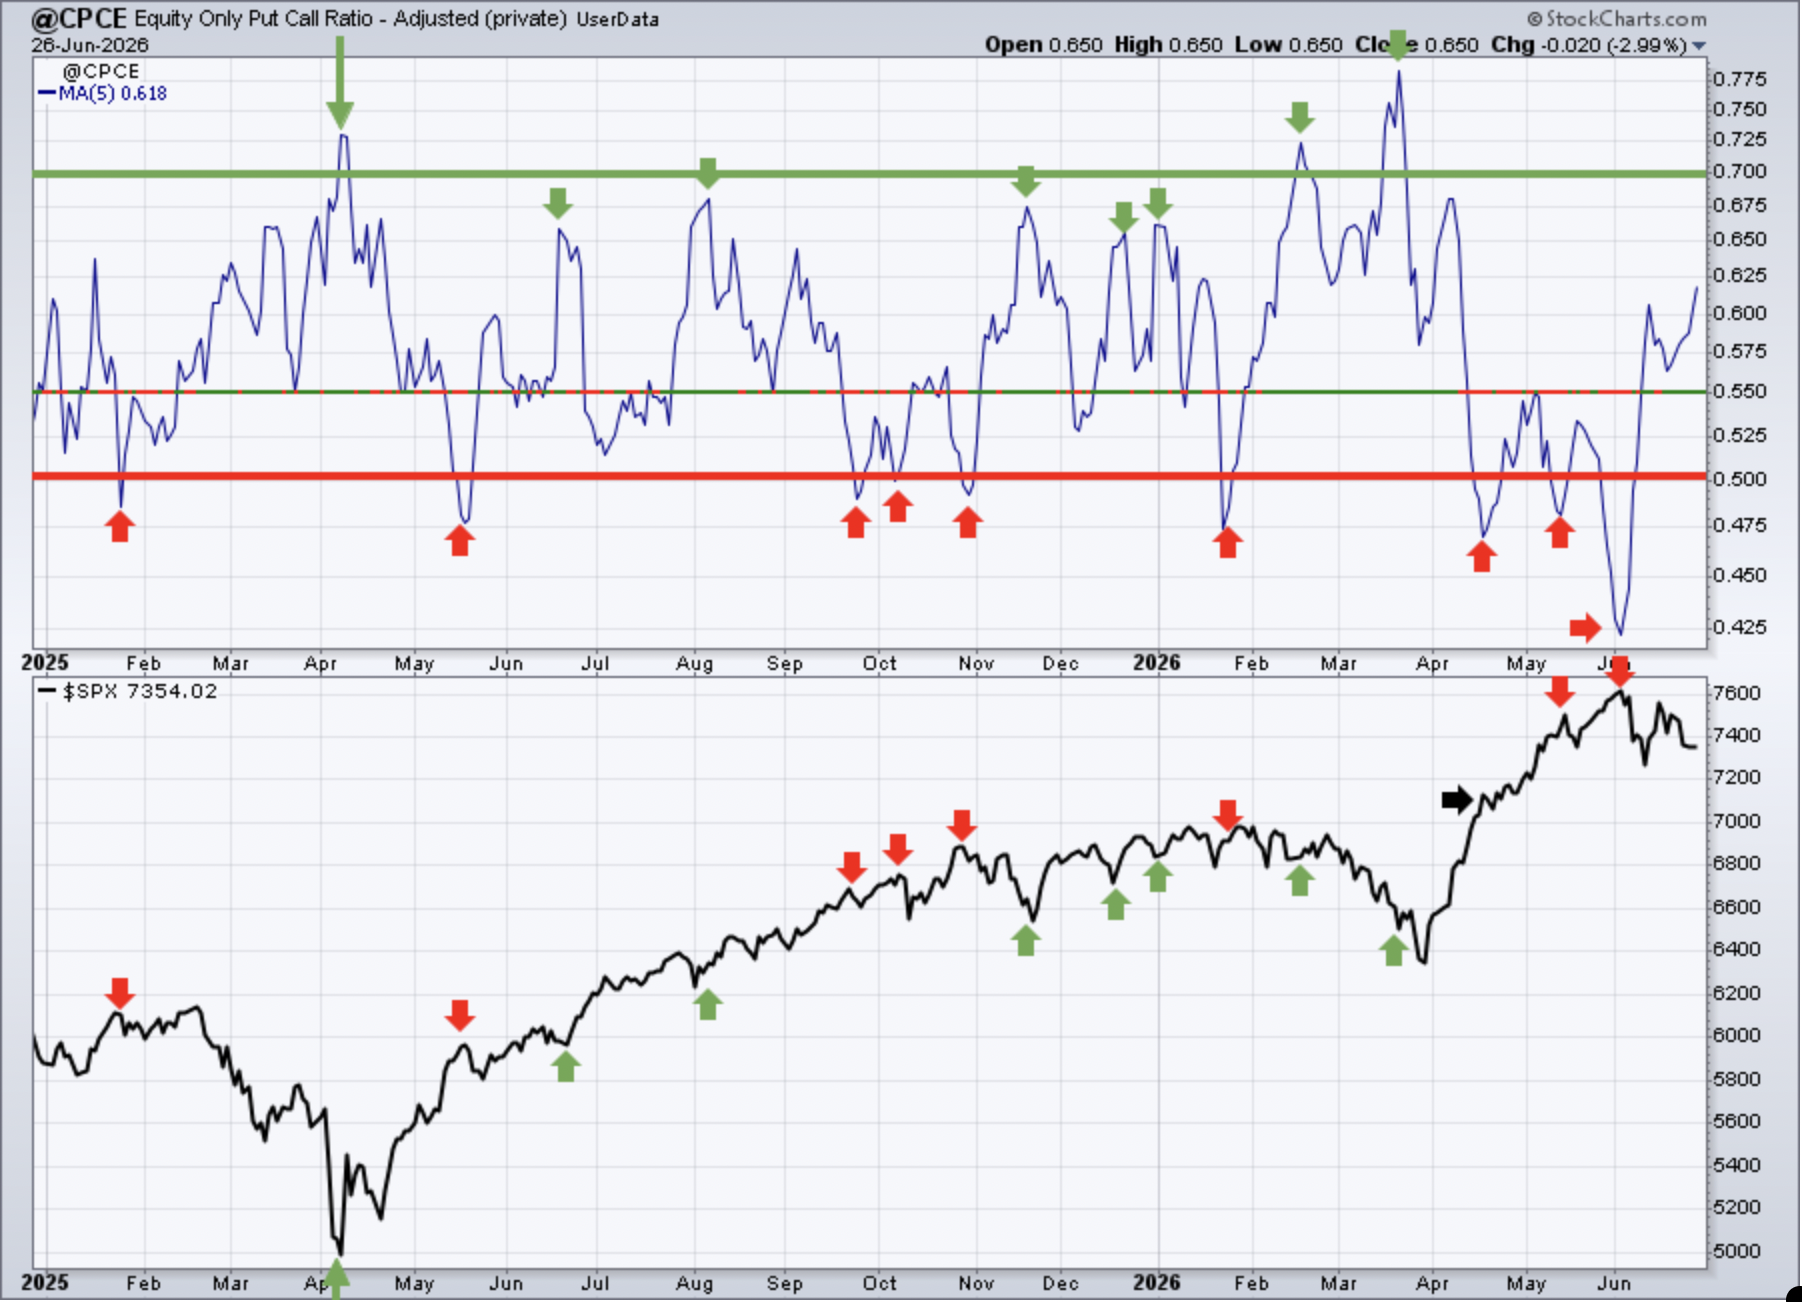
Sentiment indicators are contrarian indicators. When they show extreme bullishness, we need to be a bit cautious and when they show extreme pessimism, it could be time to become much more aggressive. Major market bottoms are carved out when pessimism is at its absolute highest level.
We saw a bit of a pullback in our major indices and this short-term signal has quickly moved back into neutral territory. This sentiment signal is telling us absolutely nothing at the moment.
253-day SMA ($CPCE)
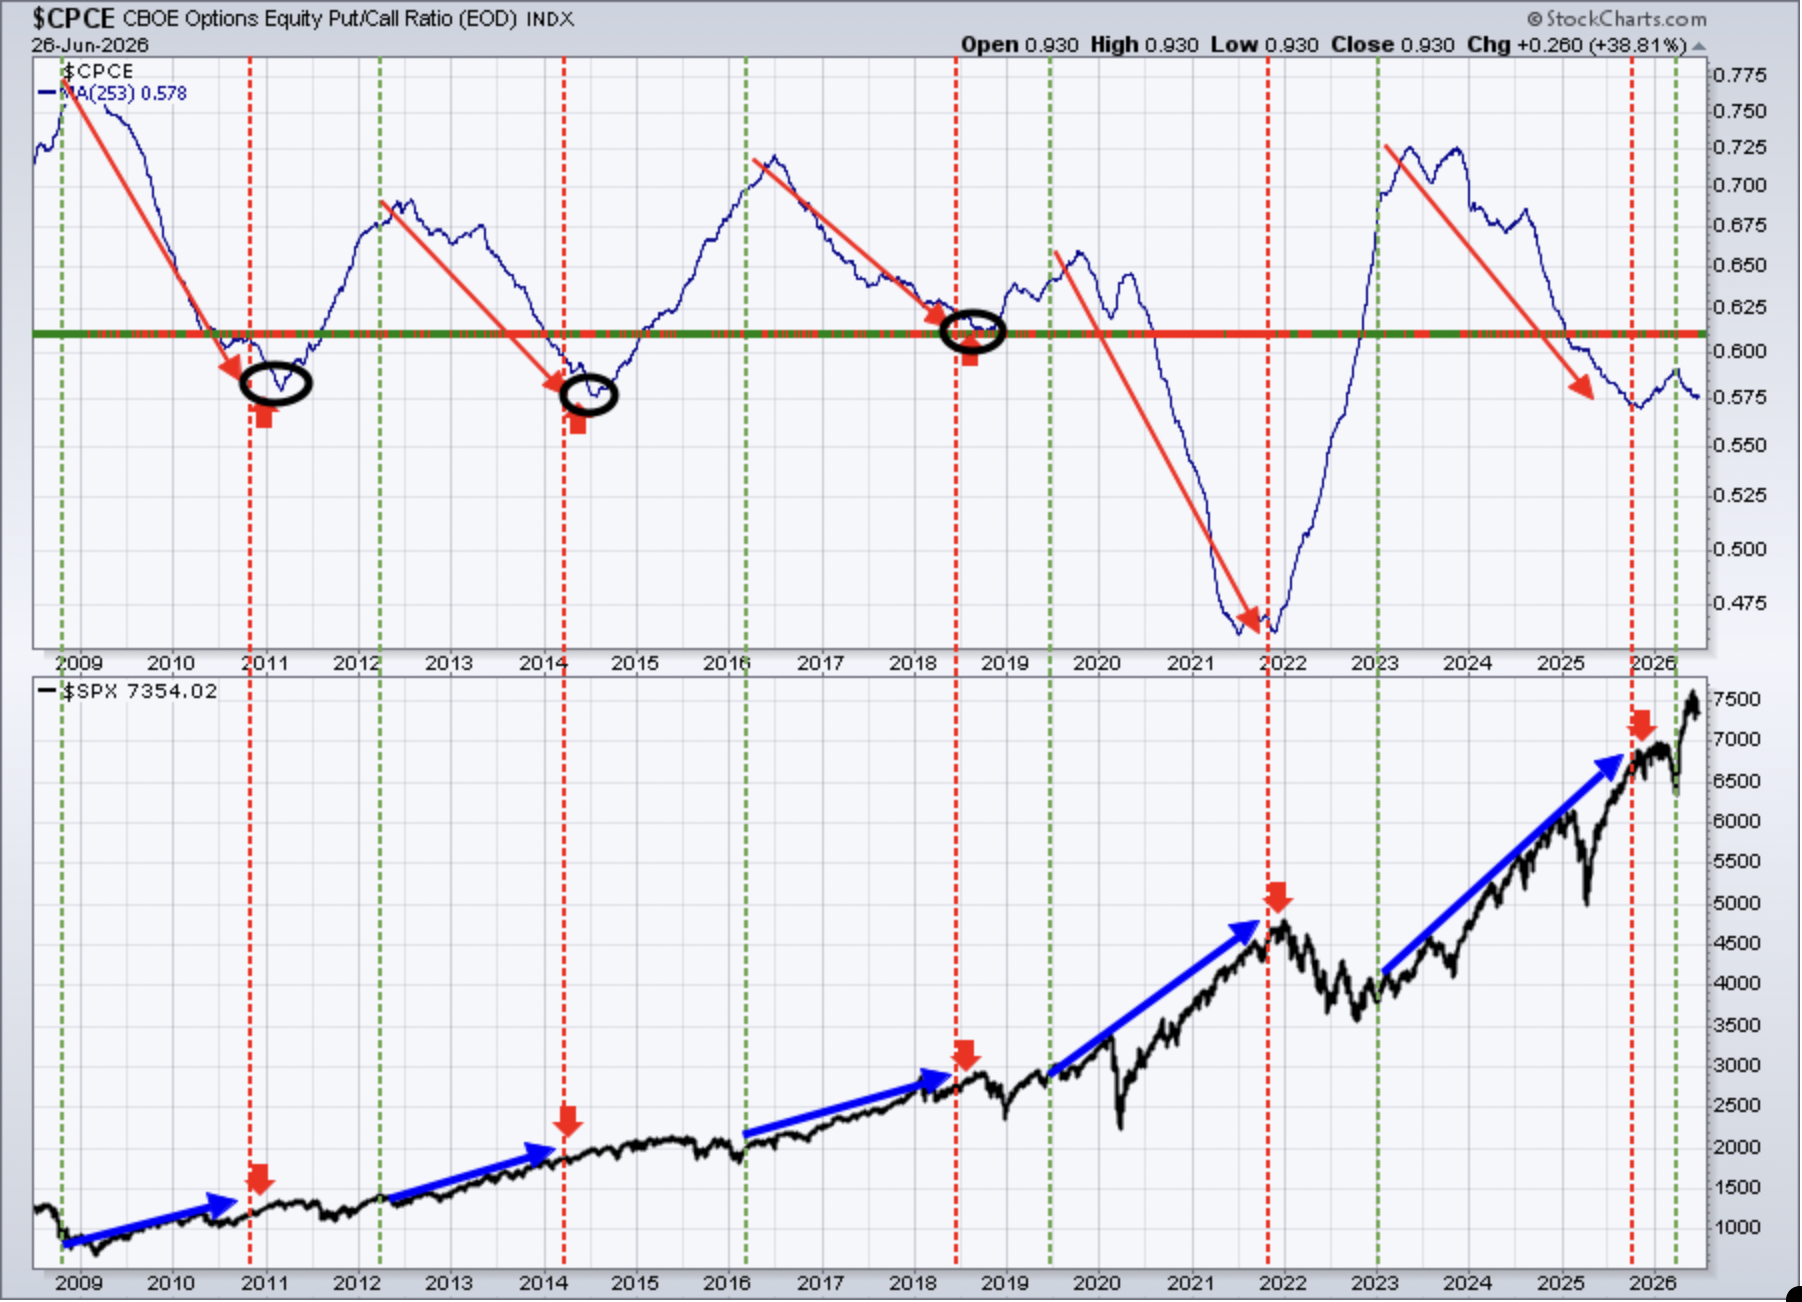
This longer-term 253-day SMA of the CPCE is our "ocean-liner" signal, unlike our short-term speedboat indicator. Any significant change in direction in this 253-day CPCE, in the past, has had profound effects on the S&P 500.
The fact that this long-term 253-day SMA has rolled back over and is now moving lower is bullish. If it breaks to a new low, clearing the Q4 2025 low, it would only add more confidence to the secular bull market scenario moving forward. (This was written last week and nothing has changed, in my view.)
Long-Term Trade Setups
Since beginning this Weekly Market Report in September 2023, I've discussed the long-term trade candidates below that I really like. Generally, these stocks have excellent long-term track records, and many pay nice dividends that mostly grow every year. Only in specific cases (exceptions) would I consider a long-term entry into a stock that has a poor or limited long-term track record and/or pays no dividends. I try to review the long-term picture once a month, and below is how I currently view each weekly chart heading into July:
- JPM - just completed right side of cup; possible handle to form, bullish
- BA - trending higher off April 2025 low, would like to see 200 support hold
- FFIV - very bullish chart, but overbought as it consolidates in bull flag
- MA - downtrending, but slight positive divergence; 475 is key support
- GS - pulling back from overbought conditions, 950 solid support
- FDX - negative divergence and bearish engulfing candle suggest more selling
- AAPL - might be best Mag 7 stock right now, tested 20-week EMA last week
- CHRW - appears to be forming right side of cup - bullish
- JBHT - solid uptrend intact, rising 20-week EMA is key support
- STX - weekly RSI been hanging near 90, last week's selling not a bad thing
- HSY - eversing piercing candle printed last week, looking for recovery
- DIS - consider 93-110 as the intermediate-term trading range
- MSCI - wondered if breakout was coming; emphatic no based on June trading
- SBUX - trending higher, looking for test of 113-114 price resistance
- KRE - solid month of June resulted in bullish breakout
- ED - excellent action last week, keeping uptrend intact in the process
- AJG - breakout above 20-week EMA after positive divergence says bottom is in
- NSC - trading in narrow 299-320 trading range
- RHI - moving thru 34 price resistance from January would be very bullish
- ADM - beautiful bounce off rising 20-week EMA
- BG - triple top breakout was 110 and that's where we tested last week on selling
- CVS - chart couldn't look much better; in breakout and all-time high territory
- HRL - last week's 9.73% gain seems to be indicating long-term bottom is in
- DE - 3-month downtrend ended in June; now looking at testing 675 resistance
- LULU - nice reversal last week, but massive downtrend remains in play
- TTD - broken stock and one of the worst relative performers in software
- META - weakening with possible test of 480-520 price support range upcoming
- ADBE - failed miserably at 20-week EMA and moved below 200 for first time since 2018
- KMB - surged 14% last week to test declining 20-week EMA for first time
- ORCL - huge 34% decline last week sets up another test near 140 support
- ABBV - rode the health care rally to its new all-time high
- MCD - weekly RSI at 34, generally solid long-term entry point
- MKC - nice reversal last week, perhaps it'll move up to test its declining 20-week EMA
Keep in mind that our Weekly Market Reports favor those who are more interested in the long-term market picture. Therefore, the list of stocks above are stocks that we believe are safer (but nothing is ever 100% safe) to own with the long-term in mind. Nearly everything else we do at EarningsBeats.com favors short-term momentum trading, so I wanted to explain what we're doing with this list and why it's different.
Also, please keep in mind that I'm not a Registered Investment Advisor (and neither is EarningsBeats.com nor any of its employees) and am only providing (mostly) what I believe to be solid dividend-paying stocks for the long term. Companies periodically go through adjustments, new competition, restructuring, management changes, etc. that can have detrimental long-term impacts. Neither the stock price nor the dividend is ever guaranteed. I simply point out interesting stock candidates for longer-term investors. Do your own due diligence and please consult with your financial advisor before making any purchases or sales of securities.
Looking Ahead
Upcoming Earnings
The following list of companies is NOT a list of all companies scheduled to report quarterly earnings, however, just key reports, so please be sure to check for earnings dates of any companies that you own. Any company in BOLD represents a stock in one of our portfolios and the amount in parenthesis represents the market capitalization of each company listed:
- Monday: None
- Tuesday: NKE ($61 billion), STZ ($25 billion)
- Wednesday: GIS ($19 billion)
- Thursday: None
- Friday: None - Market Closed
Key Economic Reports
- Monday: None
- Tuesday: April Case-Shiller home price index, June Chicago PMI, June consumer confidence, May JOLTS
- Wednesday: June ADP employment report, June ISM manufacturing, May construction spending
- Thursday: June nonfarm payrolls, unemployment rate, & hourly wages, initial jobless claims
- Friday: None - Market Closed
Historical Data
I'm a true stock market historian. I am absolutely PASSIONATE about studying stock market history to provide us more clues about likely stock market direction and potential sectors/industries/stocks to trade. While I don't use history as a primary indicator, I'm always very aware of it as a secondary indicator. I love it when history lines up with my technical signals, providing me with much more confidence to make particular trades.
Below you'll find the next two weeks of historical data and tendencies across the three key indices that I follow most closely. The percentage for each calendar day represents the annualized return for that day. An example of how this is calculated is reflected next to the first day under the S&P 500 and in parenthesis:
S&P 500 (since 1950)
- Jun 29: +6.42% (Ex: cumulative gains =
+1.35% over 53 trading days since 1950. +1.35% x 253/53 = +6.42%) - Jun 30: +36.16%
- Jul 1: +70.86%
- Jul 2: +18.71%
- Jul 3: +80.16%
- Jul 4: +0.00% (Market closed)
- Jul 5: +39.40%
- Jul 6: +22.32%
- Jul 7: +13.61%
- Jul 8: -16.33%
- Jul 9: +77.99%
- Jul 10: -14.99%
- Jul 11: +11.48%
- Jul 12: +36.89%
NASDAQ (since 1971)
- Jun 29: +51.99%
- Jun 30: +74.50%
- Jul 1: +56.06%
- Jul 2: -40.11%
- Jul 3: +52.86%
- Jul 4: +0.00% (Market closed)
- Jul 5: +7.04%
- Jul 6: -10.79%
- Jul 7: +52.71%
- Jul 8: -9.65%
- Jul 9: +90.35%
- Jul 10: -26.62%
- Jul 11: +9.52%
- Jul 12: +128.28%
Russell 2000 (since 1987)
- Jun 29: +66.61%
- Jun 30: +95.47%
- Jul 1: +29.36%
- Jul 2: -108.70%
- Jul 3: +42.54%
- Jul 4: +0.00% (Market closed)
- Jul 5: -4.89%
- Jul 6: -76.61%
- Jul 7: +42.32%
- Jul 8: +35.86%
- Jul 9: +30.65%
- Jul 10: -16.74%
- Jul 11: +28.65%
- Jul 12: +89.15%
The S&P 500 data dates back to 1950, while the NASDAQ and Russell 2000 information date back to 1971 and 1987, respectively.
Final Thoughts
We have two more trading days in June, but performance this month has followed typical seasonal behavior. Defensive groups tend to make up ground in June (also in March, September, and December - 3rd months within each calendar quarter) and that's exactly what we've seen in June 2026. If this behavior continues well into July and as the S&P 500 makes new highs, then we could have potential topping signs forming. It's way too early to go there, however.
Here's what I'll be thinking about this week:
Crude Oil. Oil prices took another big hit last week as crude ($WTIC) fell another 8.27% to $70 per barrel. As a result, the XLE (energy sector ETF) has retreated and tested a 4-month low at 53.03.
Volatility. The Volatility Index ($VIX) rose last week above 20 on 3 of the 5 trading days, but didn't close above 20 on any single day. That followed a move higher in the VIX earlier in June to the 23 level. It's not unusual to see a rising VIX during June. In fact, the VIX has risen during June in 13 of the last 20 years, or 65% of Junes. That is tied with January's 65% for the most among all calendar months. July, however, sees the opposite trend and lower VIX readings more often than not, especially during the first half of the month as the stock market typically has a pre-earnings run in anticipation of strong earnings.
Divergences. While many negative divergences still remain on daily charts, the weekly charts are very strong and PPOs are showing little in the way of slowing momentum. I put more weight on the look of the weekly charts, so I'm expecting stock prices to rise, as they typically do, ahead of the start of Q2 earnings season.
Cryptocurrencies. Speaking of divergences, bitcoin ($BTCUSD) shows a positive divergence on its daily AND weekly charts, just as it tests key price support at 60000. I'm looking for bitcoin to turn higher sooner rather than later, and if the weekly positive divergence plays out to the 50-week SMA, bitcoin could be looking at a very significant potential gain of 30%-50%.
Jobs. The bond and stock markets are closed on Friday, July 3rd in observance of the July 4th holiday, which falls on a Saturday this year. So that means that the June Nonfarm Payrolls report will be released on Thursday morning, one day after the June ADP employment report. Both reports are expected to show jobs coming in between 110,000-120,000. A number significantly higher than 120,000 could increase the inflation and possible rate hike talk, while a number below 110,000 could continue to spark many interest-rate-sensitive areas like regional banks, homebuilders, and small caps.
Happy trading!
Tom