
EB Weekly Market Report - Monday, November 2, 2026
ChartLists/Spreadsheets
The following ChartLists have been updated as of the Friday, October 30th close, and have been posted to our website:
- Strong Earnings (SECL)
- Strong Future Earnings (SFECL)
- Raised Guidance (RGCL)
- Bullish Trifecta (BTCL)
- Leading Stocks (LSCL)
- Short Squeeze (SSCL)
- Matt's Hot Stocks (HTCL)
- Seasonality - November (SEASCL)
- Model ETF Portfolio (MODETF)
- Upcoming Earnings (EARN)
- Upcoming Earnings Relative Strength (EARNRS)
The Key Manipulation spreadsheet has been updated through Friday, October 30, 2026. You can now view and/or download this spreadsheet from our website.
The Upcoming Earnings Relative Strength ChartList (EARNRS) is currently being numbered and will be available by tomorrow morning. When looking at the new numbering system on this ChartList, companies that start with the following numbers will report when indicated:
- 1000: Monday morning
- 1500: Monday afternoon
- 2000: Tuesday morning
- 2500: Tuesday afternoon
- 3000: Wednesday morning
- 3500: Wednesday afternoon
- 4000: Thursday morning
- 4500: Thursday afternoon
- 5000: Friday morning
Weekly Market Recap
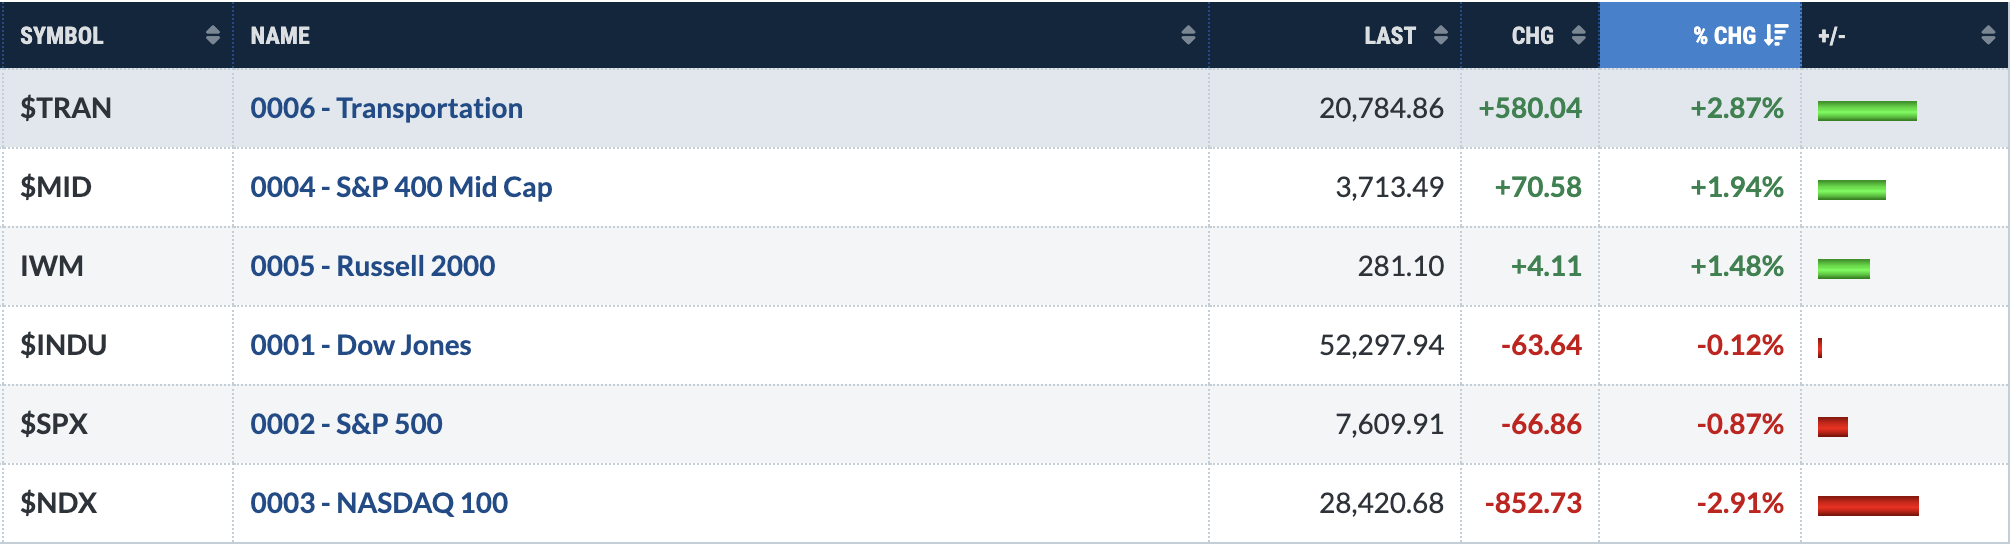
Major Indices
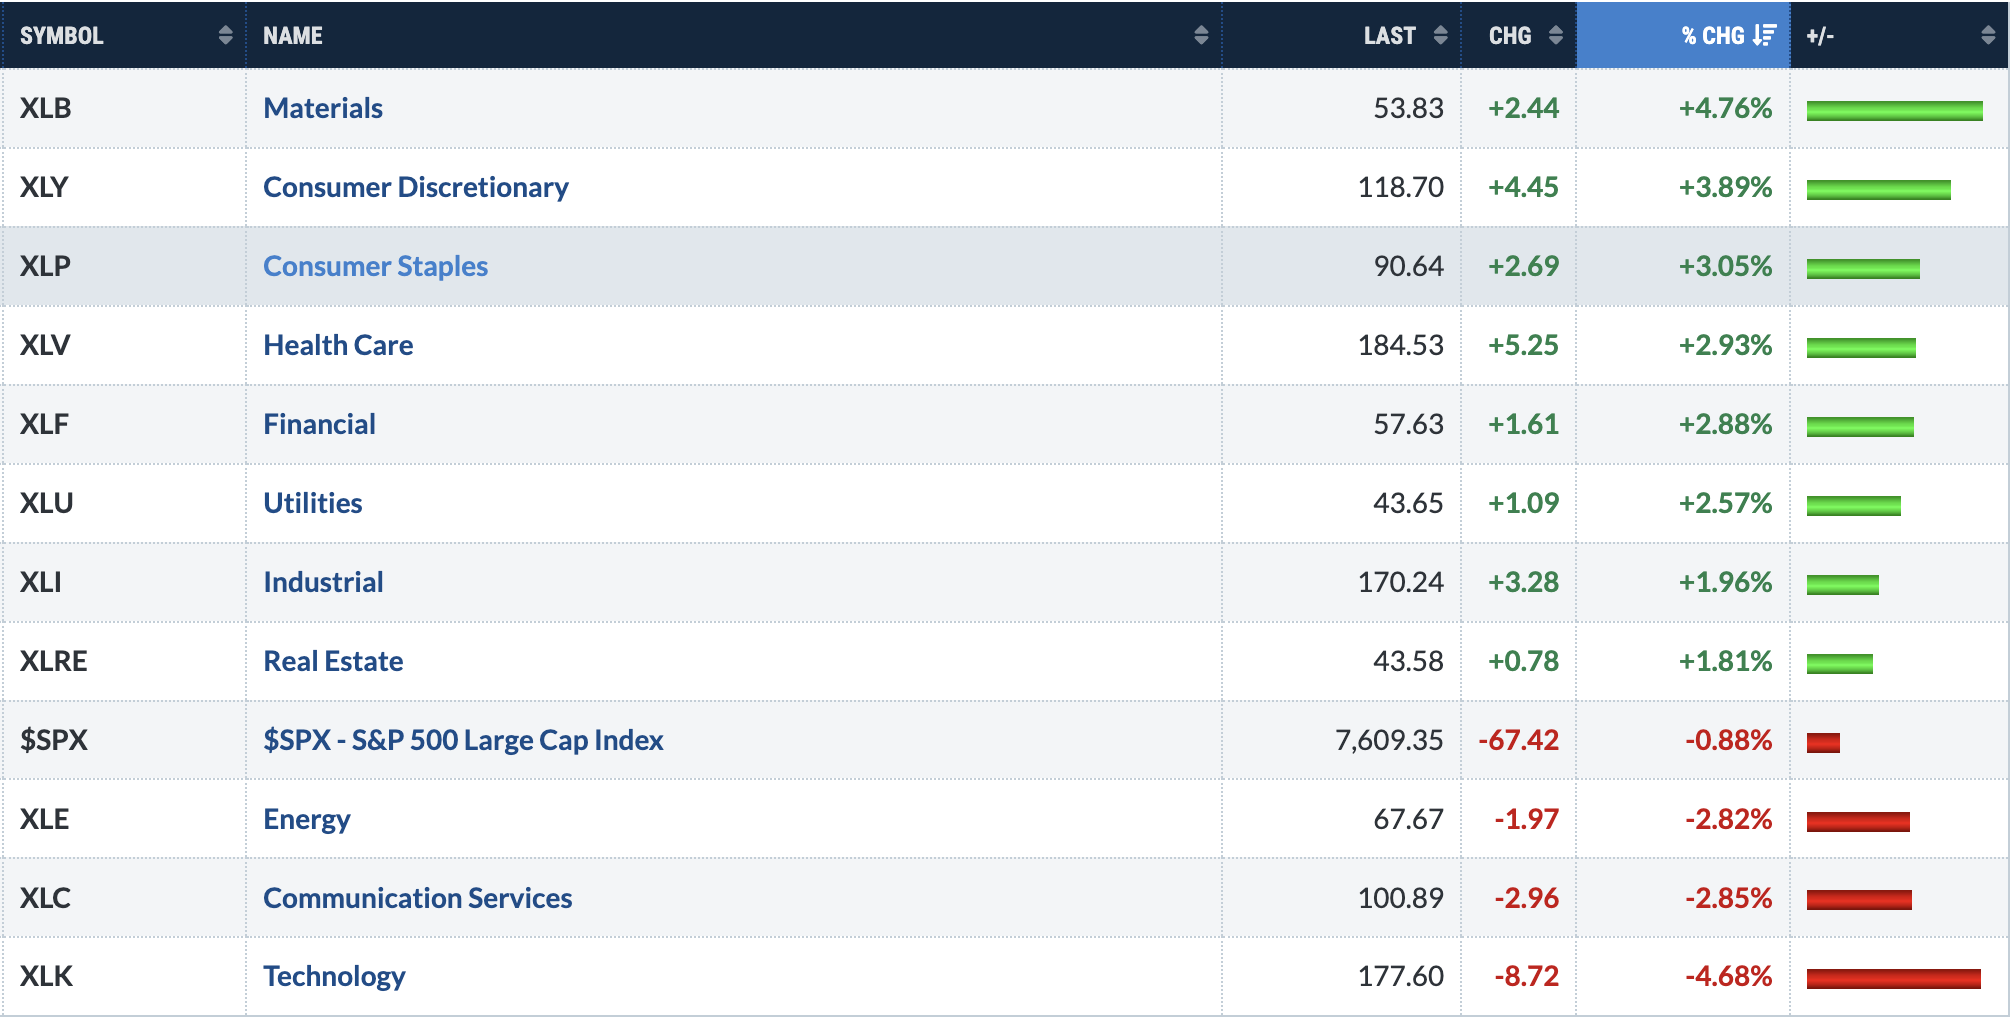
Sectors
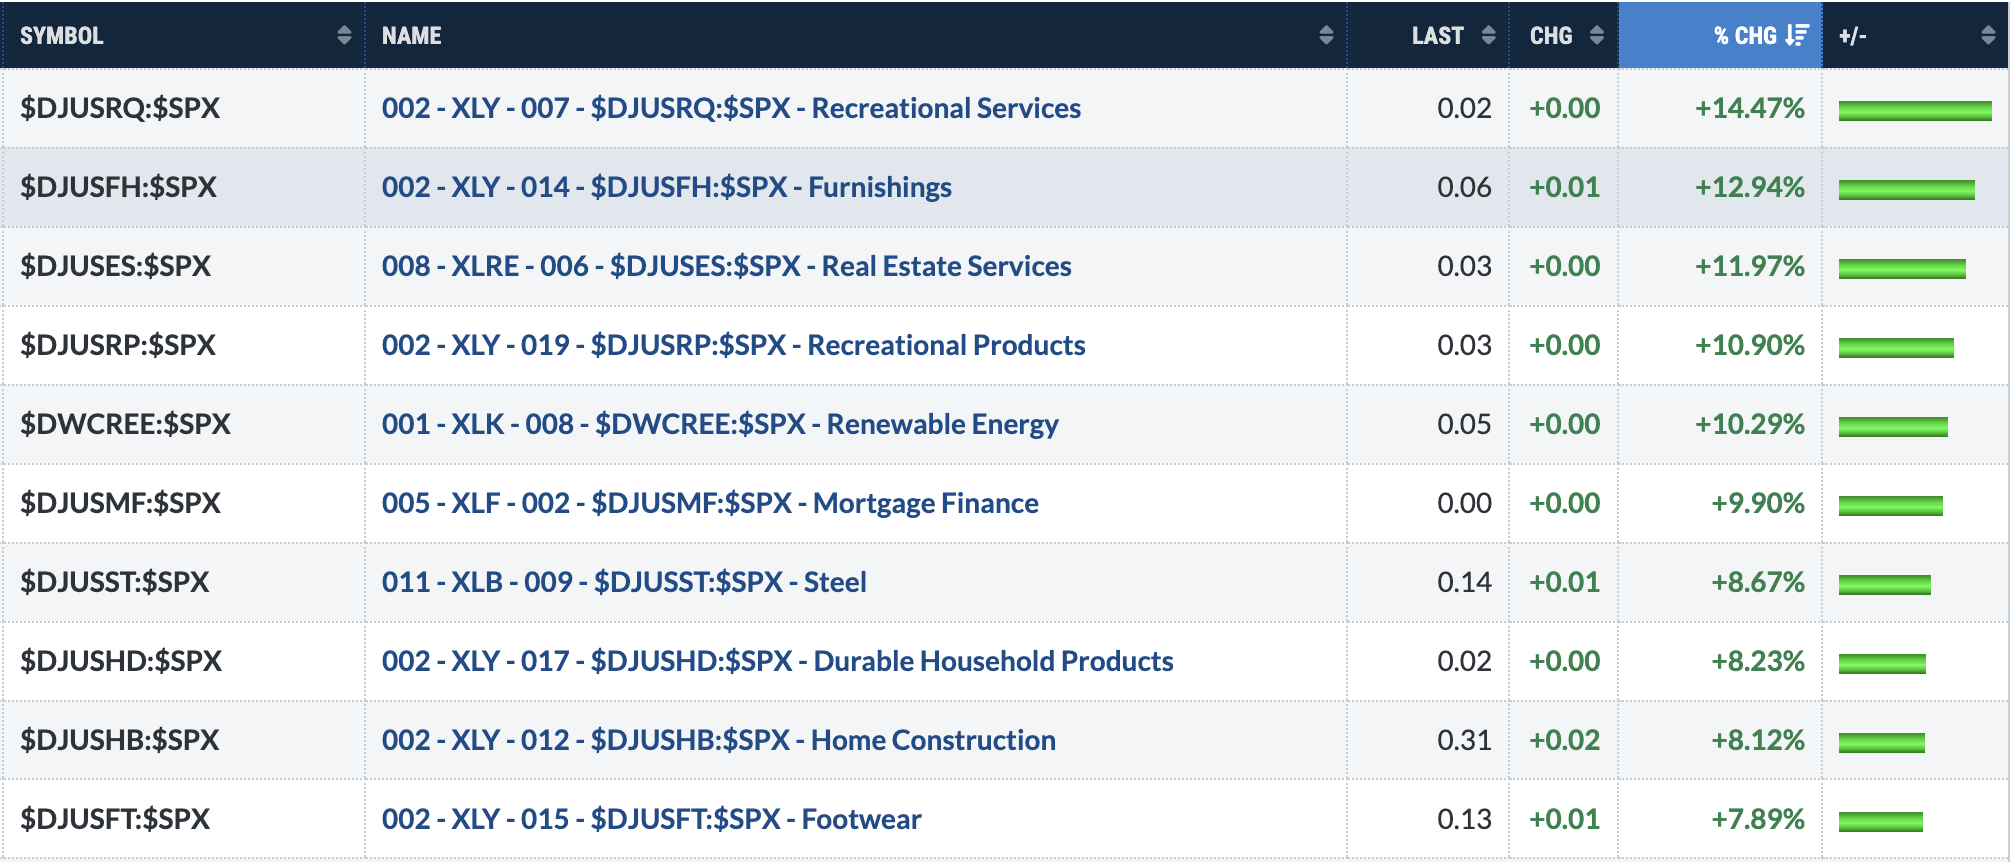
Top 10 Industries Last Week
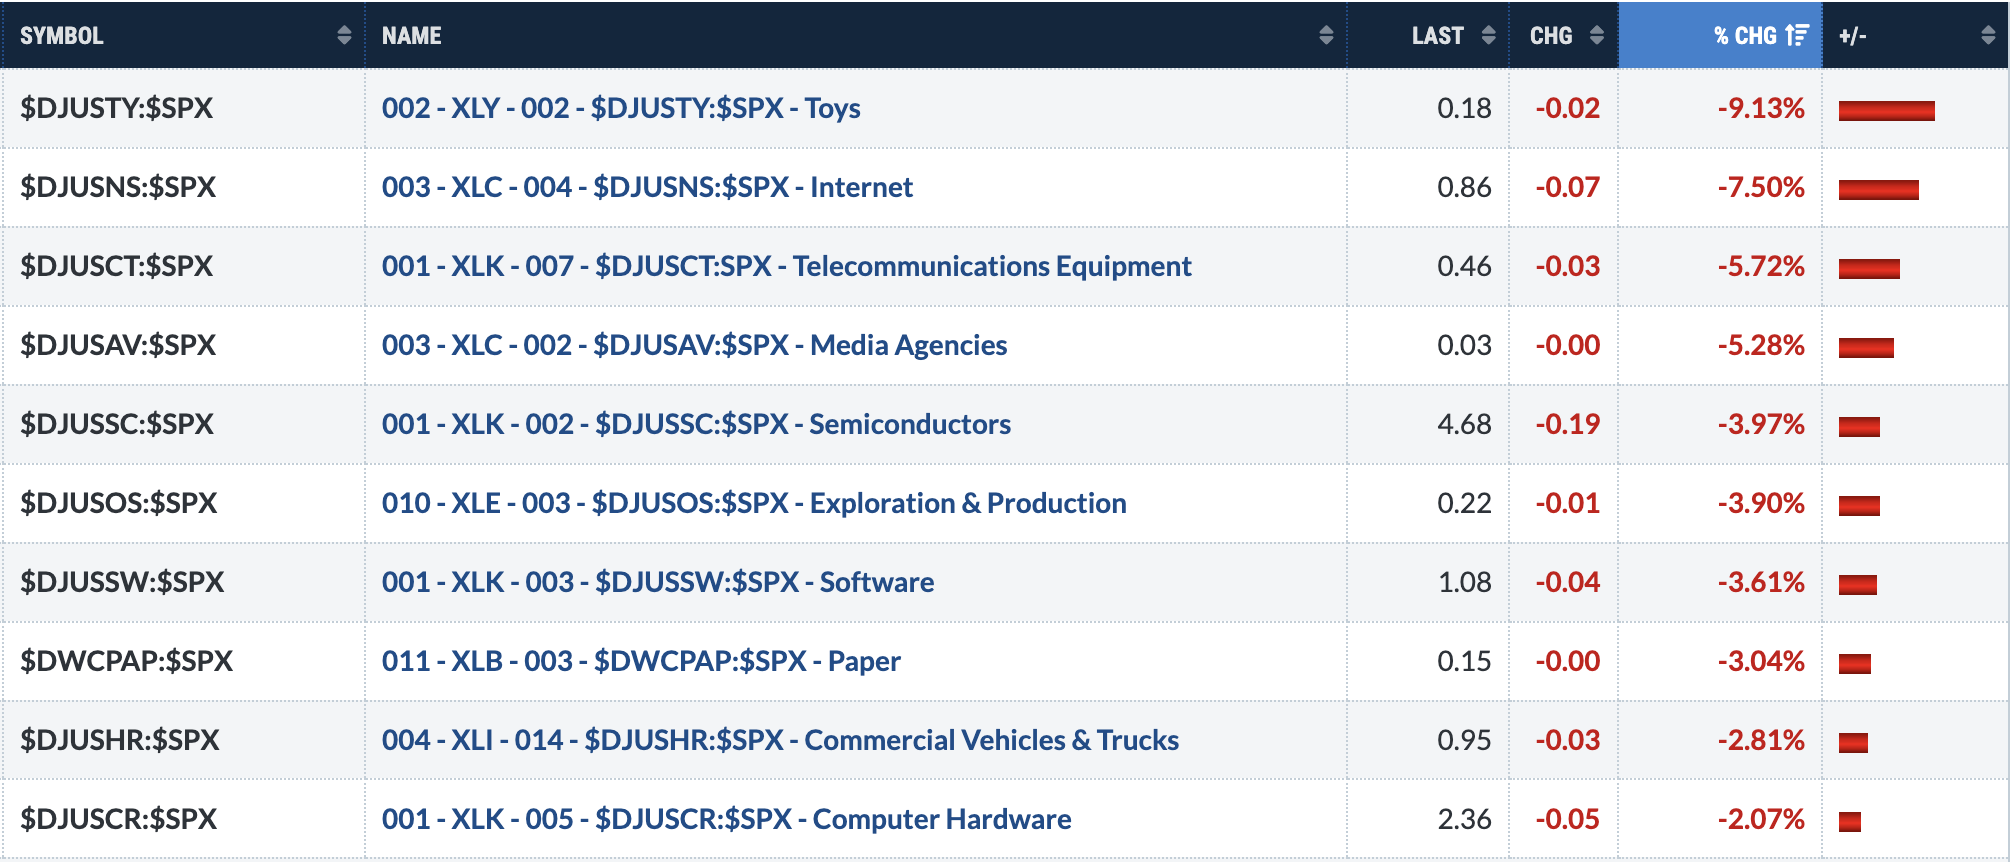
Bottom 10 Industries Last Week
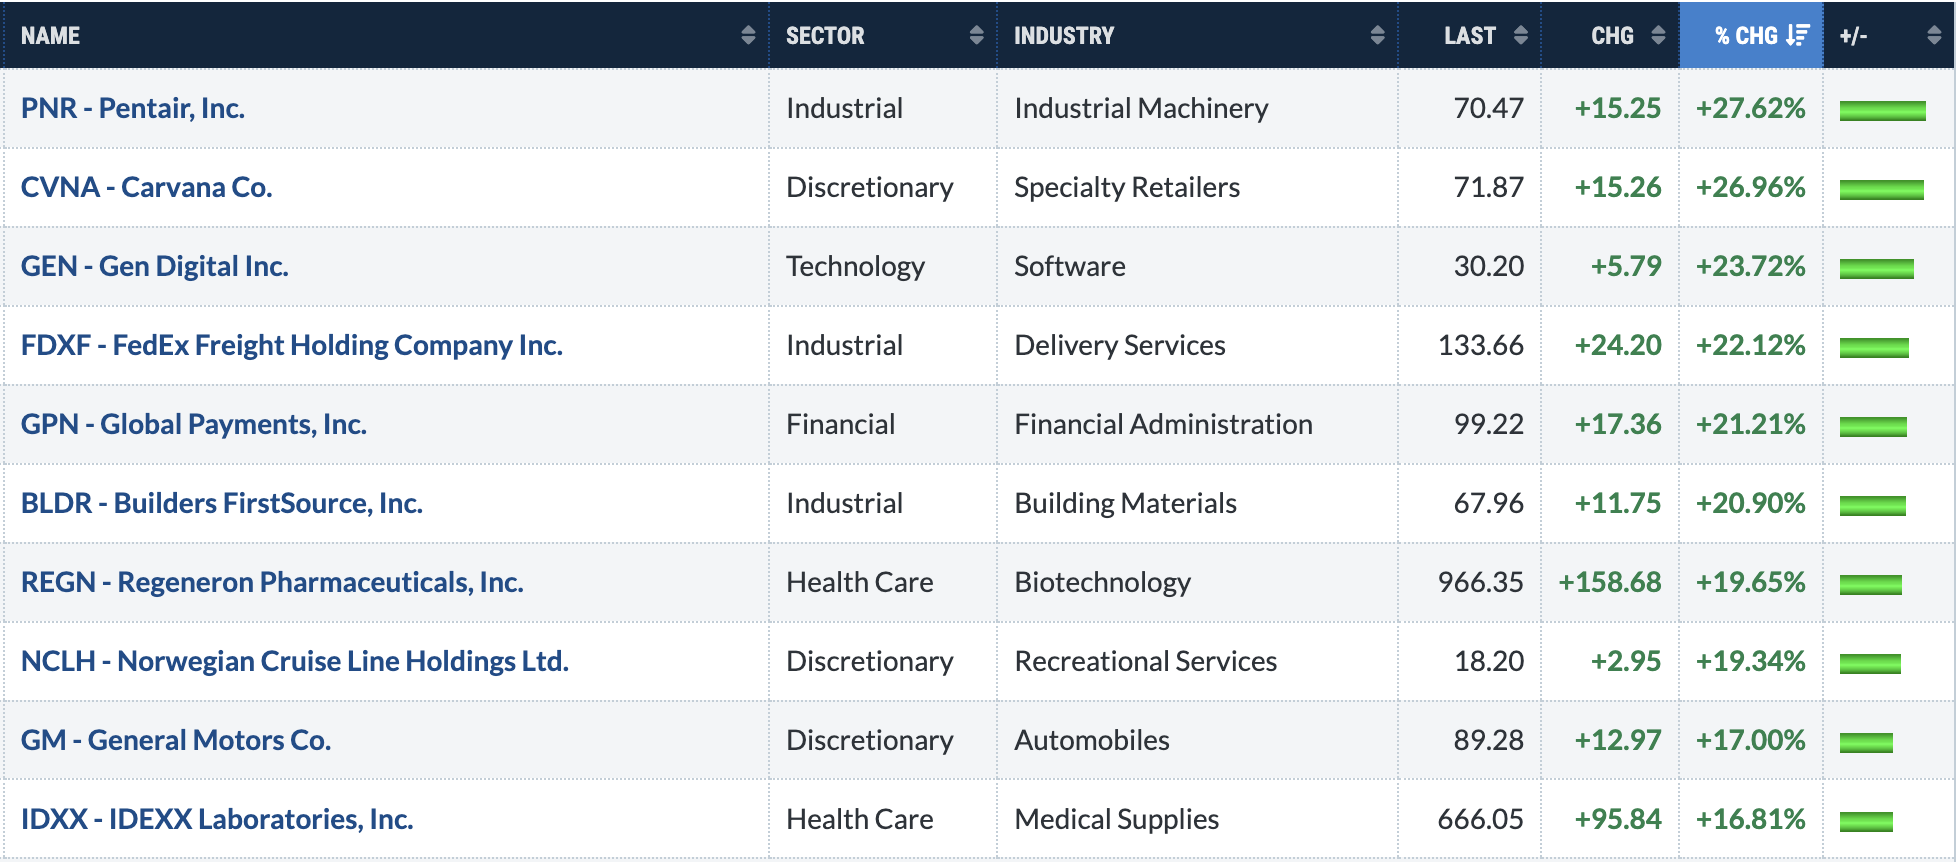
Top 10 Stocks - S&P 500/NASDAQ 100
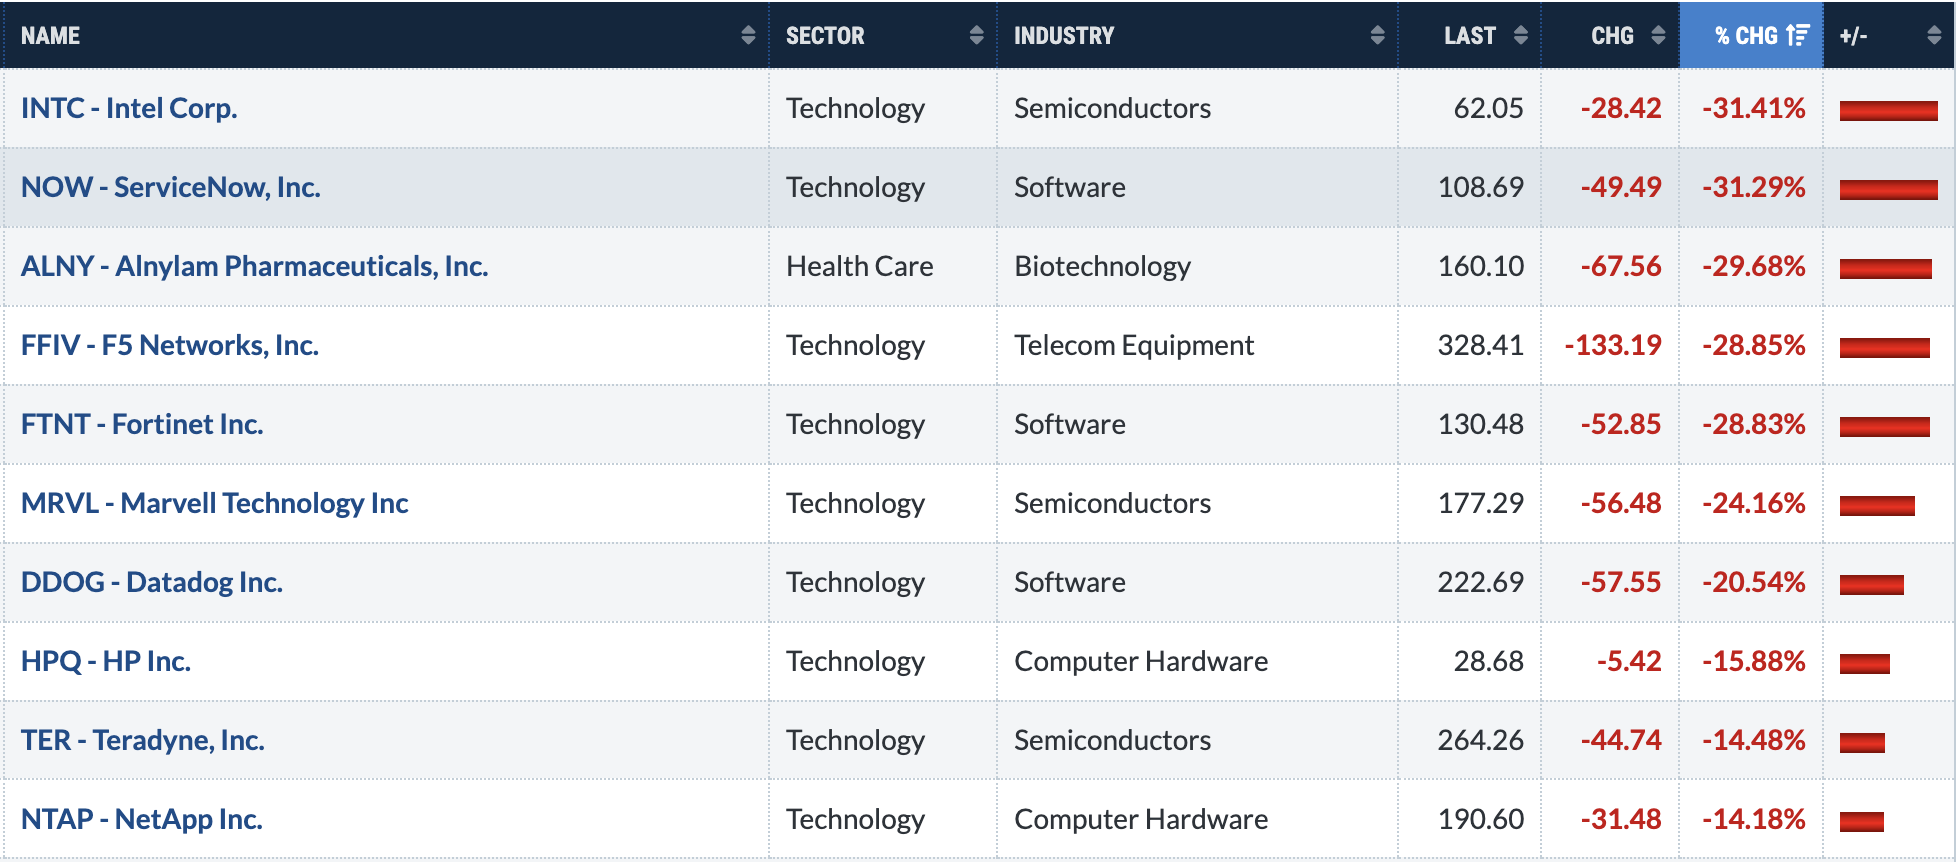
Bottom 10 Stocks - S&P 500/NASDAQ 100
Big Picture
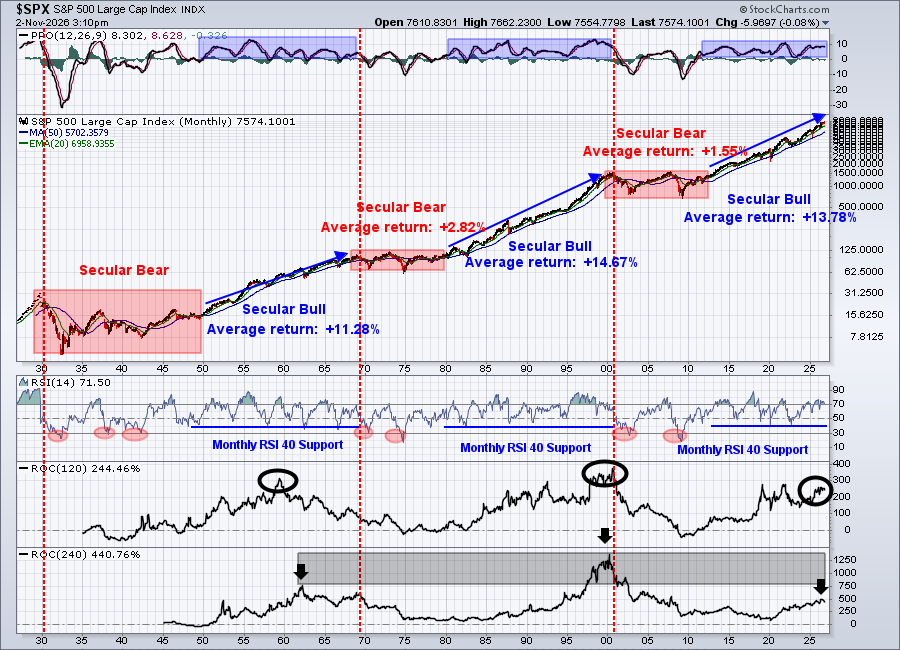
The NASDAQ took the brunt of last week's selling, especially on Thursday and Friday. You can see that the selling experienced on the S&P 500 wasn't even noticeable on this long-term chart. That's the beauty of it. It ignores the week-to-week noise and simply focuses on the long-term trend, which clearly remains up.
Sustainability Ratios
Here's the latest look at our key intraday ratios as we follow where the money is traveling on an INTRADAY basis (ignoring gaps):
QQQ:SPY
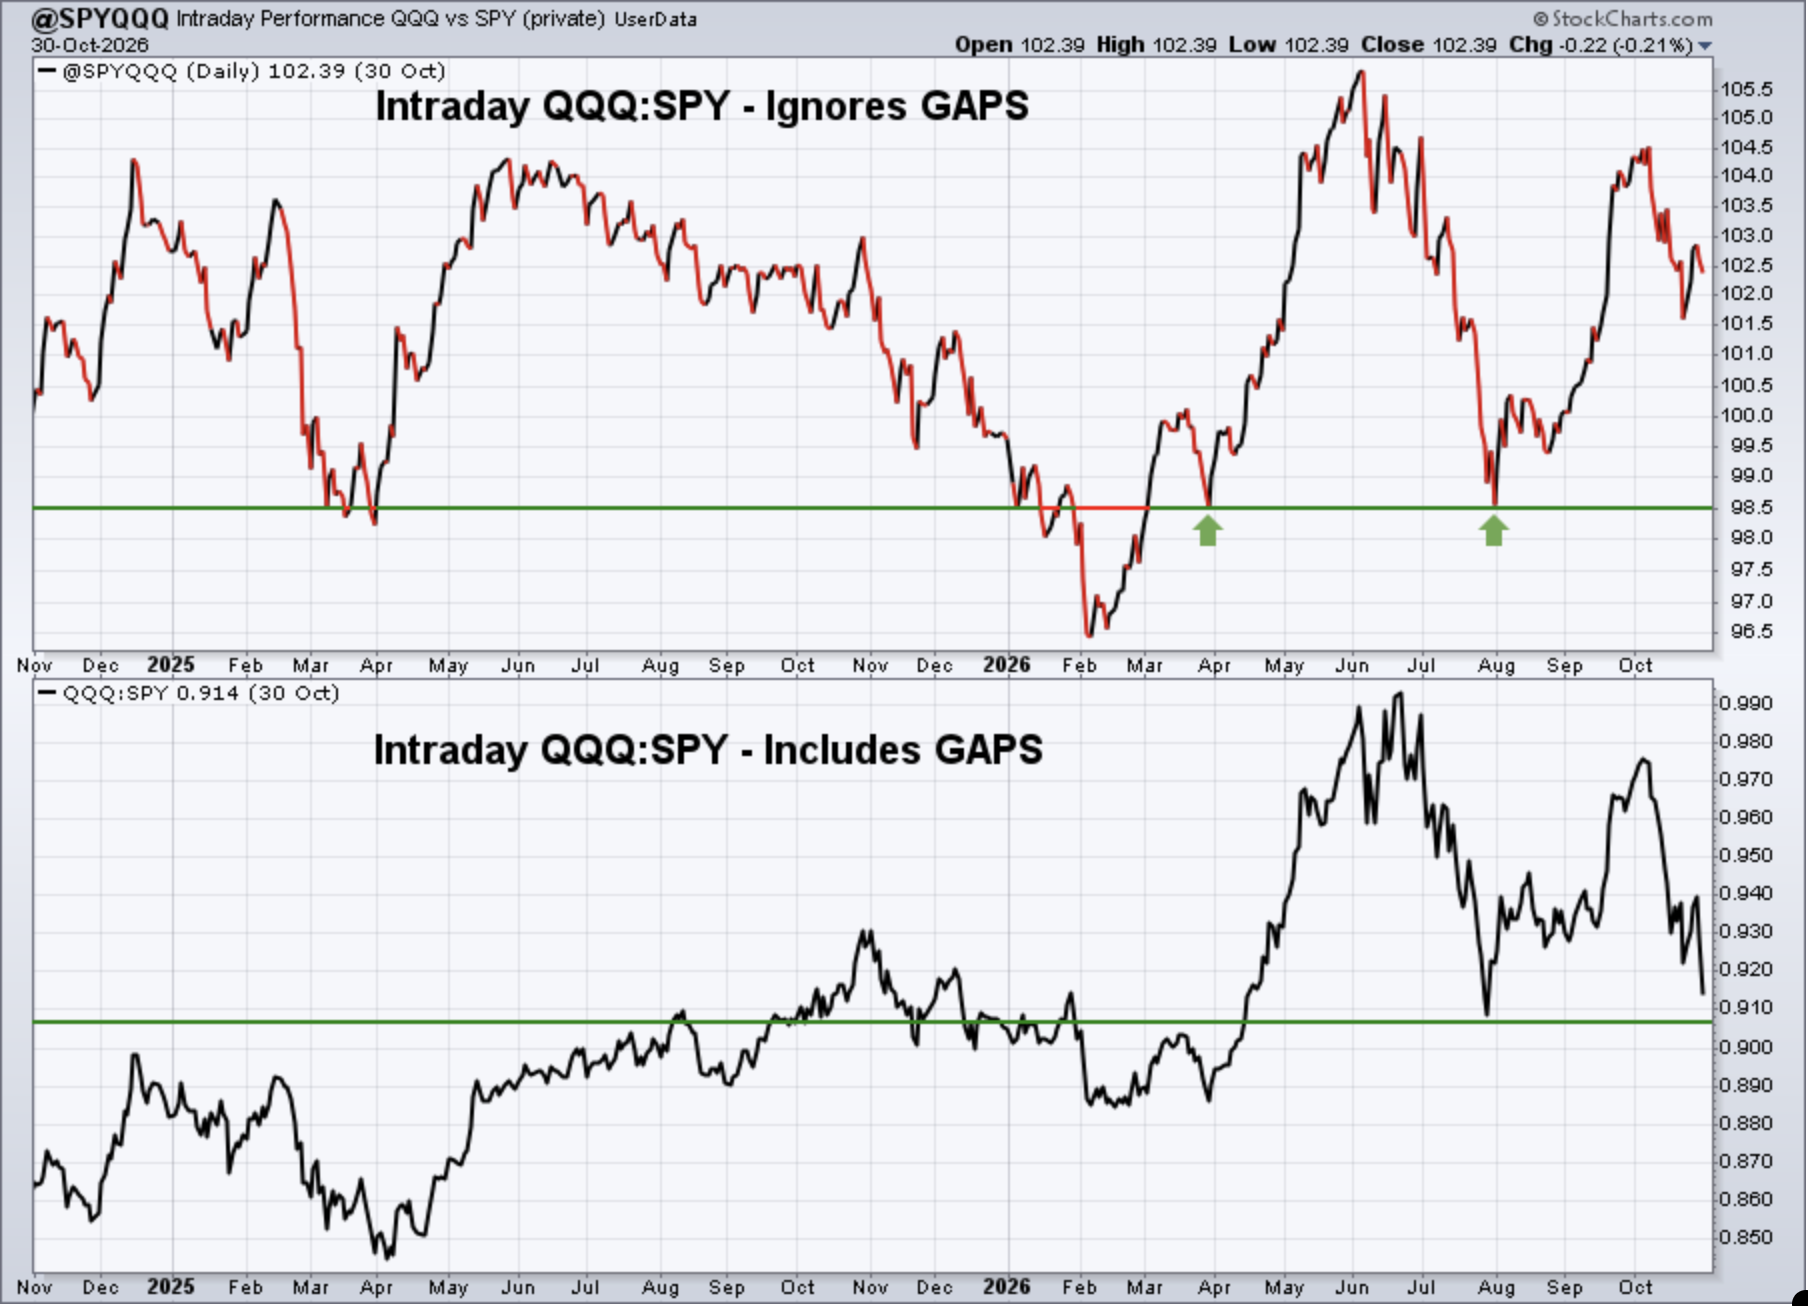
Keep in mind that the intraday analysis provided is a "work in progress". I continue to analyze this data to see if it helps provide us clues about calling market direction. It makes common sense to me that it should help in some sense, but it'll require a much longer-term study to determine its worth.
The intraday QQQ:SPY chart (excluding gaps) doesn't look nearly as bearish as the QQQ:SPY chart that includes gaps. What this tells me is that the weakness in many growth stocks is occurring mostly at the opening bell, not during the day when actual distribution by Wall Street can take place. Given that, I still believe that any further weakness we see in technology is very likely to be temporary. Fear and panic selling do make it difficult, however, to say when many of the AI and semiconductor stocks will hit a significant bottom.
IWM:QQQ
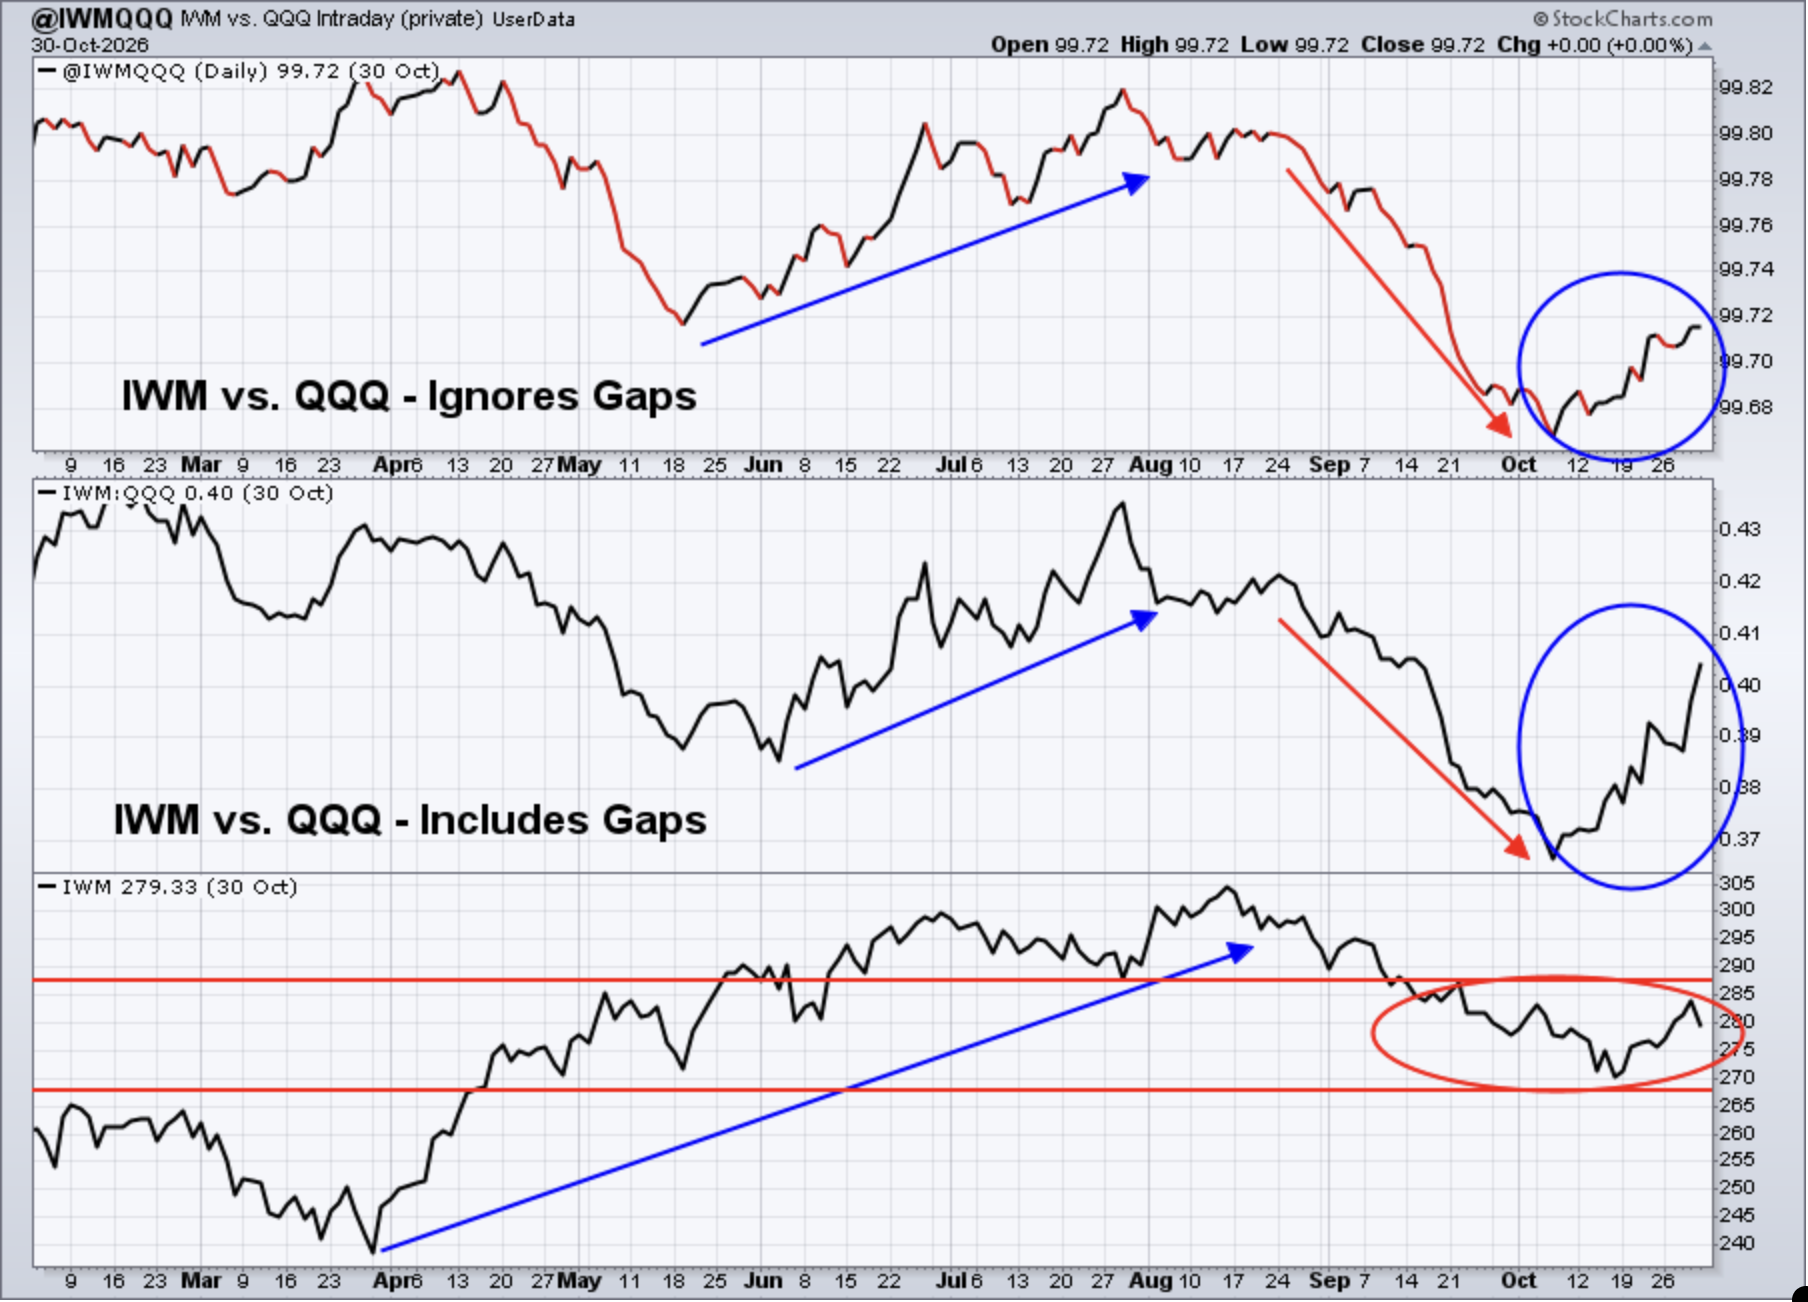
The IWM performance since reaching that 270 bottom shows clearly that money is rotating into small caps as we see it leave technology. The rally on the above chart is very encouraging.
XLY:XLP
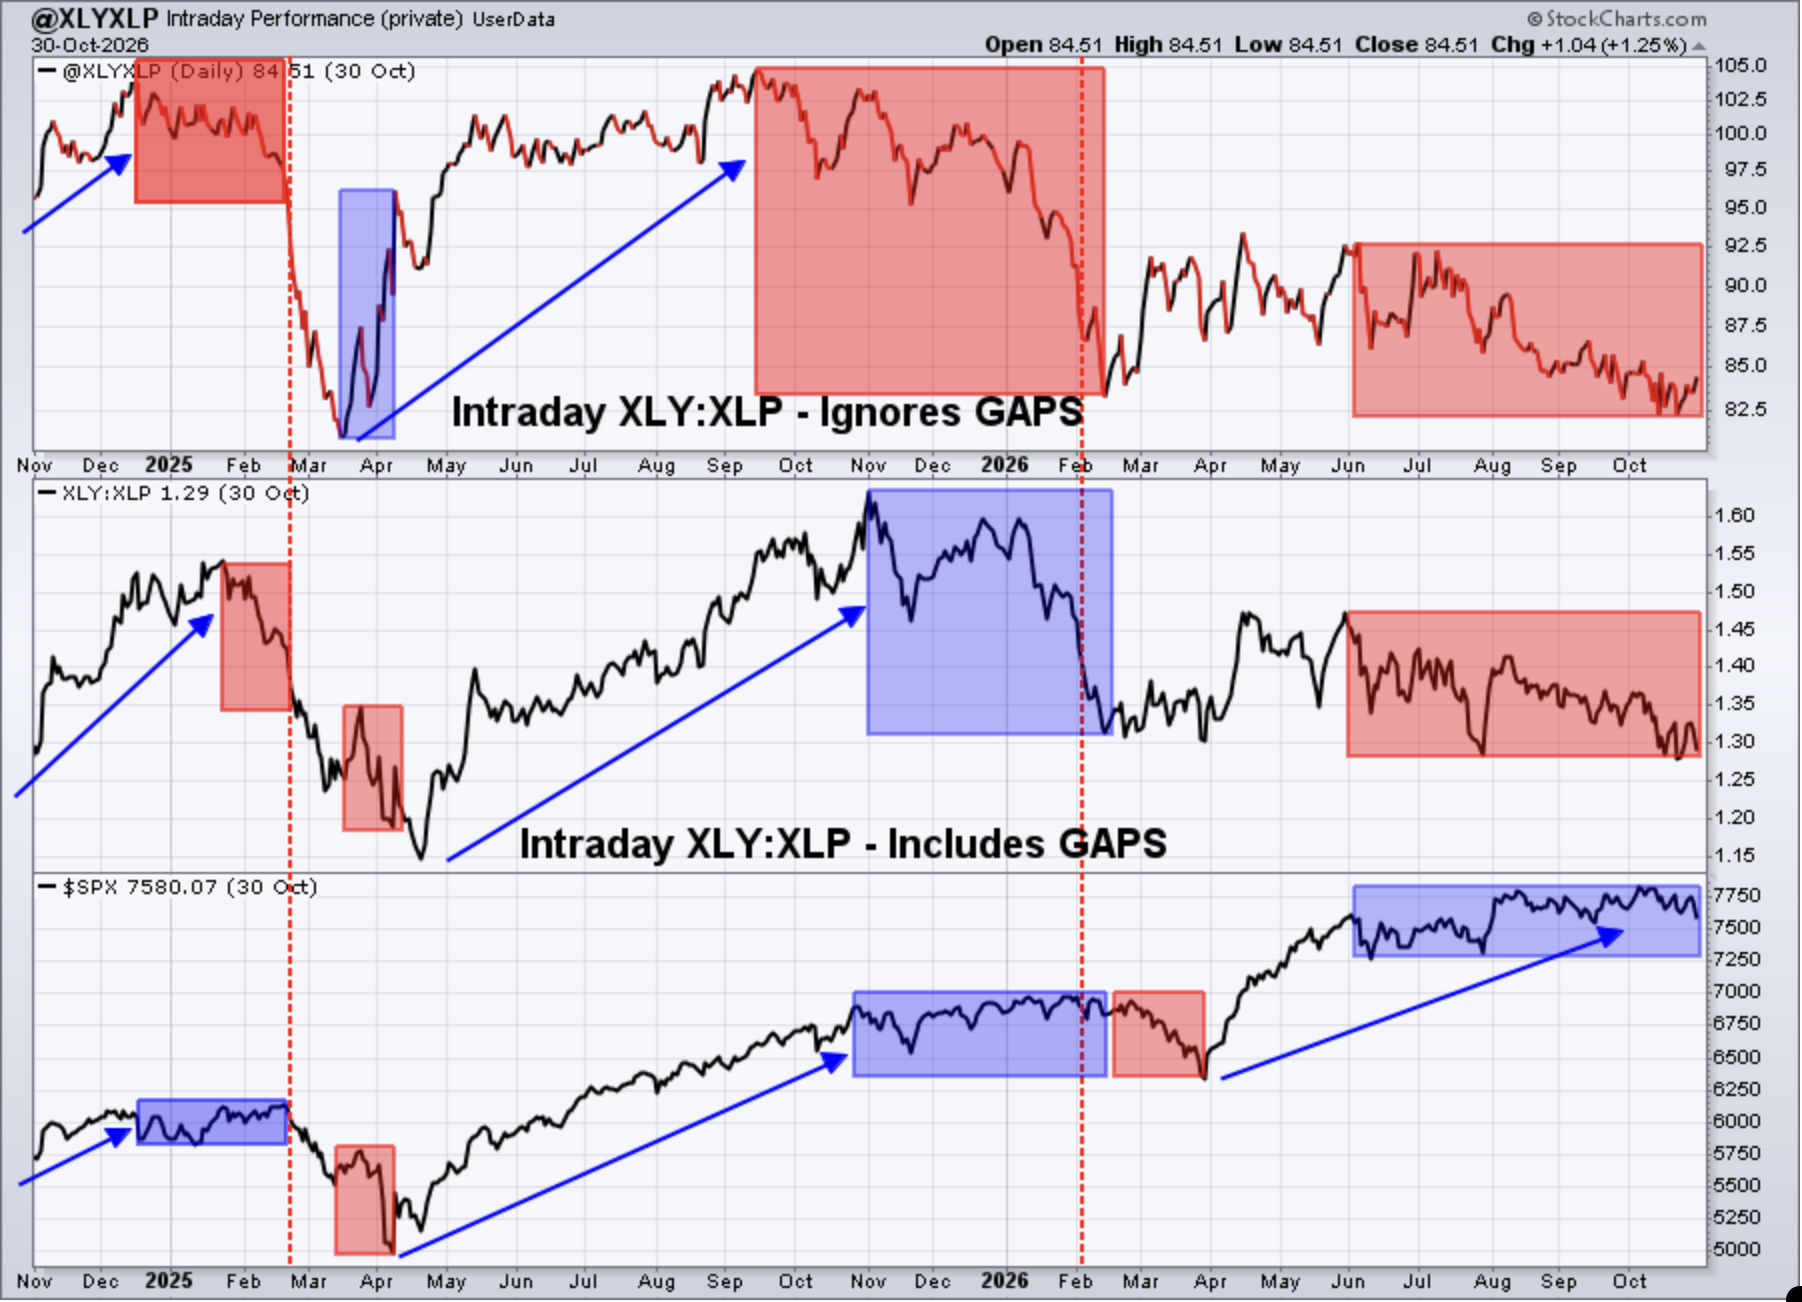
Consumer stocks still have issues, but we've seen a very strong rebound in discretionary (XLY) stocks of late. It was just a month ago that the XLY was nearing major long-term trendline support near 107-108. Since then, the XLY has exploded to 119 today which, remarkably, is not that far from an all-time high. I expected to see the XLY rally.....and it's rallying.
XLP 30-Day Cumulative Signal
Based on more than 25 years of back-tested data, I'm not going to consider this signal bearish unless it reaches the 106 level. Every major market downturn this century, other than the COVID pandemic, has seen this signal reach 106.
Here's where this signal currently resides:
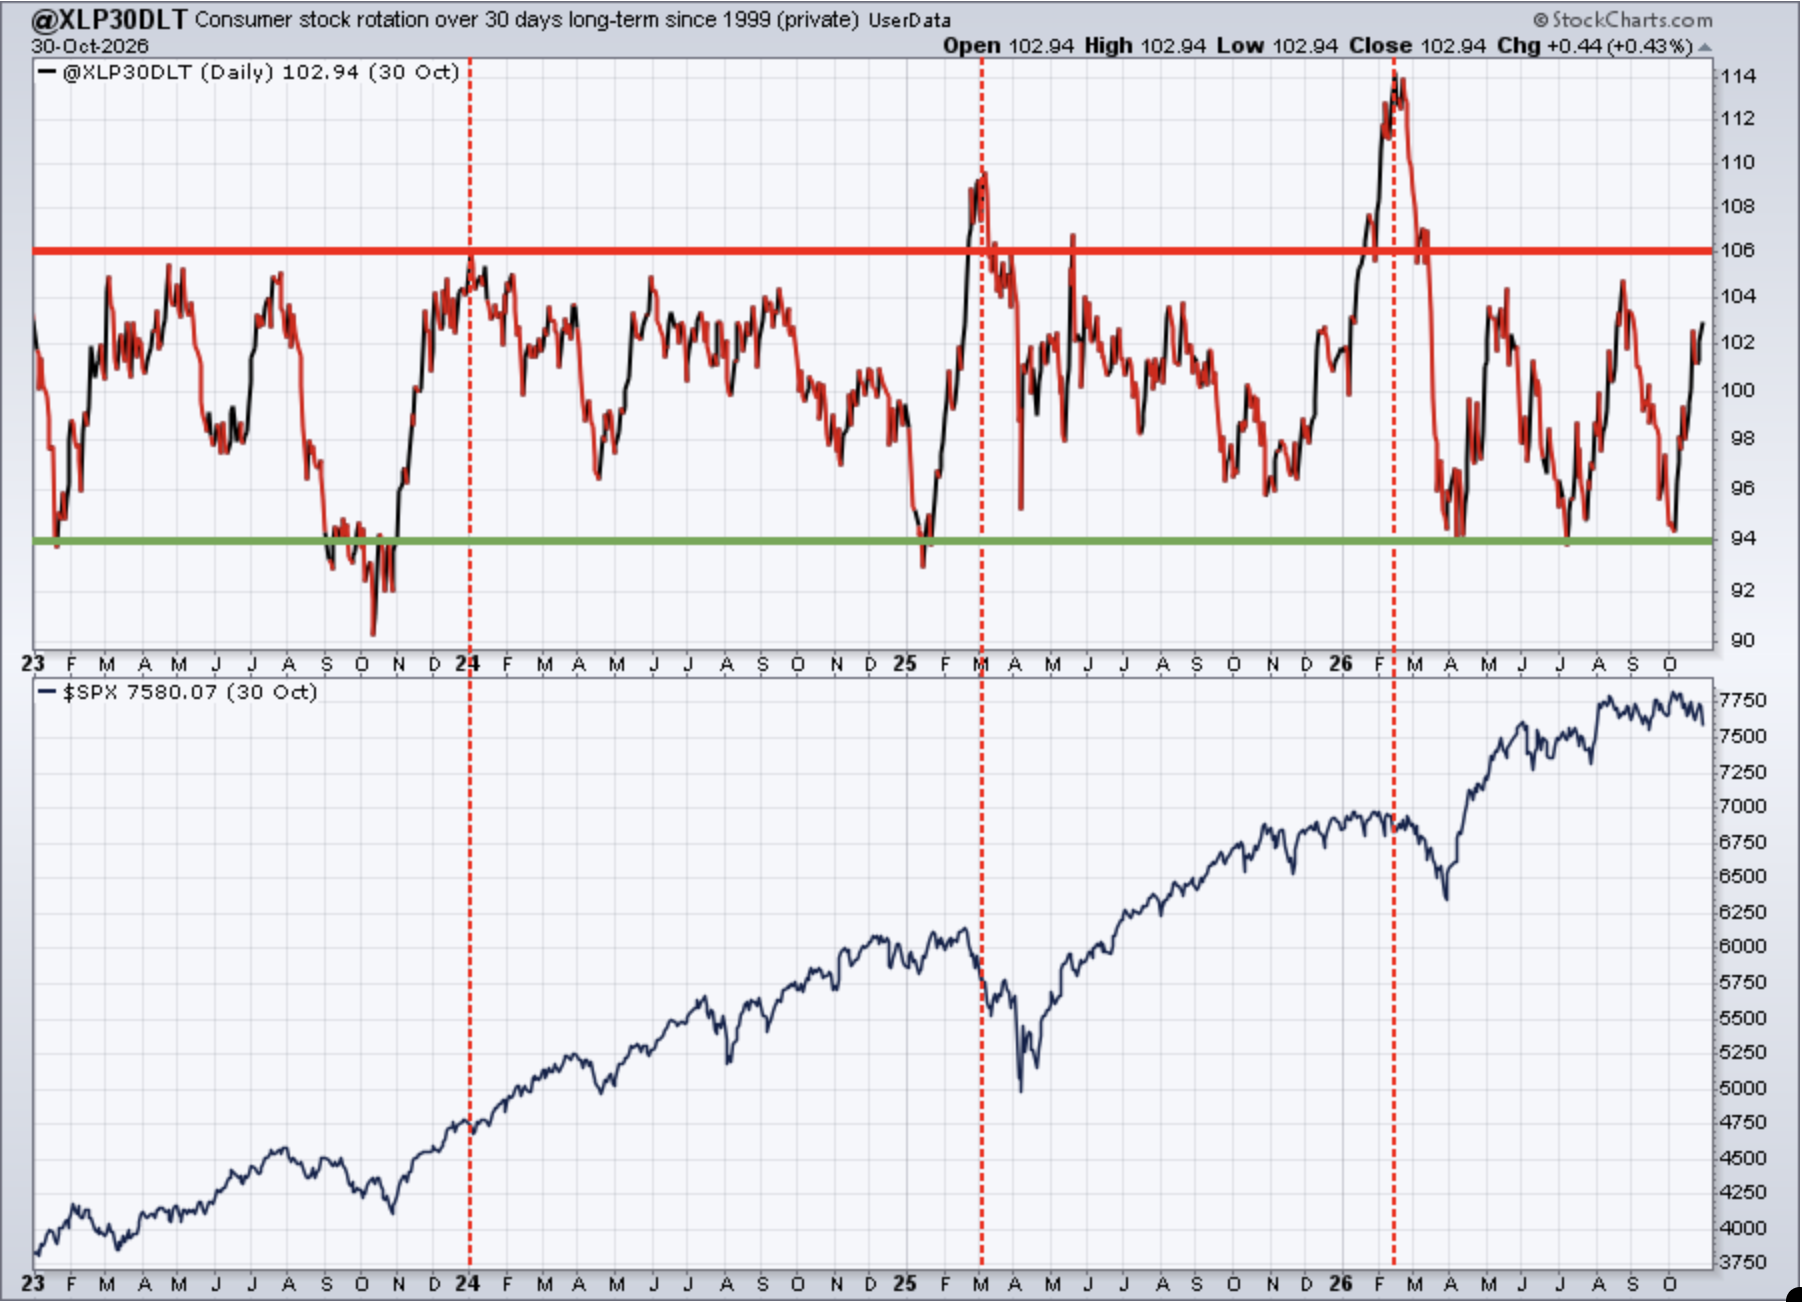
This cumulative 30-day reading is moving higher, but we're also seeing significant intraday rotation into discretionary as well. In fact, the XLY:XLP intraday ratio above has been climbing, not falling. The XLY:XLP ratio that includes gaps has been falling, but once again, that seems to indicate that traders are likely being manipulated at the opening bell, only to see accumulation in the more aggressive XLY during the trading day. I'll be watching in coming days and weeks to see if this intraday improvement in the XLY:XLP ratio continues. If so, that is unmistakably bullish.
Sentiment
5-day SMA ($CPCE)
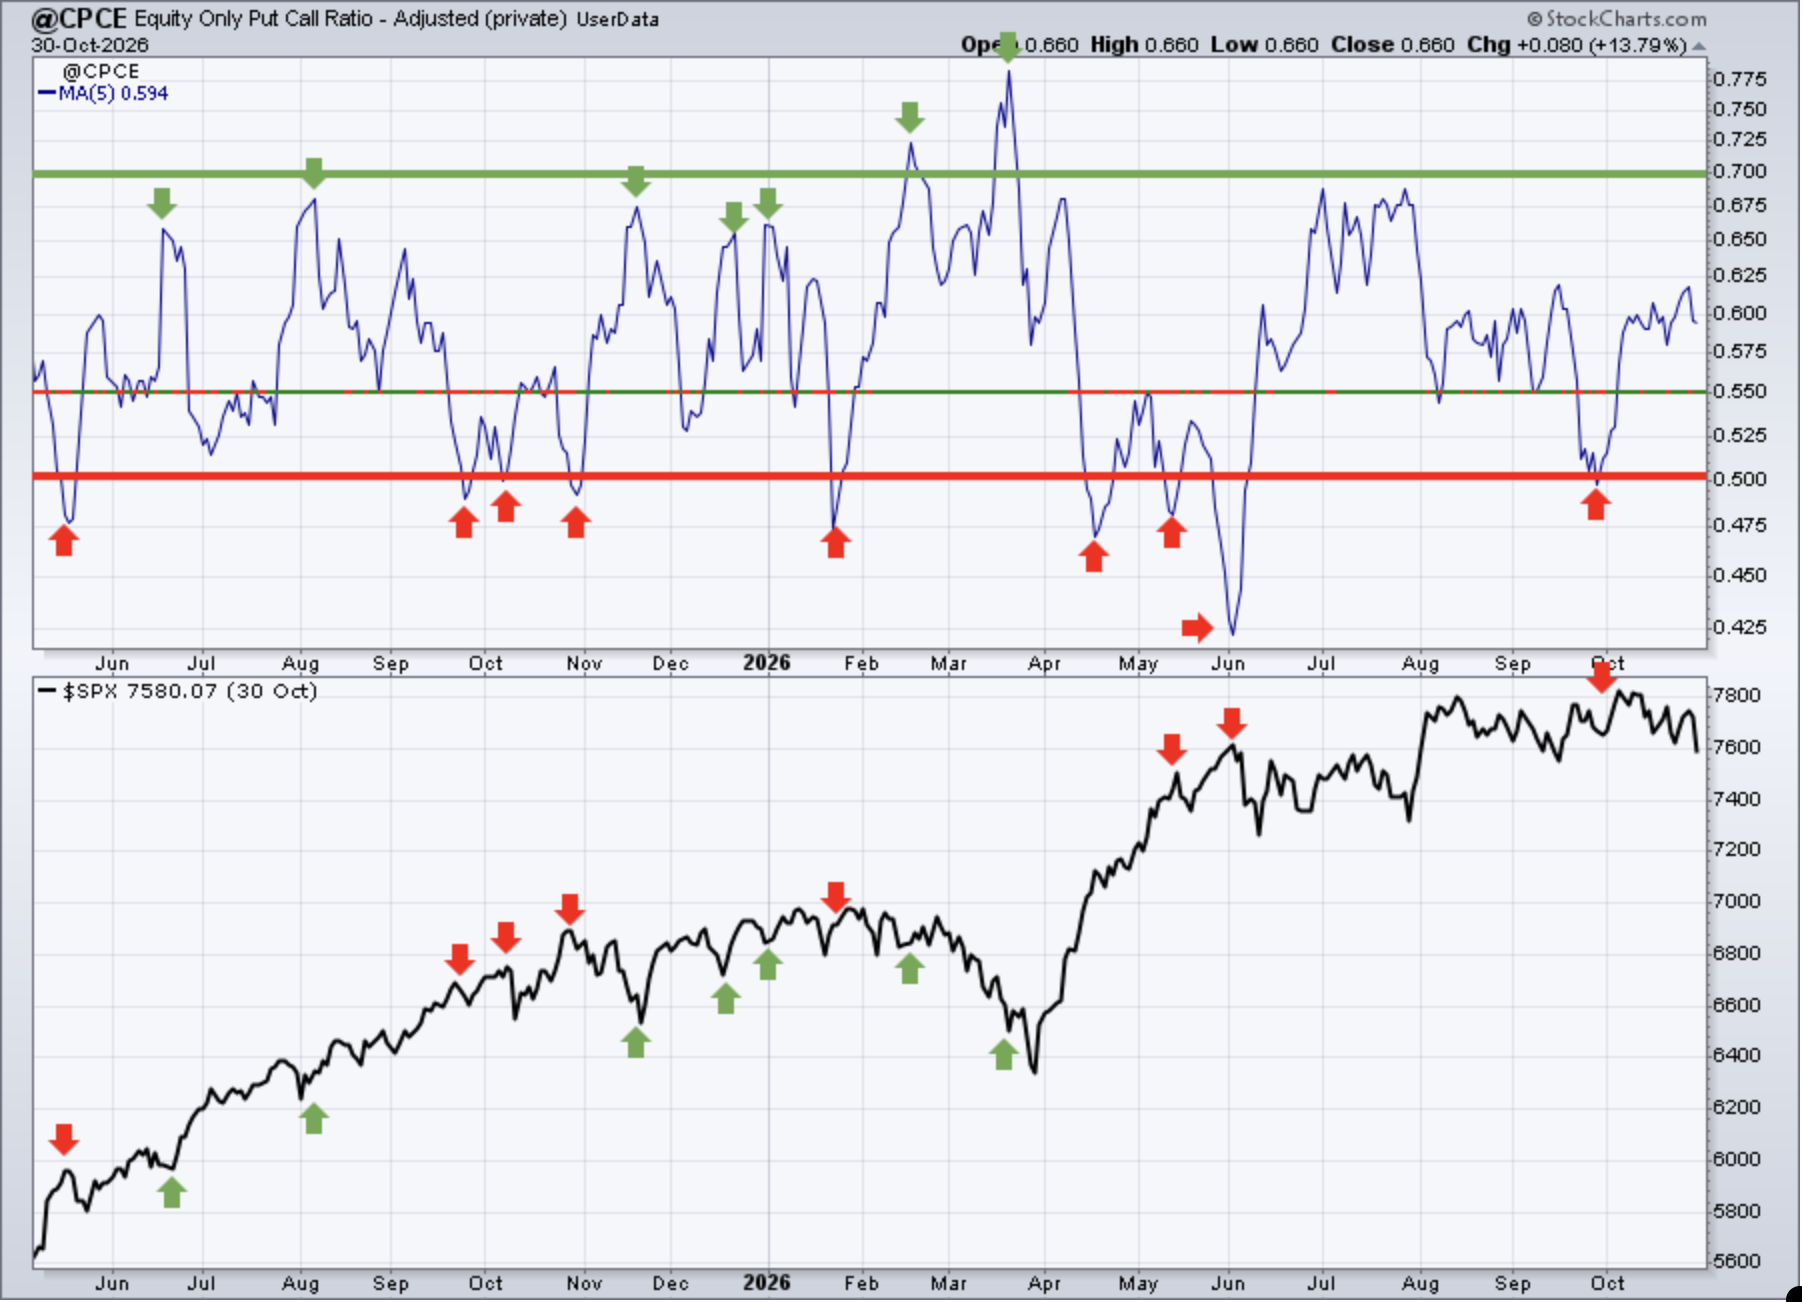
Sentiment indicators are contrarian indicators. When they show extreme bullishness, we need to be a bit cautious and when they show extreme pessimism, it could be time to become much more aggressive. Major market bottoms are carved out when pessimism is at its absolute highest level.
The 5-day CPCE is squarely in the neutral position, providing us few directional short-term clues, at least for now.
253-day SMA ($CPCE)
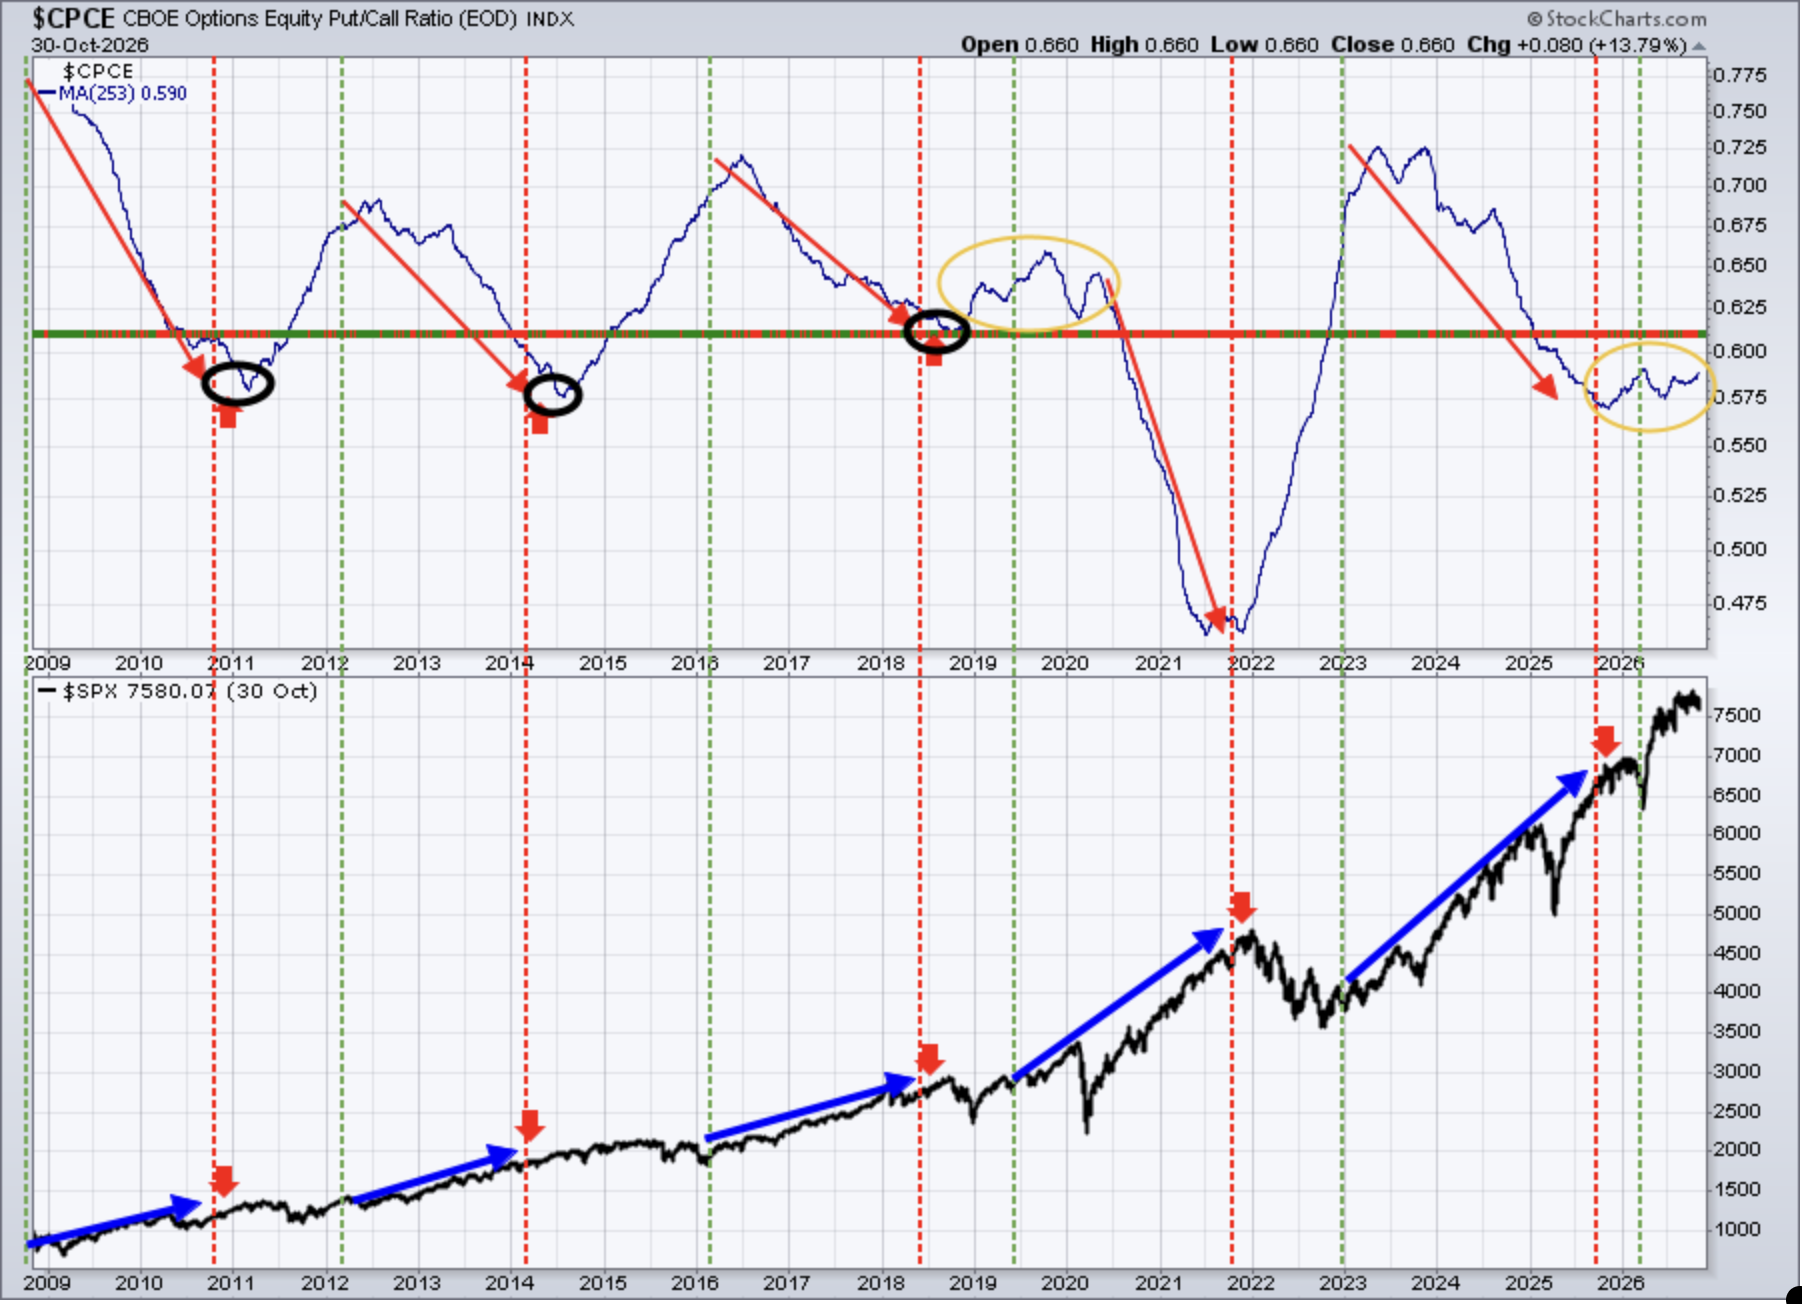
This longer-term 253-day SMA of the CPCE is our "ocean-liner" signal, unlike our short-term speedboat indicator. Any significant change in direction in this 253-day CPCE, in the past, has had profound effects on the S&P 500.
This is really a Big Picture kind of signal, so we have to be very careful not to jump to conclusions at every movement on this chart. It does appear that this signal is turning higher, which means longer-term caution. I would want to see several other bearish warning signs emerge over the next couple months to confirm further bearish developments in this 253-day CPCE.
Long-Term Trade Setups
Since beginning this Weekly Market Report in September 2023, I've discussed the long-term trade candidates below that I really like. Generally, these stocks have excellent long-term track records, and many pay nice dividends that mostly grow every year. Only in specific cases (exceptions) would I consider a long-term entry into a stock that has a poor or limited long-term track record and/or pays no dividends. I try to review the long-term picture once a month, and below is how I viewed each MONTHLY chart as of Monday, October 5th:
- JPM - pulling back with neg divergence, let's watch 20-month EMA at 300
- BA - monthly RSI has been between 40 and 60 for 4 years. Enough said.
- FFIV - more new highs being reached, bullish
- MA - mentioned last month handle could form to 500, just about there
- GS - neg divergence suggested caution in Sept and GS fell 10%, watch 830 level
- FDX - excellent long-term support from 240-265
- AAPL - now slightly overbought, but uptrend is very strong
- CHRW - losing 20-month EMA support, so could see drop to 110
- JBHT - recent selling should find support/buyers around 215
- STX - consolidation continuing after massive rally, remains bullish
- HSY - drop below 170 now brings 140 support into play potentially
- DIS - every move up for past decade seems to get little follow through
- MSCI - very lengthy consolidation, excellent support in 500-520 range
- SBUX - 5-year consolidation still in play, need break above 112 or so
- KRE - on 2-month losing streak, but still trades comfortably above 20-mo EMA
- ED - currently trading in uptrend, near both price support and 20-month EMA
- AJG - September reversal lower now suggesting further consolidation ahead
- NSC - cup with handle breakout still bullish, but look for 20-month EMA test
- RHI - never quite reached 250 resistance, now rolling over again
- ADM - hit 2022 resistance, expect downside to 20-month EMA closer to 70
- BG - pullback to 20-month EMA looks like solid long-term entry point
- CVS - given strong monthly PPO, further selling to 20-day EMA buyable
- HRL - monthly pos divergence, which suggests selling momentum slowing
- DE - gaining strength and momentum, looks to head higher
- LULU - something just isn't right here, no relief; look to 80 for next support
- TTD - removing TTD going forward, renewed selling below 13 very bearish
- META - challenged all-time high in September, regaining strength
- ADBE - 20-month EMA not quite reached, rolling over again
- KMB - 115 resistance stalled advance, now looking to hold 90 support
- ORCL - held major long-term support at 115, trading on its 50-month SMA
- ABBV - strengthening, rising 20-month EMA should continue to offer support
- MCD - monthly RSI now under 35, very oversold, could see trip to 210
- MKC - breaking below May low with yield now over 4.25%; interesting buy
- TSCO - monthly PPO very weak, bounce short-lived, could 20 be possible?
Keep in mind that our Weekly Market Reports favor those who are more interested in the long-term market picture. Therefore, the list of stocks above are stocks that we believe are safer (but nothing is ever 100% safe) to own with the long-term in mind. Nearly everything else we do at EarningsBeats.com favors short-term momentum trading, so I wanted to explain what we're doing with this list and why it's different.
Also, please keep in mind that I'm not a Registered Investment Advisor (and neither is EarningsBeats.com nor any of its employees) and am only providing (mostly) what I believe to be solid dividend-paying stocks for the long term. Companies periodically go through adjustments, new competition, restructuring, management changes, etc. that can have detrimental long-term impacts. Neither the stock price nor the dividend is ever guaranteed. I simply point out interesting stock candidates for longer-term investors. Do your own due diligence and please consult with your financial advisor before making any purchases or sales of securities.
Looking Ahead
Upcoming Earnings
The following list of companies is NOT a list of all companies scheduled to report quarterly earnings, however, just key reports, so please be sure to check for earnings dates of any companies that you own. Any company in BOLD represents a stock in one of our portfolios and the amount in parenthesis represents the market capitalization of each company listed:
- Monday: AAPL ($5.09 trillion), PLTR ($472 billion), VRTX ($137 billion), MAR ($104 billion)
- Tuesday: AMD ($925 billion), AMGN ($249 billion), ANET ($232 billion), SHOP ($215 billion), BKNG ($113 billion)
- Wednesday: ARM ($244 billion), QCOM ($198 billion), MCD ($182 billion), UBER ($134 billion), DDOG ($95 billion)
- Thursday: COP ($180 billion), PH ($117 billion), NET ($110 billion), ABNB ($100 billion), MNST ($91 billion)
- Friday: ENB ($110 billion), MRNA ($89 billion), HUM ($50 billion)
Key Economic Reports
- Monday: October PMI manufacturing, October ISM manufacturing, September construction spending
- Tuesday: September JOLTS, September factory orders
- Wednesday: October ADP employment report, October PMI services
- Thursday: Initial jobless claims, Q3 productivity & costs
- Friday: October nonfarm payrolls, unemployment report & average hourly earnings, November consumer sentiment
Historical Data
I'm a true stock market historian. I am absolutely PASSIONATE about studying stock market history to provide us more clues about likely stock market direction and potential sectors/industries/stocks to trade. While I don't use history as a primary indicator, I'm always very aware of it as a secondary indicator. I love it when history lines up with my technical signals, providing me with much more confidence to make particular trades.
Below you'll find the next two weeks of historical data and tendencies across the three key indices that I follow most closely. The percentage for each calendar day represents the annualized return for that day. An example of how this is calculated is reflected next to the first day under the S&P 500 and in parenthesis:
S&P 500 (since 1950)
- Nov 2: +79.69% (Ex: cumulative gains =
+15.75% over 50 trading days since 1950. +15.75% x 253/50 = +79.69%) - Nov 3: +97.04%
- Nov 4: +43.73%
- Nov 5: +78.00%
- Nov 6: -16.85%
- Nov 7: -6.57%
- Nov 8: +22.15%
- Nov 9: -10.78%
- Nov 10: +42.30%
- Nov 11: +49.20%
- Nov 12: -19.00%
- Nov 13: +18.39%
- Nov 14: +4.64%
- Nov 15: -13.59%
NASDAQ (since 1971)
- Nov 2: +101.17%
- Nov 3: +98.38%
- Nov 4: +87.56%
- Nov 5: +110.28%
- Nov 6: +30.04%
- Nov 7: -31.79%
- Nov 8: -4.82%
- Nov 9: -62.87%
- Nov 10: +24.49%
- Nov 11: +65.61%
- Nov 12: -5.72%
- Nov 13: +53.16%
- Nov 14: -1.92%
- Nov 15: -29.39%
Russell 2000 (since 1987)
- Nov 2: +133.34%
- Nov 3: +164.65%
- Nov 4: +56.52%
- Nov 5: +80.33%
- Nov 6: +74.19%
- Nov 7: -66.50%
- Nov 8: +26.02%
- Nov 9: -54.42%
- Nov 10: +69.15%
- Nov 11: +22.21%
- Nov 12: -110.78%
- Nov 13: +117.66%
- Nov 14: -15.29%
- Nov 15: -13.20%
The S&P 500 data dates back to 1950, while the NASDAQ and Russell 2000 information date back to 1971 and 1987, respectively.
Final Thoughts
The AI trade and many semiconductor stocks renewed their earlier selloffs from July. That area of the market contains a TON of market cap, so when they sell off, one of two things will happen. Either we'll see the major indices TUMBLE or we'll see massive rotation into other areas that previously were left behind. While the indices have fallen somewhat, I'd say there's been a significant amount of rotation with consumer discretionary (XLY) and financials (XLF) benefiting among aggressive sectors, while most value-oriented sectors gained as well.
Here's what I'll be thinking about and watching this week:
Earnings. Alphabet (GOOGL), Microsoft (MSFT), and Amazon.com (AMZN) didn't do much to persuade buyers after their earnings reports last week, but what about Apple (AAPL)? Can AAPL encourage buyers to re-enter the Mag 7 trade? AAPL is at a 6-month relative high vs. its computer hardware ($DJUSCR) peers and the group, as a whole, has been a very solid relative performer vs. the benchmark S&P 500. So there's definitely hope for AAPL after the close today.
Jobs. What do we want to see on Friday? A weak jobs number would be great to keep the Fed at bay and hold interest rates steady, but it might also trigger recessionary fears. A strong jobs number, though, keeps the Fed in play, especially since Fed Chief Warsh has indicated on multiple occasions that the Fed is going to crush inflation. If we get a strong jobs report, I'd look for a selloff in treasuries, with yields spiking once again. That, in turn, could spell a short-term end to relative strength in small caps and other interest-rate-sensitive areas. If money rotates away from areas that have been strengthening of late, does it move back into the AI trade? Friday will be interesting.
Seasonality vs. Technical Conditions. History tells us to stay long and strong for the next 2 1/2 months. But we're also seeing a few technical cracks in the foundation at the same time, especially in the aggressive NASDAQ 100. So far, I believe that signs are pointing to our major indices remaining in their current secular bull market advance/consolidation.
Happy trading!
Tom