
EB Weekly Market Report - Monday, September 21, 2026
ChartLists/Spreadsheets
The following ChartLists have been updated and will be posted to our website later today, if they haven't already been:
- Strong AD (SADCL)
- Bullish Trifecta (BTCL)
- Short Squeeze (SSCL)
- Leading Stocks (LSCL)
- Matt's Hot Stocks (HTCL)
The Strong Earnings (SECL), Strong Future Earnings (SFECL), and Raised Guidance (RGCL) ChartLists were updated within the same ChartList as last week. In order to get the updated version, simply re-download the ChartLists that you downloaded last week from our website. The same passwords will work.
The Key Manipulation spreadsheet has been updated through Friday, September 18, 2026. You can view and/or download this spreadsheet from our website.
Upcoming Earnings ChartLists will not be provided again until Q3 earnings season kicks off in mid-October.
Weekly Market Recap
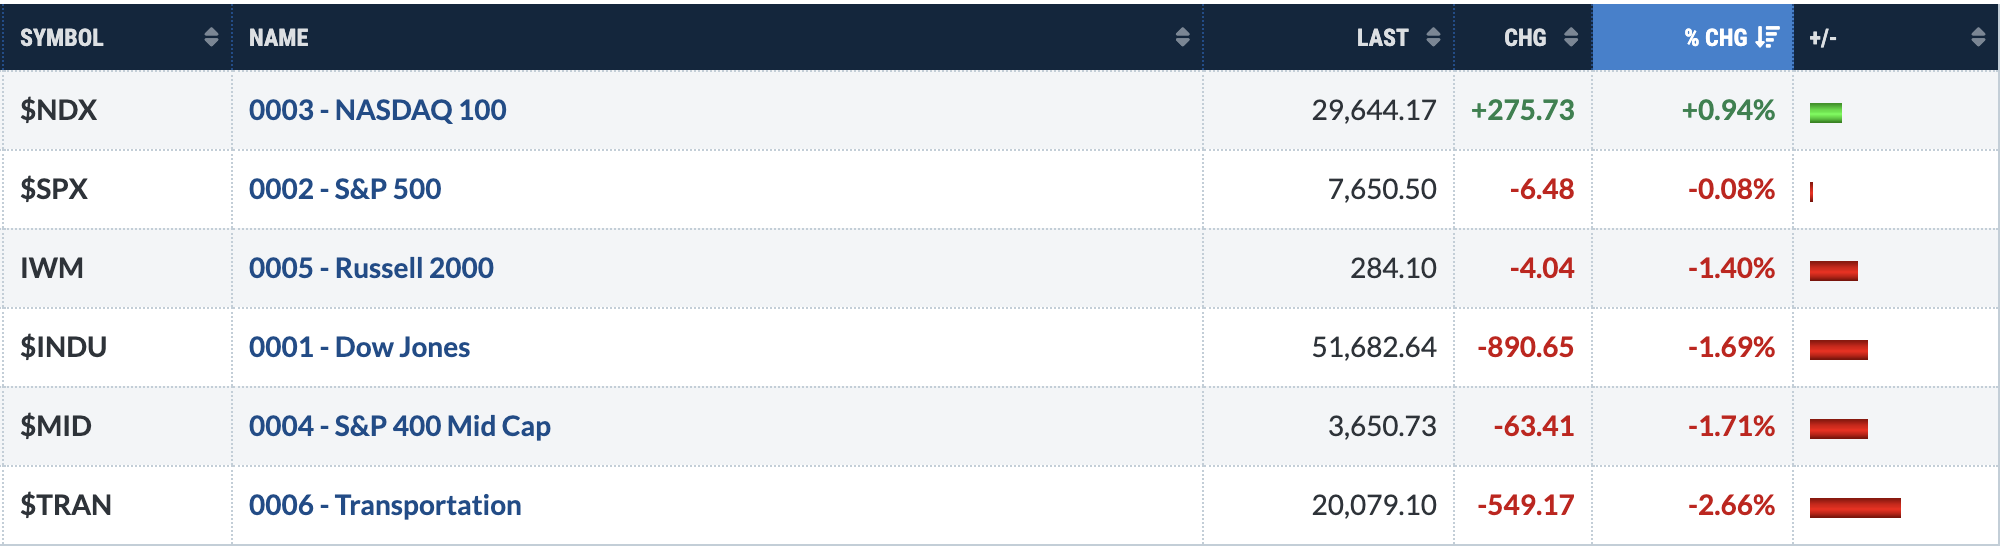
Major Indices
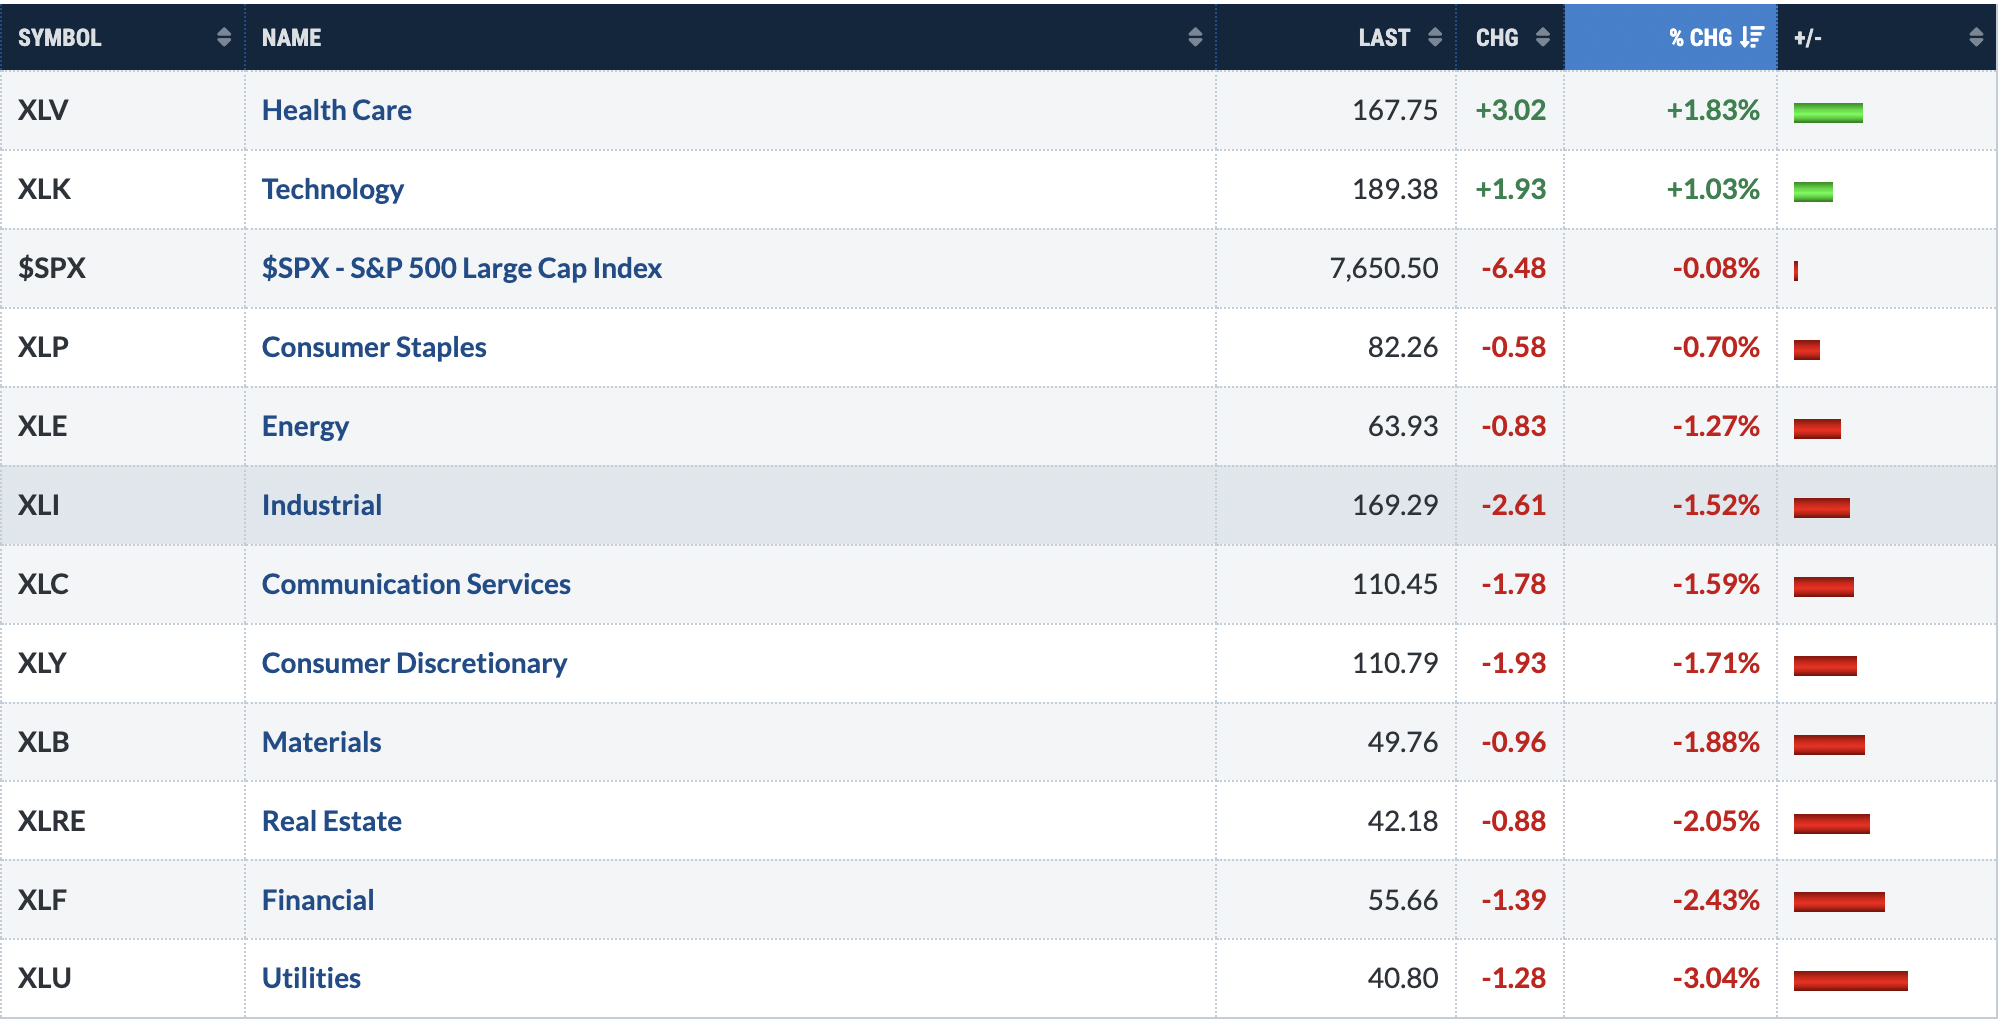
Sectors
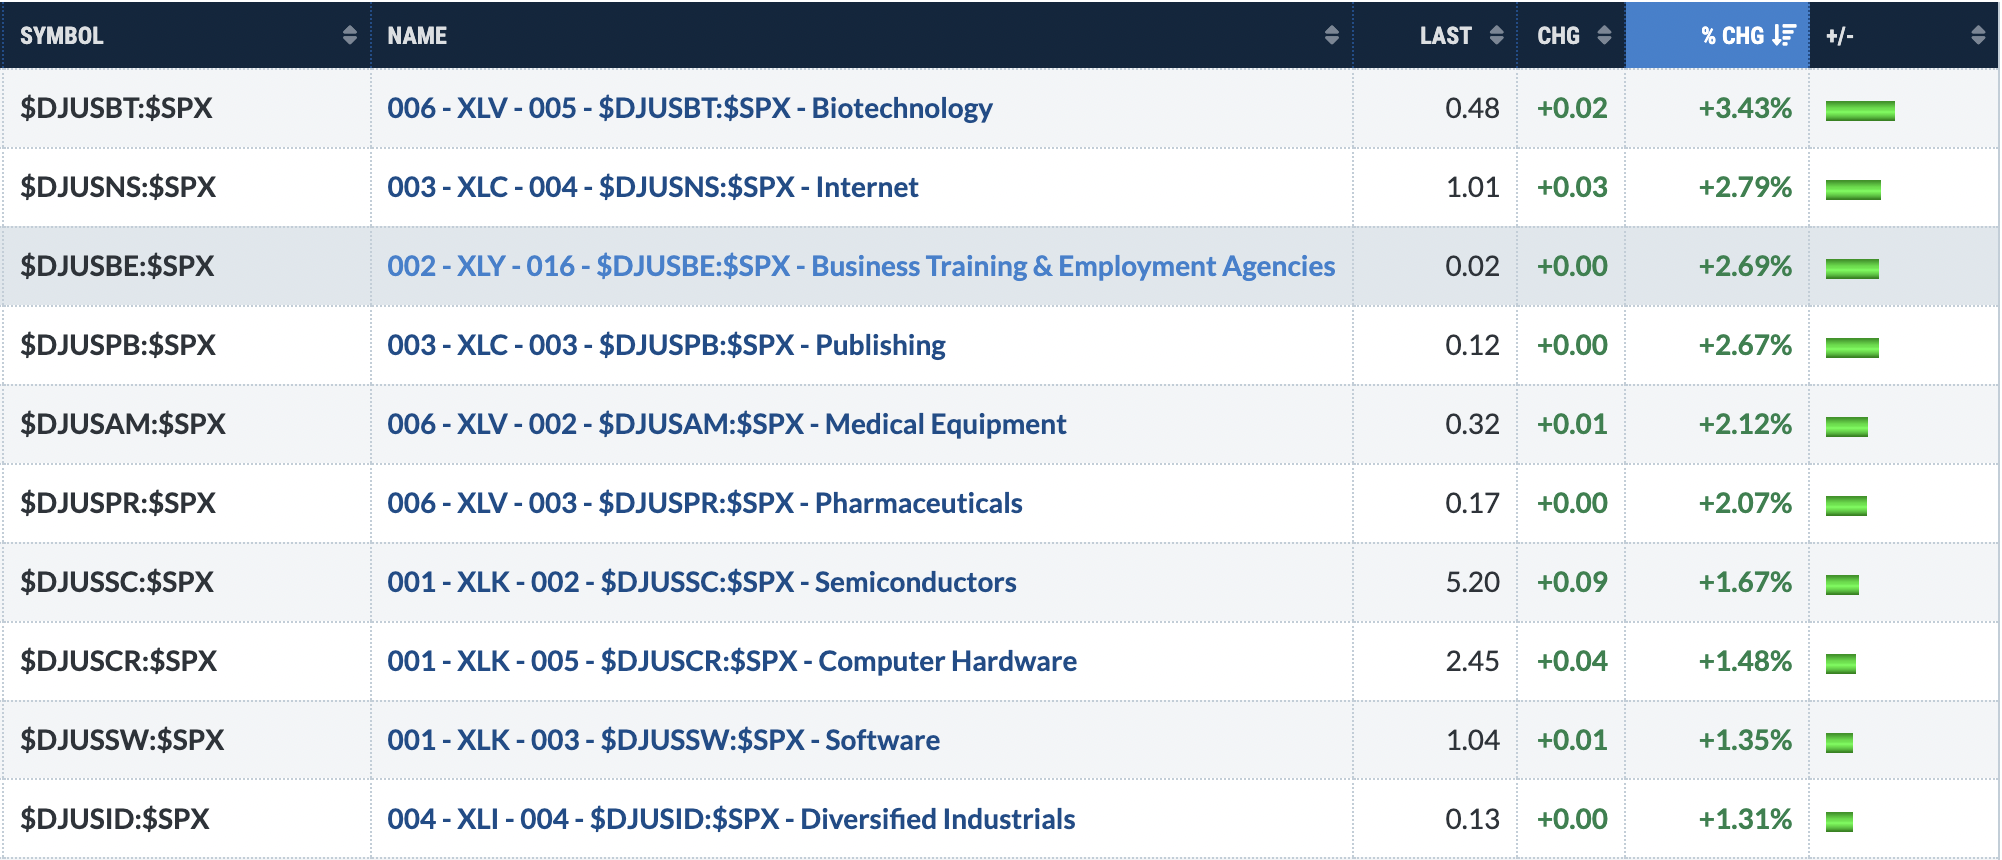
Top 10 Industries Last Week
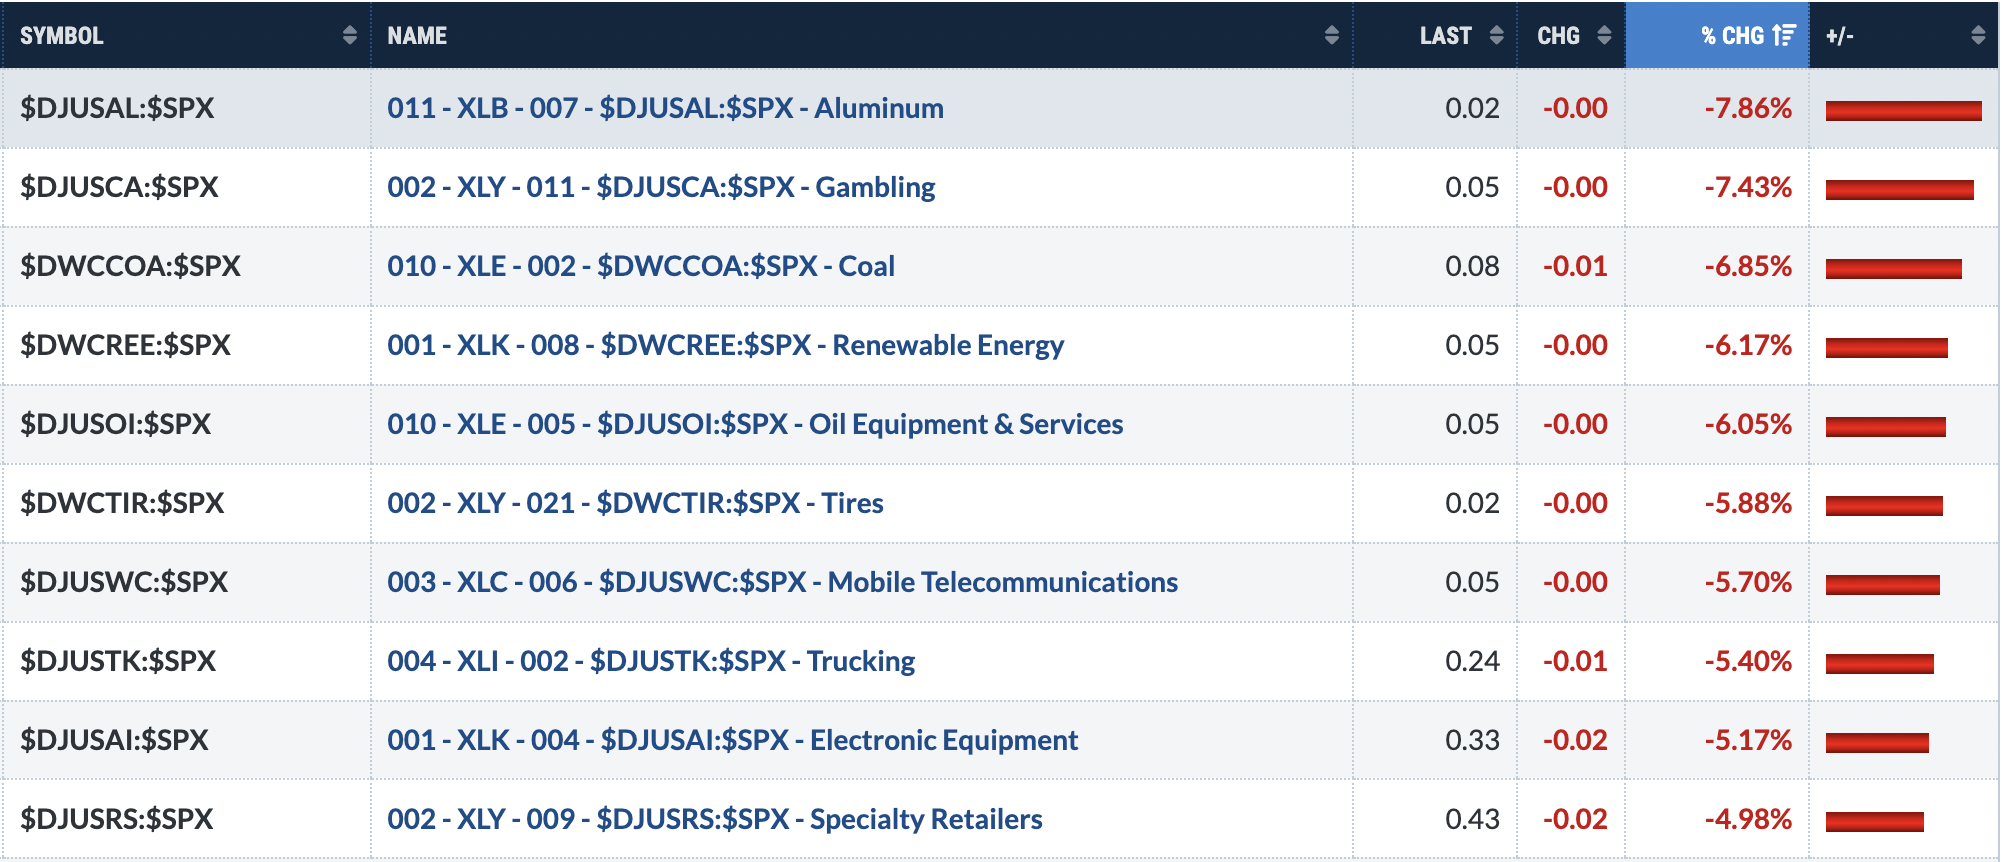
Bottom 10 Industries Last Week
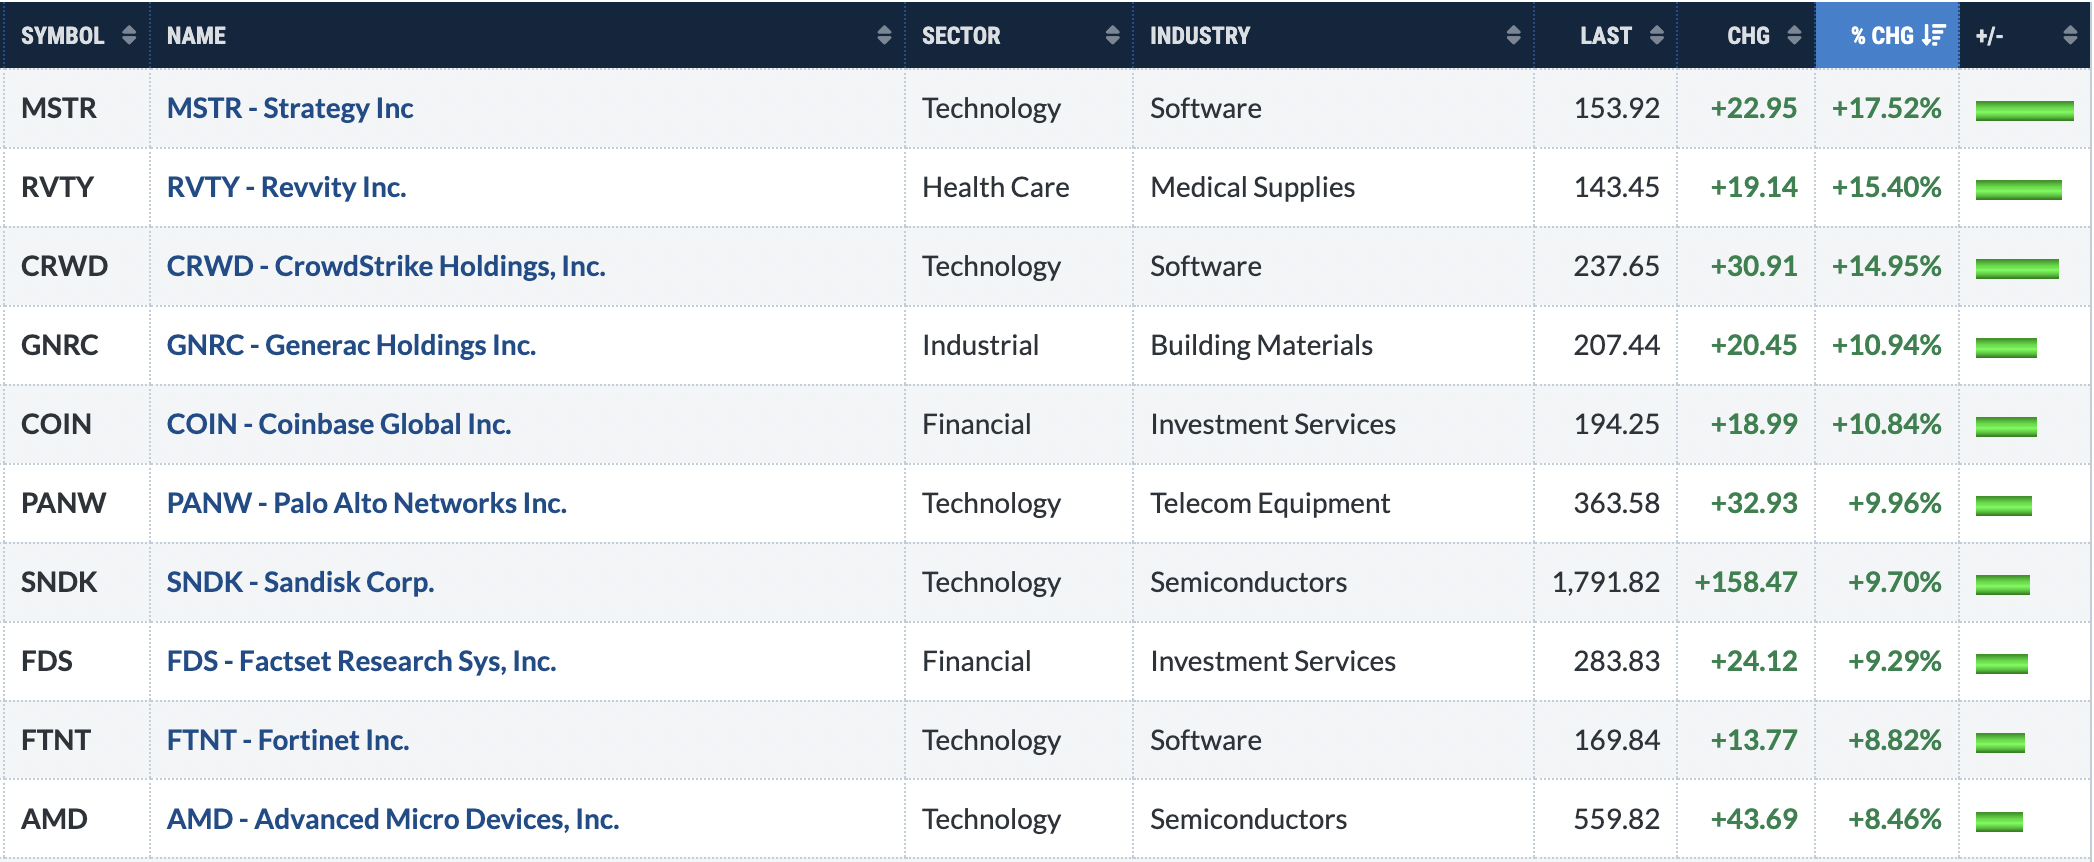
Top 10 Stocks - S&P 500/NASDAQ 100
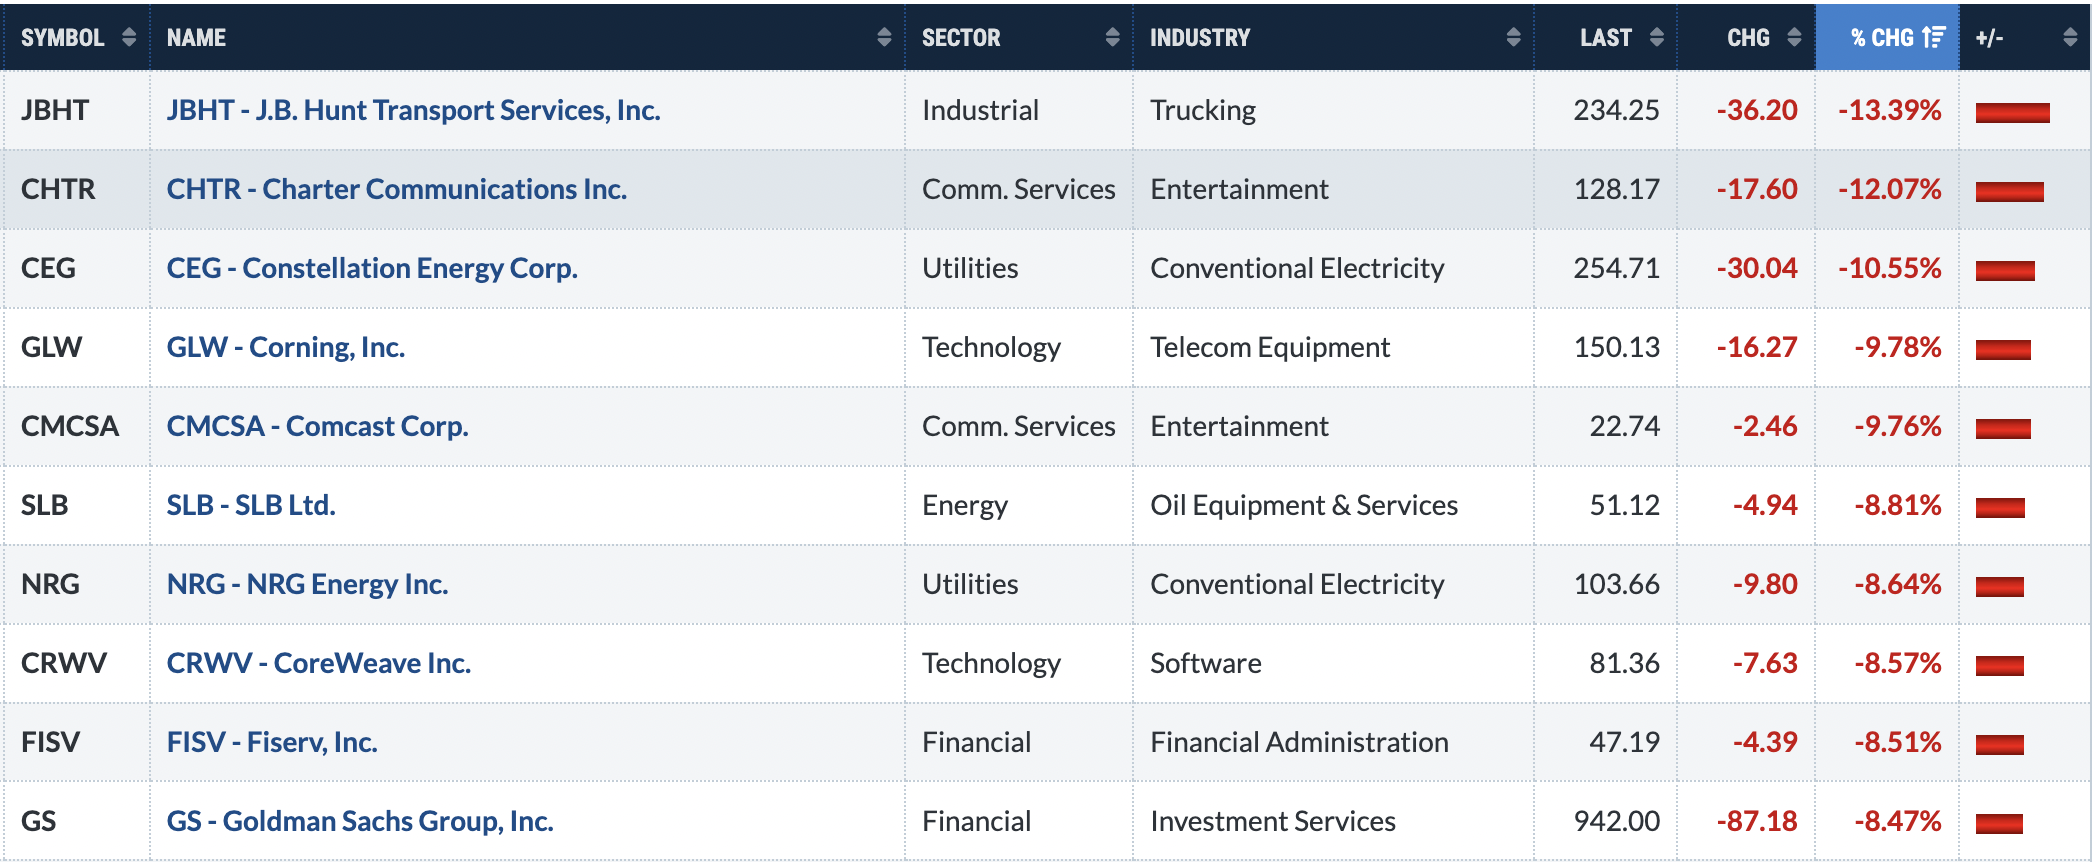
Bottom 10 Stocks - S&P 500/NASDAQ 100
Big Picture
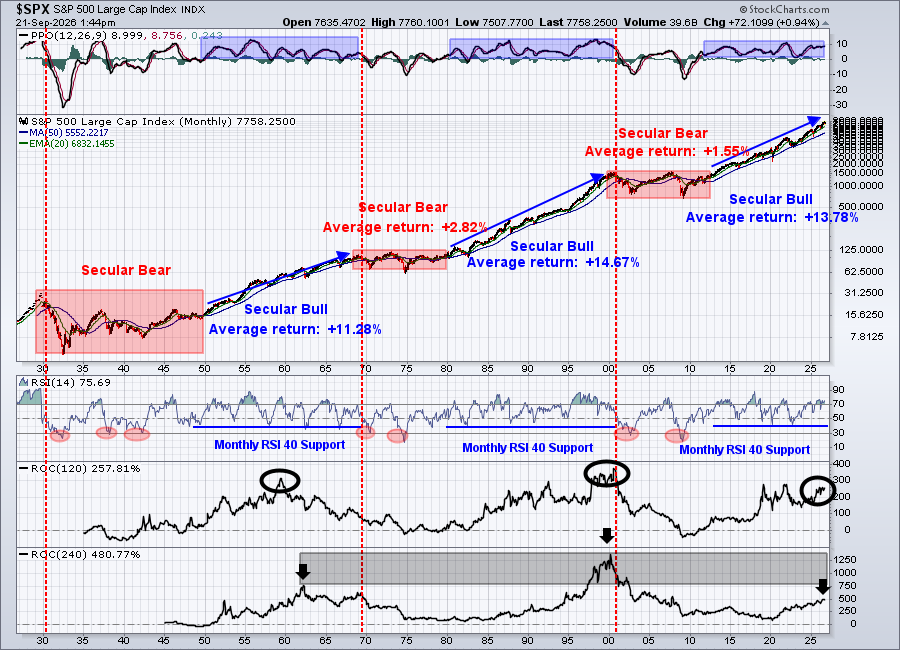
The Federal Reserve hiked interest rates for the first time since July 2023 this past week. While that may seem like an event that could impact the long-term secular bull market currently in place, history tells us this is not the case. We do, many times, weaken for a brief period after a new hiking cycle begins, but that typically wears off and the stock market pushes to new highs. Therefore, I'd continue to ignore the media noise and remain IN the market for the long-term.
Stay the course.
Sustainability Ratios
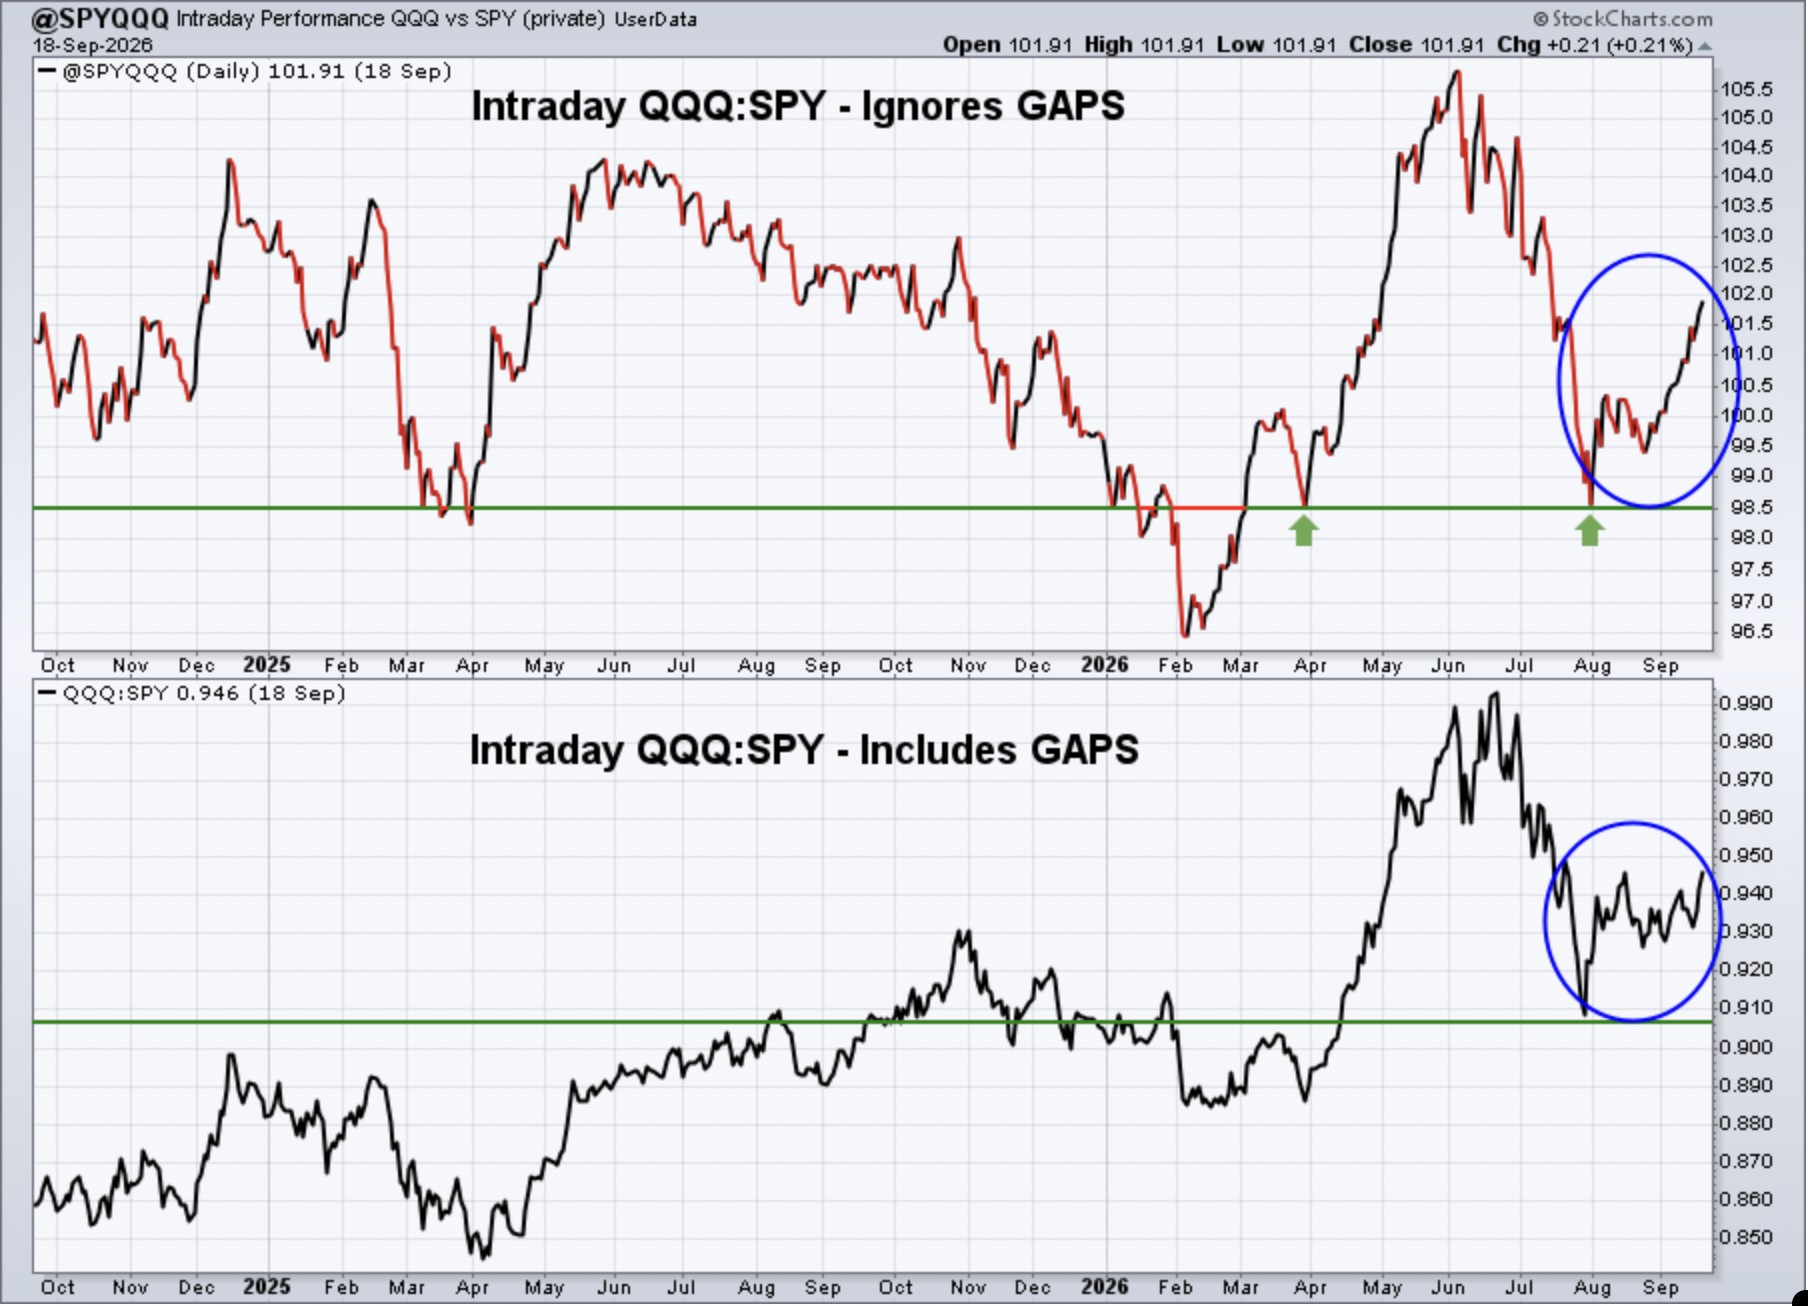
Here's the latest look at our key intraday ratios as we follow where the money is traveling on an INTRADAY basis (ignoring gaps):
QQQ:SPY
Keep in mind that the intraday analysis provided is a "work in progress". I continue to analyze this data to see if it helps provide us clues about calling market direction. It makes common sense to me that it should help in some sense, but it'll require a much longer-term study to determine its worth.
This chart tells me that being bearish is NOT the proper call right now. Could we move lower in the near-term? Sure, anything can happen and we know it's September. But intraday rotation is showing that money is rotating INTO more large-cap growth-oriented stocks. That is NOT the type of behavior we see prior to a major market decline. I'll stick with my bullish long-term stance.
IWM:QQQ
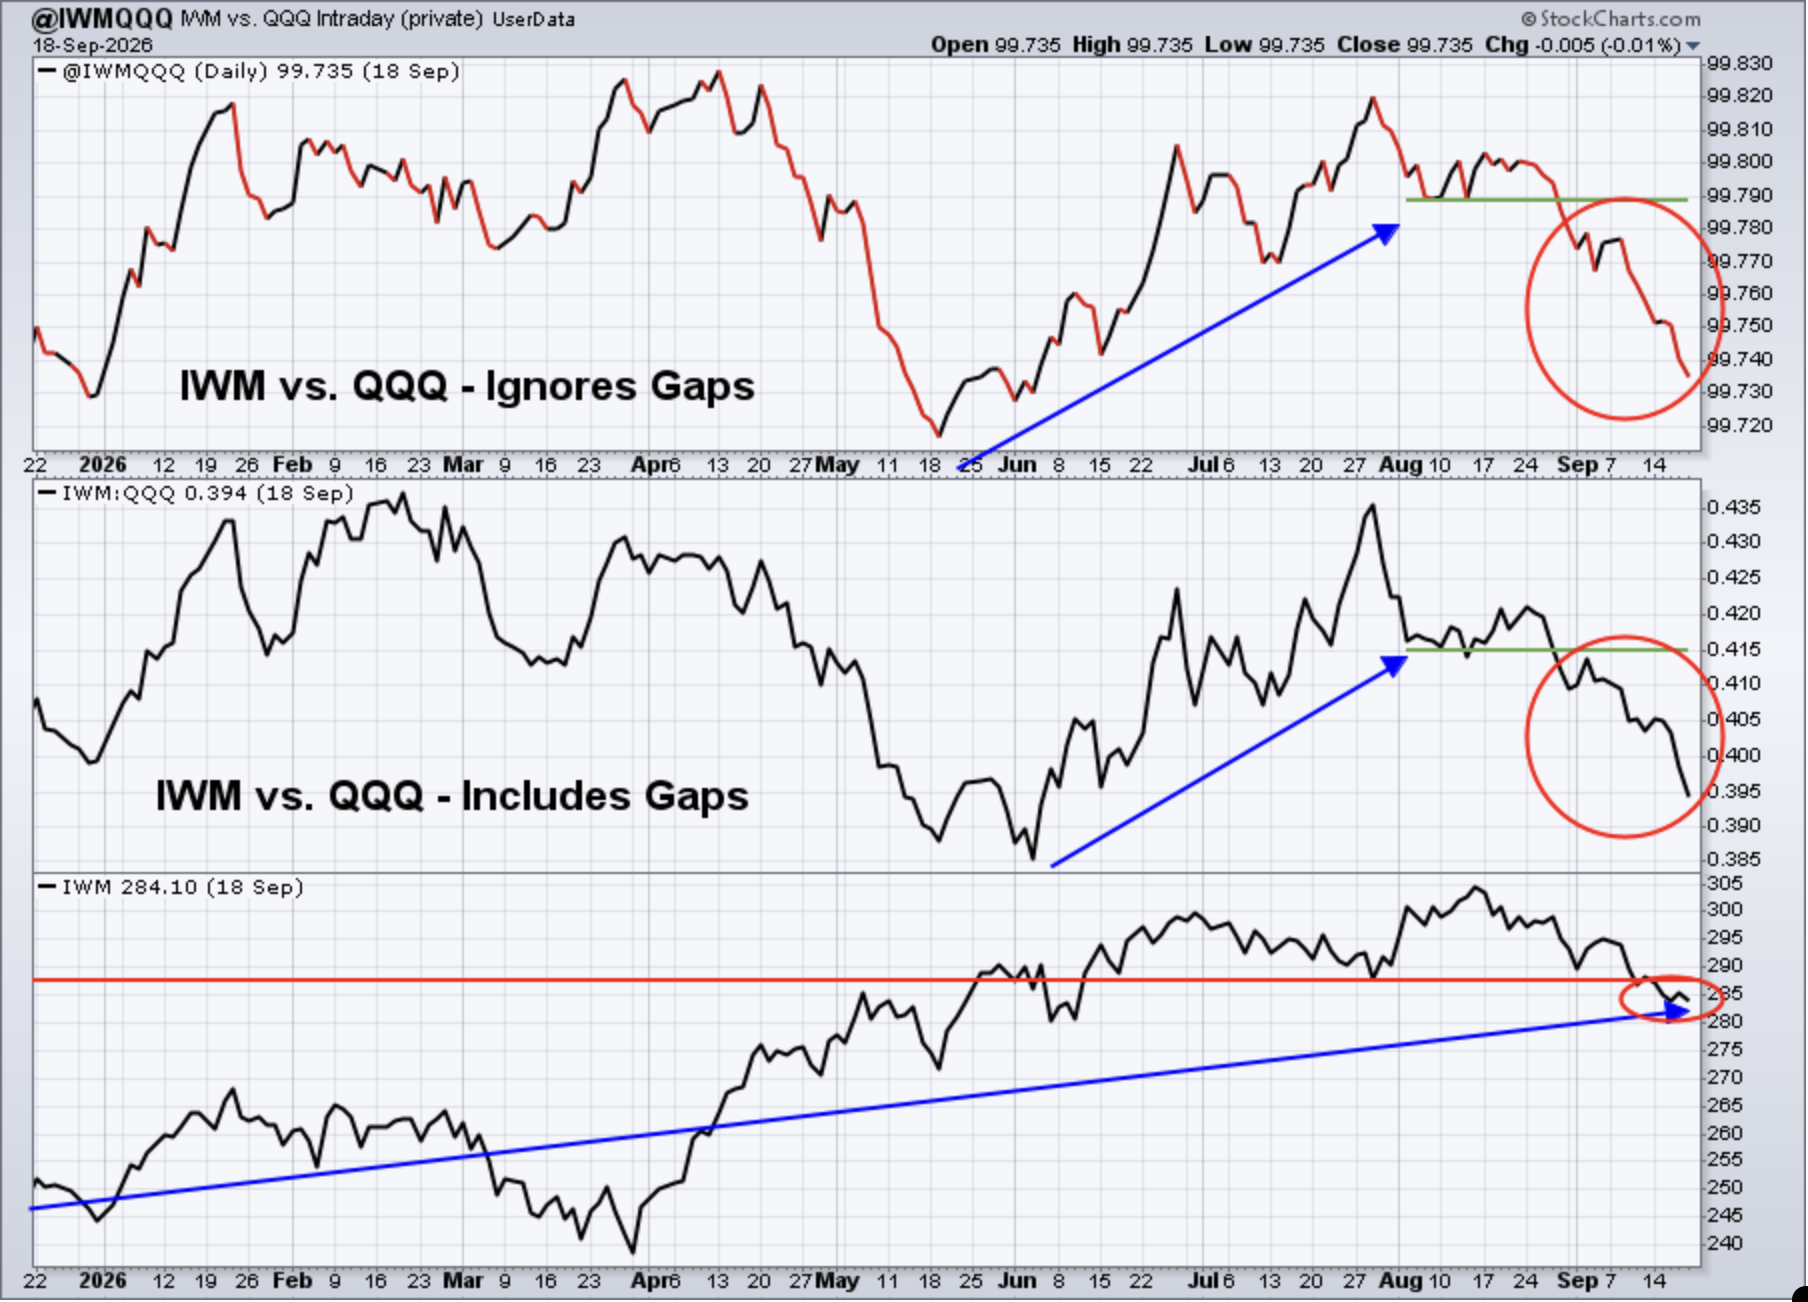
The Fed rate hike squeezes interest margins at small to mid-size banks, potentially cutting borrowing capacity for smaller companies. That short-term issue has absolutely sent investors to the small cap sidelines, at least relative to larger caps. The above chart clearly reflects this, in my view. Small caps are likely to become a solid relative investment again, but Wall Street may need to see the end of the rate hike cycle at the end of the tunnel before that relative strength becomes a reality. I suspect that will be sometime during Q4, possibly the next 4-6 weeks. So long as this relative ratio is declining, the IWM is struggling to keep pace with its large cap counterparts.
XLY:XLP
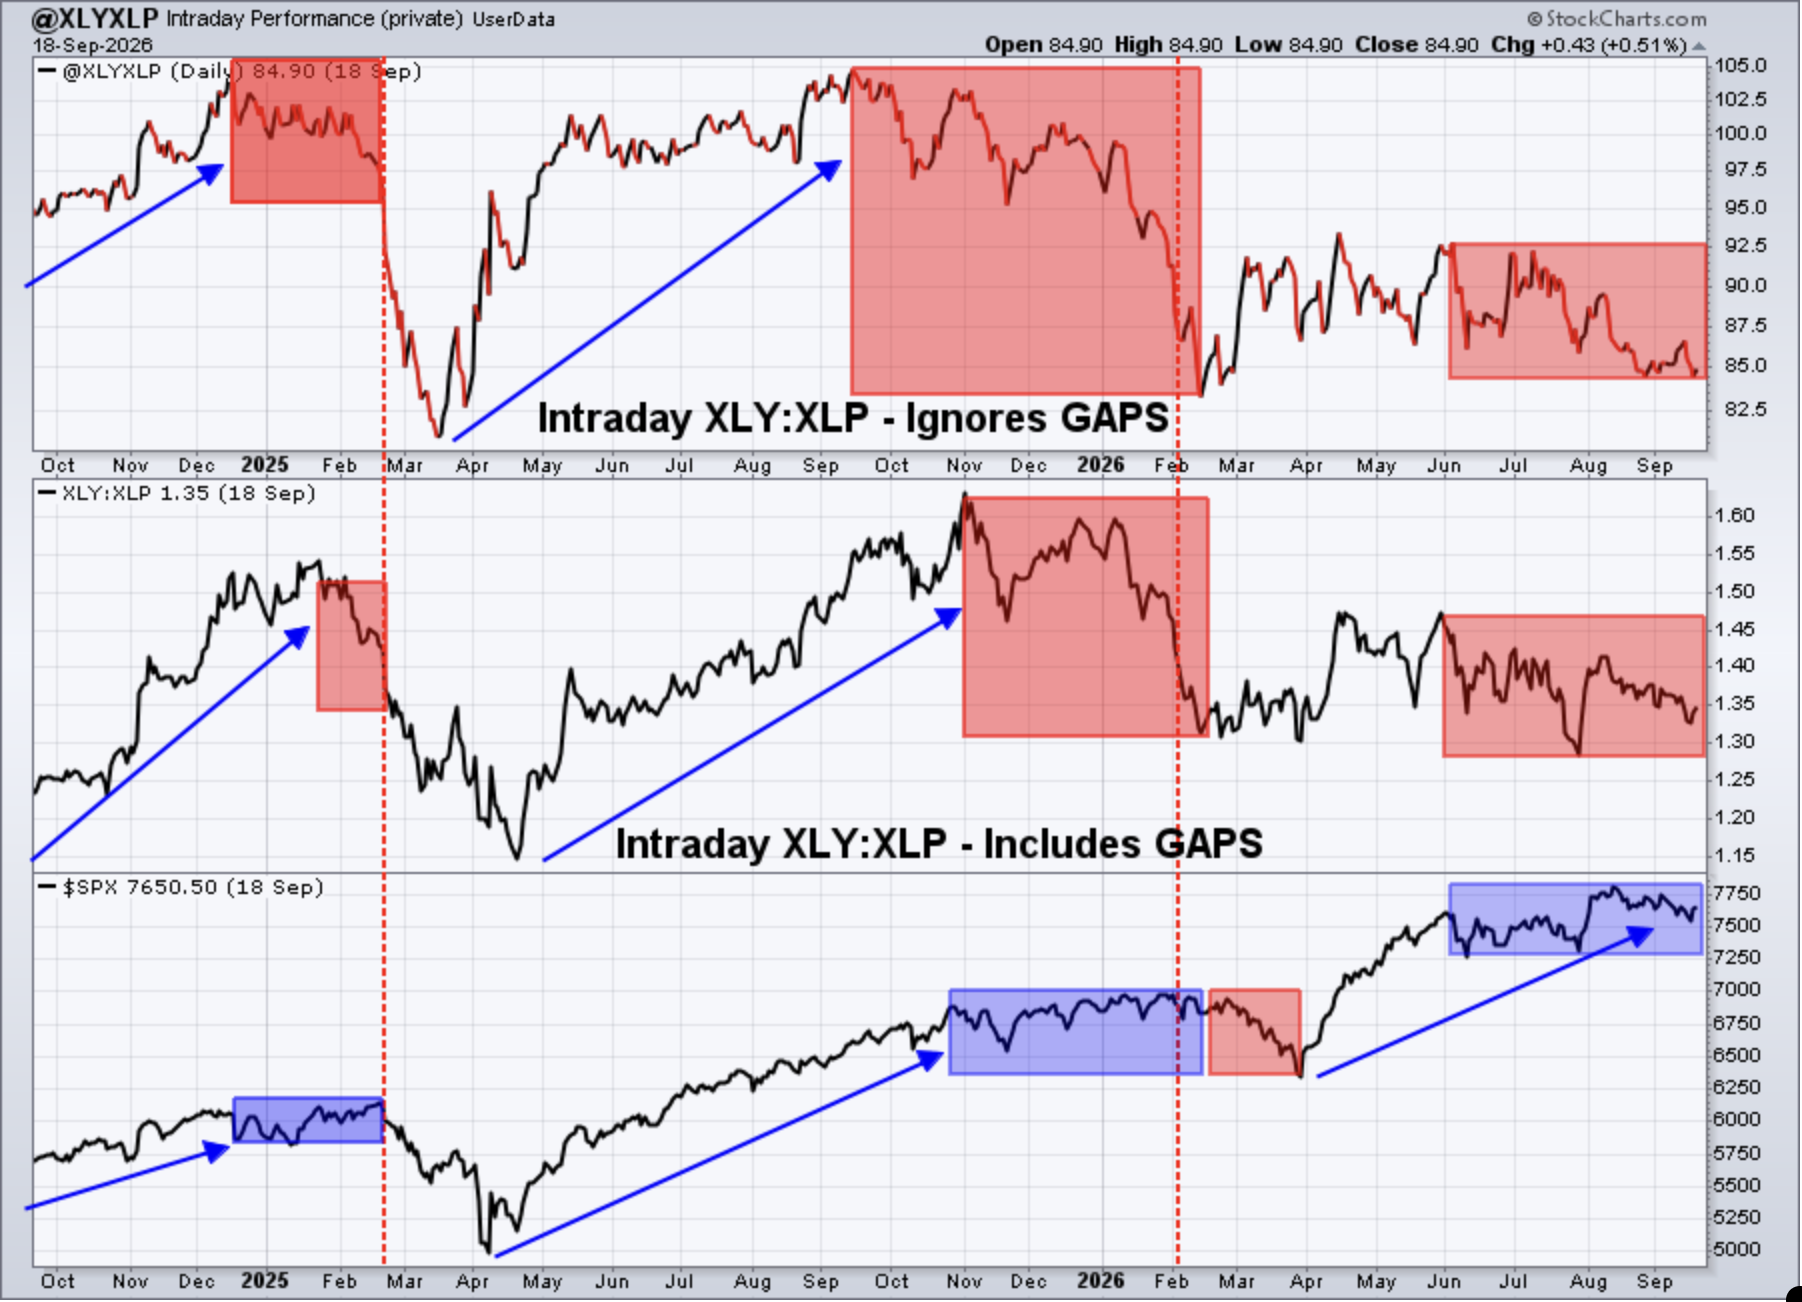
While I wouldn't call this ratio "bullish", I also wouldn't say it's guaranteeing us a big market drop. The long-term ratio does remain in an uptrend, while it's been mostly sideways in 2026. The intraday behavior (top panel) over the summer shows a relative decline in consumer discretionary - perhaps because of growing expectations of a Fed rate hike cycle. We do remain above the April 2025 and February 2026 intraday ratio lows, though the ratio is approaching that February low. I'll be keeping a close eye on this ratio, but I believe we'll see a turn higher before any breakdowns occur.
XLP 30-Day Cumulative Signal
I think it's a good idea to watch this signal regularly (weekly), which is why it's on this Weekly Market Report and will continue to be. We're squarely back in neutral near 100, so it's providing us nothing of use at the moment. For those of you thinking that we're about to have a major drop in the S&P 500, just understand that this signal does not agree with you. I'm a believer in the "there's always a first time for everything", but 106+ readings in this signal have been common place before major selloffs and it makes good common sense to me that we'd see major rotation into staples prior to a big selloff.
It would be fairly unusual for this signal to reach 106 and flash a major top as we move into Q4. I believe the time to keep an eye on this signal would be in the January/February time frame. We'll certainly keep you posted on what we're seeing.
Here's where this signal currently resides:
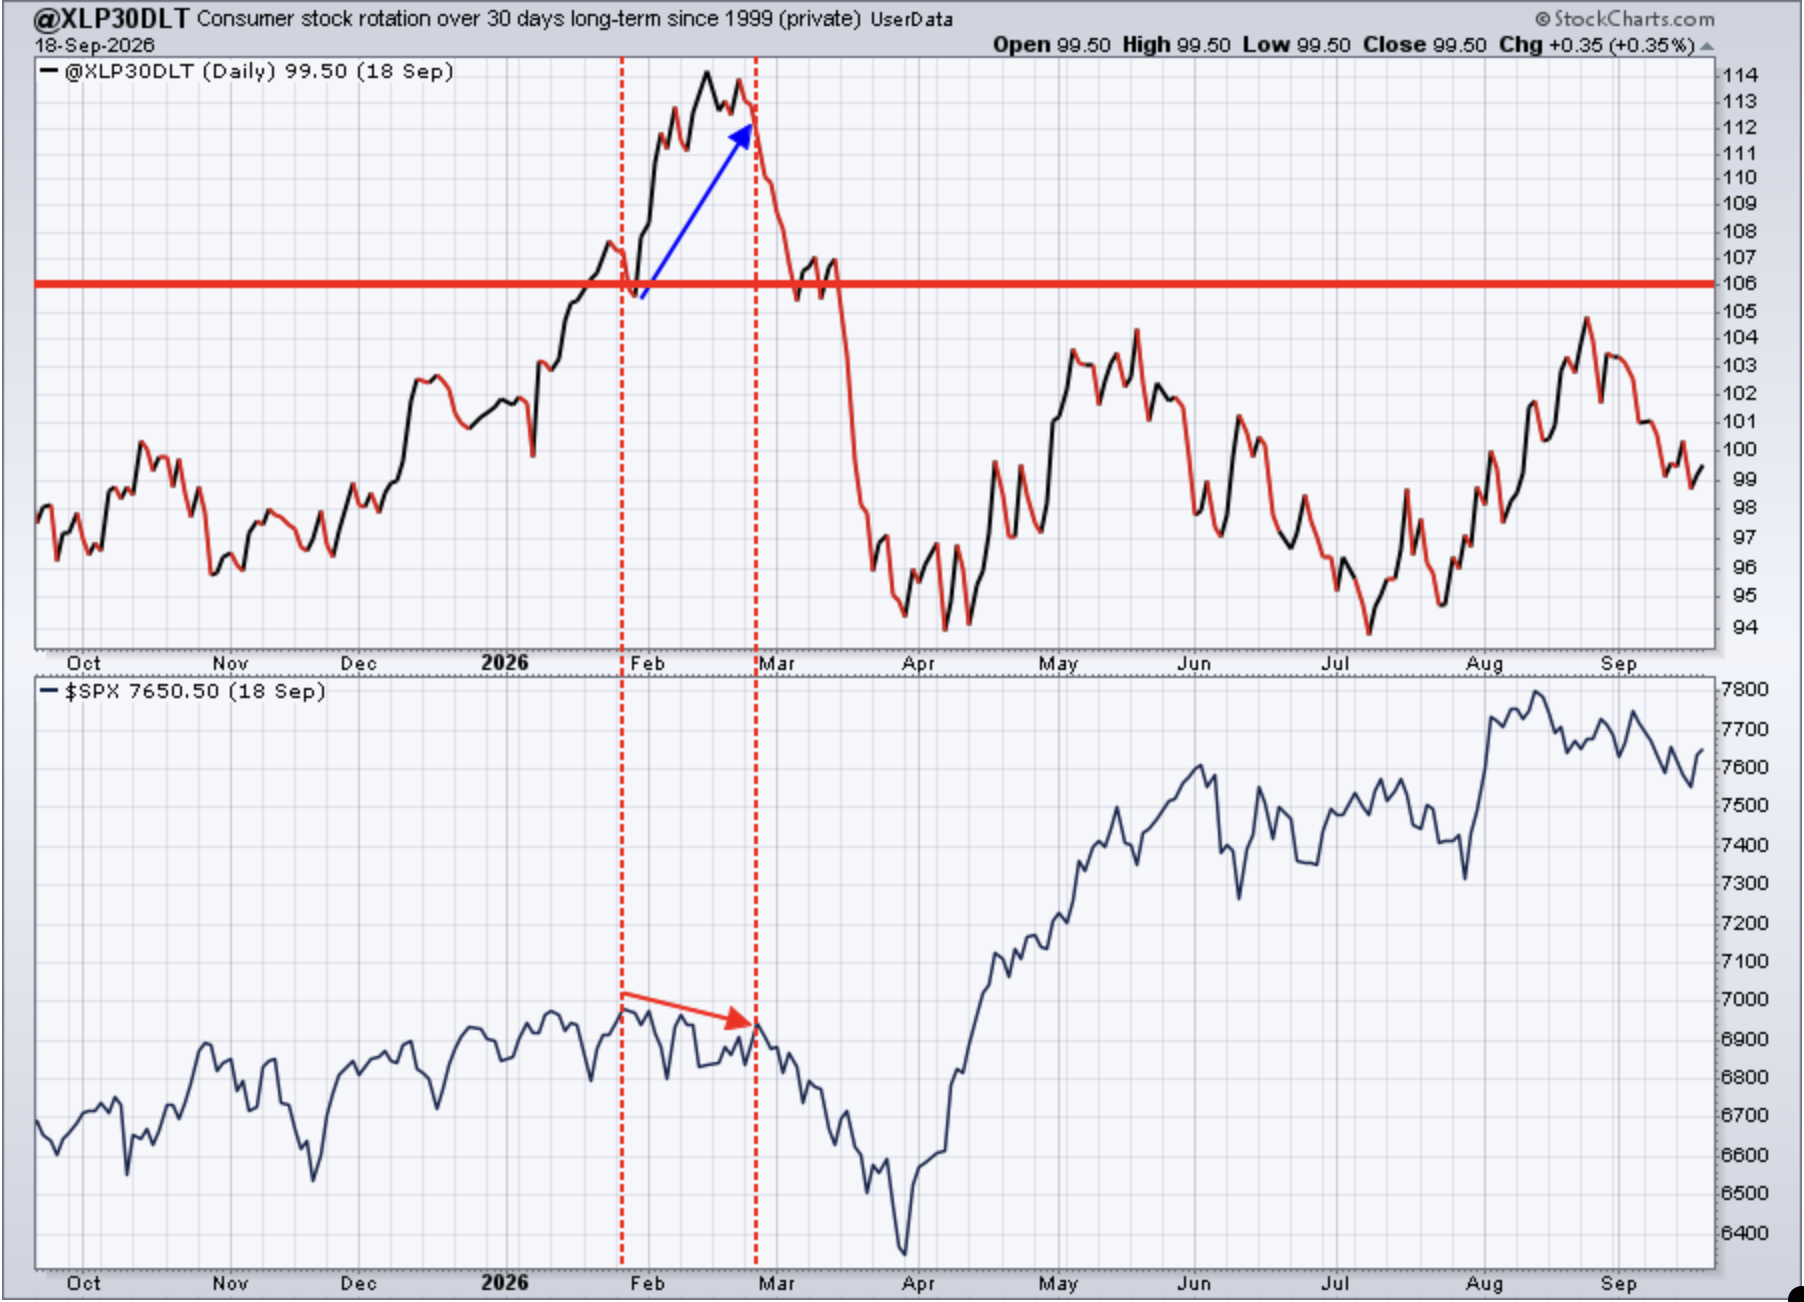
The current reading near 100 is neutral, so it can be ignored for now. It's not giving us a BUY or SELL signal. Always keep in mind that this is just one secondary indicator worth monitoring. It's part of my risk management strategy. My goal is to simply make these secondary indicators stronger and stronger and more reliable, not to provide us guarantees.
Sentiment
5-day SMA ($CPCE)
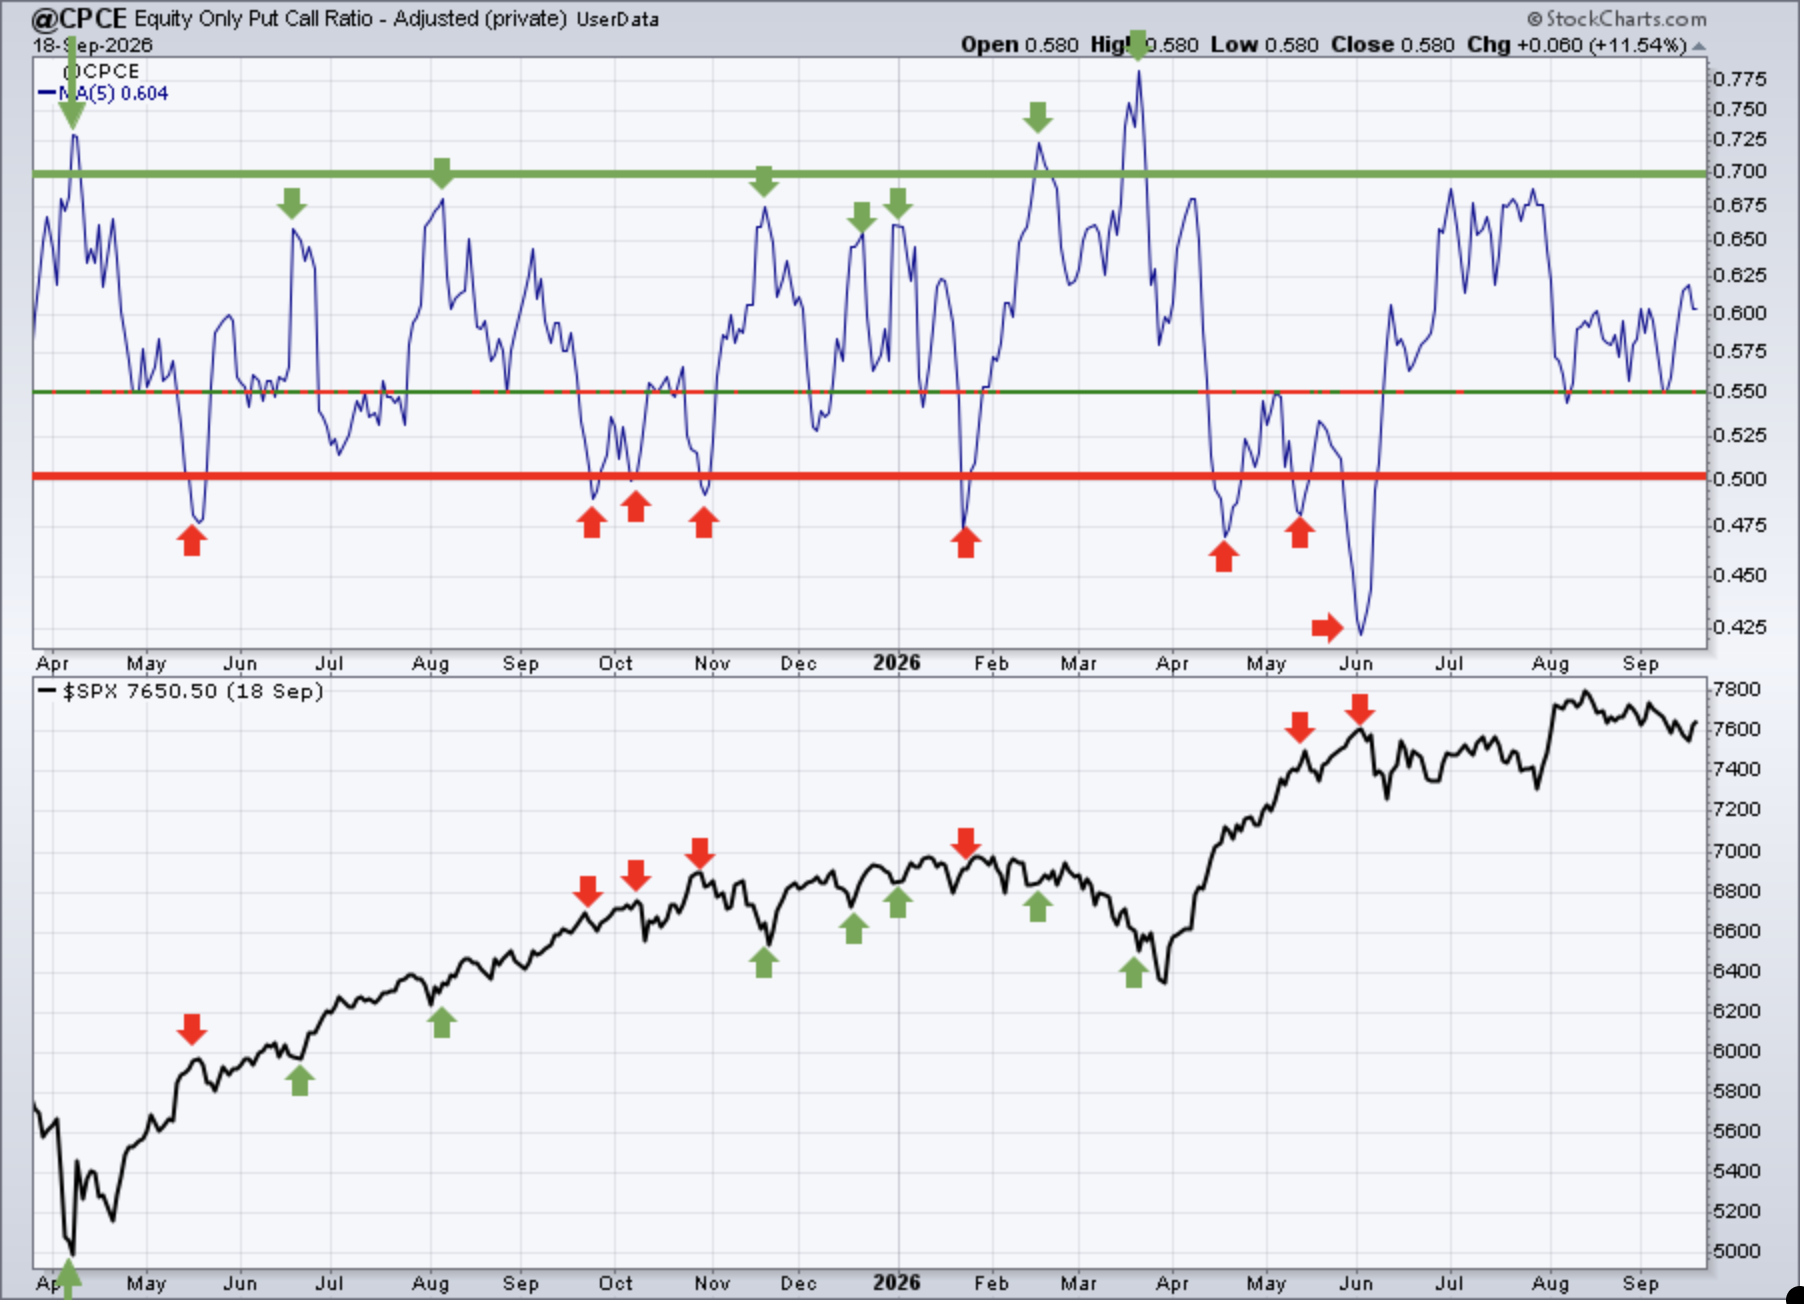
Sentiment indicators are contrarian indicators. When they show extreme bullishness, we need to be a bit cautious and when they show extreme pessimism, it could be time to become much more aggressive. Major market bottoms are carved out when pessimism is at its absolute highest level.
There's been little change in this short-term indicator. It remains neutral and isn't signaling any directional clues.
253-day SMA ($CPCE)
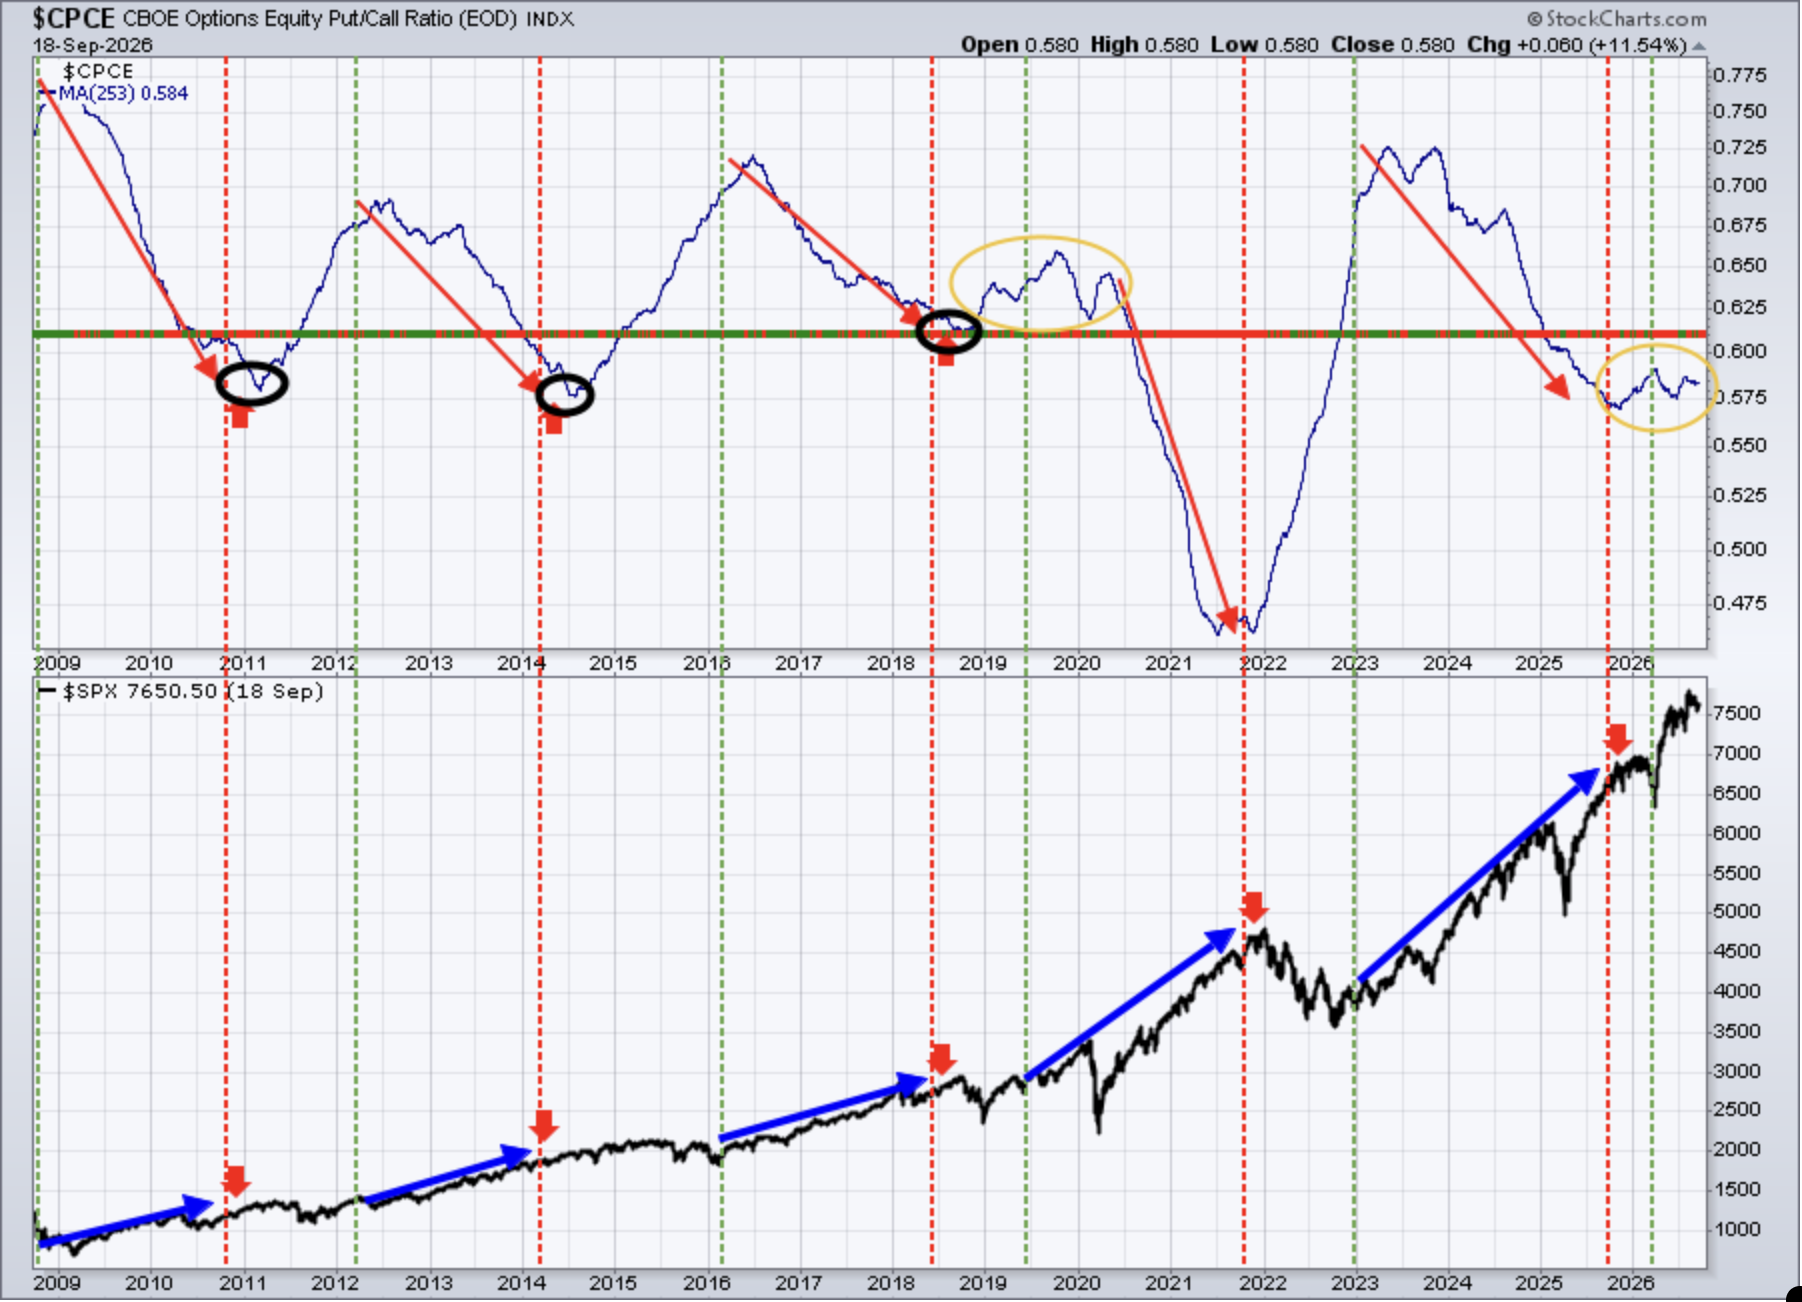
This longer-term 253-day SMA of the CPCE is our "ocean-liner" signal, unlike our short-term speedboat indicator. Any significant change in direction in this 253-day CPCE, in the past, has had profound effects on the S&P 500.
The yellow circle illustrates the total lack of conviction and the hesitation that traders have right now. A downtrend in this ratio generally accompanies a large secular bull market rally in the S&P 500, while an uptrend can spell trouble or, at the very least, lots of back and forth action of this benchmark index. That's been its history. Over the past year, this 253-day SMA can't make up its mind. I view this as neutral as well.
Long-Term Trade Setups
Since beginning this Weekly Market Report in September 2023, I've discussed the long-term trade candidates below that I really like. Generally, these stocks have excellent long-term track records, and many pay nice dividends that mostly grow every year. Only in specific cases (exceptions) would I consider a long-term entry into a stock that has a poor or limited long-term track record and/or pays no dividends. I try to review the long-term picture once a month, and below is how I viewed each MONTHLY chart as of Friday, September 4th:
- JPM - monthly neg divergence remains a potential issue for now
- BA - long-term sideways action in play since start of pandemic
- FFIV - overbought, but long-term uptrend in play
- MA - cup pattern challenging 2025 high near 600, handle could be near 550
- GS - monthly RSI at 79, combined with neg divergence suggests caution
- FDX - beautiful breakout above 240 earlier this year, momentum strong
- AAPL - great long-term chart and not overbought
- CHRW - continues to hold its rising 20-month EMA
- JBHT - breakout in 2026 following years of consolidation is bullish
- STX - consolidation since June high fully warranted and acceptable
- HSY - recent consolidation in 170-190 range, still solid longer-term
- DIS - no follow through yet after August buying
- MSCI - very lengthy consolidation, breakout above 640 would be bullish
- SBUX - similar to MSCI, albeit with more breakout attempts
- KRE - August wasn't kind, but this L/T uptrend remains perfectly in play
- ED - looks solid, remaining in fairly narrow 102-115 range
- AJG - has regained strength, climbing back above its 20-month EMA
- NSC - 2025 cup with handle breakout measures to 375, so more upside ahead
- RHI - nice 2026 rally, but biggest resistance likely to be felt in 50-55 range
- ADM - looks like right side of cup complete, can't rule out 20-month EMA test
- BG - breakout and retest of rising 20-month EMA is technically sound
- CVS - broke out above 95 area and has retested, monthly PPO strong
- HRL - another trip below 20 would clearly establish a positive divergence
- DE - gaining strength and momentum, looks to head higher
- LULU - given earnings debacle, I see this one hitting key support near 80
- TTD - volume massive as selling continues, simply looks like a failure
- META - monthly PPO nearing centerline, likely L/T buy from here
- ADBE - I'm calling recent low a bottom here, first test will be 20-month EMA
- KMB - 90-115 is the range until we see which way it breaks
- ORCL - 115 is major long-term price support; upcoming earnings this week
- ABBV - strengthening, rising 20-month EMA should continue to offer support
- MCD - hasn't found bottom yet, but monthly RSI at 40 lowest since 2003
- MKC - bouncing, but 20-month EMA at 60 will be key resistance
- TSCO - oversold bounce underway, 35 is current price and S/T resistance
Keep in mind that our Weekly Market Reports favor those who are more interested in the long-term market picture. Therefore, the list of stocks above are stocks that we believe are safer (but nothing is ever 100% safe) to own with the long-term in mind. Nearly everything else we do at EarningsBeats.com favors short-term momentum trading, so I wanted to explain what we're doing with this list and why it's different.
Also, please keep in mind that I'm not a Registered Investment Advisor (and neither is EarningsBeats.com nor any of its employees) and am only providing (mostly) what I believe to be solid dividend-paying stocks for the long term. Companies periodically go through adjustments, new competition, restructuring, management changes, etc. that can have detrimental long-term impacts. Neither the stock price nor the dividend is ever guaranteed. I simply point out interesting stock candidates for longer-term investors. Do your own due diligence and please consult with your financial advisor before making any purchases or sales of securities.
Looking Ahead
Upcoming Earnings
The following list of companies is NOT a list of all companies scheduled to report quarterly earnings, however, just key reports, so please be sure to check for earnings dates of any companies that you own. Any company in BOLD represents a stock in one of our portfolios and the amount in parenthesis represents the market capitalization of each company listed:
- Monday: None
- Tuesday: AZO ($46 billion)
- Wednesday: CTAS ($80 billion), PAYX ($41 billion), GIS ($20 billion)
- Thursday: COST ($396 billion), DRI ($24 billion), SNX ($21 billion)
- Friday: None
Key Economic Reports
- Monday: None
- Tuesday: None
- Wednesday: None
- Thursday: Initial jobless claims, August new home sales
- Friday: August durable goods, September consumer sentiment
Historical Data
I'm a true stock market historian. I am absolutely PASSIONATE about studying stock market history to provide us more clues about likely stock market direction and potential sectors/industries/stocks to trade. While I don't use history as a primary indicator, I'm always very aware of it as a secondary indicator. I love it when history lines up with my technical signals, providing me with much more confidence to make particular trades.
Below you'll find the next two weeks of historical data and tendencies across the three key indices that I follow most closely. The percentage for each calendar day represents the annualized return for that day. An example of how this is calculated is reflected next to the first day under the S&P 500 and in parenthesis:
S&P 500 (since 1950)
- Sep 21: -66.86% (Ex: cumulative gains =
-14.27% over 54 trading days since 1950. -14.27% x 253/54 = -66.86%) - Sep 22: -18.36%
- Sep 23: -48.37%
- Sep 24: -30.23%
- Sep 25: -28.14%
- Sep 26: -57.92%
- Sep 27: +5.43%
- Sep 28: +67.63%
- Sep 29: -86.65%
- Sep 30: -19.23%
- Oct 1: +53.74%
- Oct 2: +38.36%
- Oct 3: -11.03%
- Oct 4: +45.76%
NASDAQ (since 1971)
- Sep 21: -95.89%
- Sep 22: -56.66%
- Sep 23: -67.66%
- Sep 24: -23.00%
- Sep 25: -32.24%
- Sep 26: -58.92%
- Sep 27: -31.75%
- Sep 28: +57.82%
- Sep 29: -93.72%
- Sep 30: +3.33%
- Oct 1: +17.90%
- Oct 2: -40.39%
- Oct 3: -9.25%
- Oct 4: +57.17%
Russell 2000 (since 1987)
- Sep 21: -172.80%
- Sep 22: -93.93%
- Sep 23: -81.42%
- Sep 24: -51.74%
- Sep 25: -28.38%
- Sep 26: -47.06%
- Sep 27: +29.24%
- Sep 28: +78.91%
- Sep 29: -48.31%
- Sep 30: +45.33%
- Oct 1: -29.34%
- Oct 2: -72.07%
- Oct 3: -79.80%
- Oct 4: +85.41%
The S&P 500 data dates back to 1950, while the NASDAQ and Russell 2000 information date back to 1971 and 1987, respectively.
Final Thoughts
The Fed did exactly what both the bond and stock markets believed they would do. They raised the fed funds rate by a quarter point, initiating the first interest-rate-hiking cycle since July 2023. Is it a bad thing? Not necessarily, but there is some historical precedent to seeing short-term weakness on the S&P 500 for a period of time after that first rate hike. Yahoo Finance reported last week that the average loss on the S&P 500 6 weeks after the first rate hike is roughly 4%, dating back to the 1990s. I did not verify these numbers, but I wouldn't be surprised if they're correct. The article went on to say that one year after the first hike, the S&P 500 averaged gaining 9% from the date of that first hike. That also doesn't surprise me.
If our economy is strengthening or expected to strengthen, I believe the proper investment move is to allocate more to the stock market and less to the bond market. That strategy sends bond prices lower and corresponding yields higher. That strategy also sends stock prices higher. I believe the real question is......did the Fed raise rates due to rising inflation and an expected continuation of inflationary pressures.....or did the Fed raise rates due to a resilient and potentially-strengthening economy that could derail all prior steps taken to contain inflation? Personally, I believe it's the latter. If the US-Iran war ended tomorrow and crude oil dropped, I do not believe this rate-hiking campaign would last long. I view the Fed's move as somewhat "preventative", not reactionary. But as long as the threat of the current rate-hiking cycle continues, interest-sensitive areas could remain under pressure. They include small caps (IWM), regional banks (KRE), homebuilders (XHB), transporation (IYT), and others. All of those areas have underperformed since the Fed announcement at 2pm ET on Wednesday. I plan to keep watching these areas for clues that the Fed is ending or approaching the end of its rate hiking.
Here's what I'll be thinking about this week:
Interest Rates. I know the Fed has come and gone, but this will be a lingering concern. Will we see a definitive break of 10-year treasury yield ($TNX) resistance at 5.00%. That yield resistance level has held for nearly two decades. A sustained move above it could be a contributing factor in any short-term stock market weakness.
Seasonality. As mentioned last week, the second half of September typically produces much worse results than the first half. The second worst week of the year historically (since 1950) is September 21-27, which starts TODAY. If we're going to see a declining S&P 500, I firmly believe it'll happen over the next 4-6 weeks.
Max Pain. Yes, monthly options expired on Friday. But if you've been an EB member for awhile, or have even been a follower of EB for awhile, then you know that the Monday that follows monthly-options-expiration Friday is the worst day of the calendar month, bar none. That is TODAY.
Technical Conditions. While I believe it still makes sense to be cautious from a short-term trading perspective (I'm always somewhat cautious in the August/September/October time frame), we haven't seen any technical confirmation of a significant selloff. We have mostly been trading sideways, with many areas even moving back up above where they were when the Fed announced its hike on Wednesday afternoon.
Happy trading!
Tom